
|
|||||
|
 | |
| |
| |
| |
| |
| |
|
Gene: MXRA8 |
Gene summary for MXRA8 |
| Gene information | Species | Human | Gene symbol | MXRA8 | Gene ID | 54587 |
| Gene name | matrix remodeling associated 8 | |
| Gene Alias | ASP3 | |
| Cytomap | 1p36.33 | |
| Gene Type | protein-coding | GO ID | GO:0007155 | UniProtAcc | Q9BRK3 |
Top |
Malignant transformation analysis |
| Identification of the aberrant gene expression in precancerous and cancerous lesions by comparing the gene expression of stem-like cells in diseased tissues with normal stem cells |
| Entrez ID | Symbol | Replicates | Species | Organ | Tissue | Adj P-value | Log2FC | Malignancy |
| 54587 | MXRA8 | AEH-subject1 | Human | Endometrium | AEH | 2.43e-20 | -4.90e-01 | -0.3059 |
| 54587 | MXRA8 | AEH-subject2 | Human | Endometrium | AEH | 1.08e-25 | -5.24e-01 | -0.2525 |
| 54587 | MXRA8 | AEH-subject3 | Human | Endometrium | AEH | 4.82e-26 | -5.37e-01 | -0.2576 |
| 54587 | MXRA8 | AEH-subject4 | Human | Endometrium | AEH | 1.31e-11 | -4.30e-01 | -0.2657 |
| 54587 | MXRA8 | AEH-subject5 | Human | Endometrium | AEH | 1.62e-26 | -5.48e-01 | -0.2953 |
| 54587 | MXRA8 | EEC-subject1 | Human | Endometrium | EEC | 7.59e-32 | -5.48e-01 | -0.2682 |
| 54587 | MXRA8 | EEC-subject2 | Human | Endometrium | EEC | 7.64e-34 | -5.57e-01 | -0.2607 |
| 54587 | MXRA8 | EEC-subject3 | Human | Endometrium | EEC | 2.47e-29 | -5.16e-01 | -0.2525 |
| 54587 | MXRA8 | EEC-subject4 | Human | Endometrium | EEC | 2.39e-22 | -4.90e-01 | -0.2571 |
| 54587 | MXRA8 | EEC-subject5 | Human | Endometrium | EEC | 1.15e-31 | -5.49e-01 | -0.249 |
| 54587 | MXRA8 | GSM5276935 | Human | Endometrium | EEC | 1.67e-26 | -5.42e-01 | -0.123 |
| 54587 | MXRA8 | GSM6177620_NYU_UCEC1_lib1_lib1 | Human | Endometrium | EEC | 4.77e-24 | -5.12e-01 | -0.1869 |
| 54587 | MXRA8 | GSM6177620_NYU_UCEC1_lib2_lib2 | Human | Endometrium | EEC | 2.69e-21 | -5.45e-01 | -0.1875 |
| 54587 | MXRA8 | GSM6177620_NYU_UCEC1_lib3_lib3 | Human | Endometrium | EEC | 9.66e-28 | -5.60e-01 | -0.1883 |
| 54587 | MXRA8 | GSM6177621_NYU_UCEC2_lib1_lib1 | Human | Endometrium | EEC | 3.17e-29 | -5.25e-01 | -0.1934 |
| 54587 | MXRA8 | GSM6177622_NYU_UCEC3_lib1_lib1 | Human | Endometrium | EEC | 2.98e-34 | -5.60e-01 | -0.1917 |
| 54587 | MXRA8 | GSM6177622_NYU_UCEC3_lib2_lib2 | Human | Endometrium | EEC | 1.09e-35 | -5.60e-01 | -0.1916 |
| 54587 | MXRA8 | GSM6177623_NYU_UCEC3_Vis | Human | Endometrium | EEC | 2.03e-07 | -1.57e-01 | -0.1269 |
| 54587 | MXRA8 | P2T-E | Human | Esophagus | ESCC | 1.35e-13 | 5.15e-01 | 0.1177 |
| 54587 | MXRA8 | P4T-E | Human | Esophagus | ESCC | 2.04e-07 | 8.51e-01 | 0.1323 |
| Page: 1 2 3 |
| Tissue | Expression Dynamics | Abbreviation |
| Endometrium | 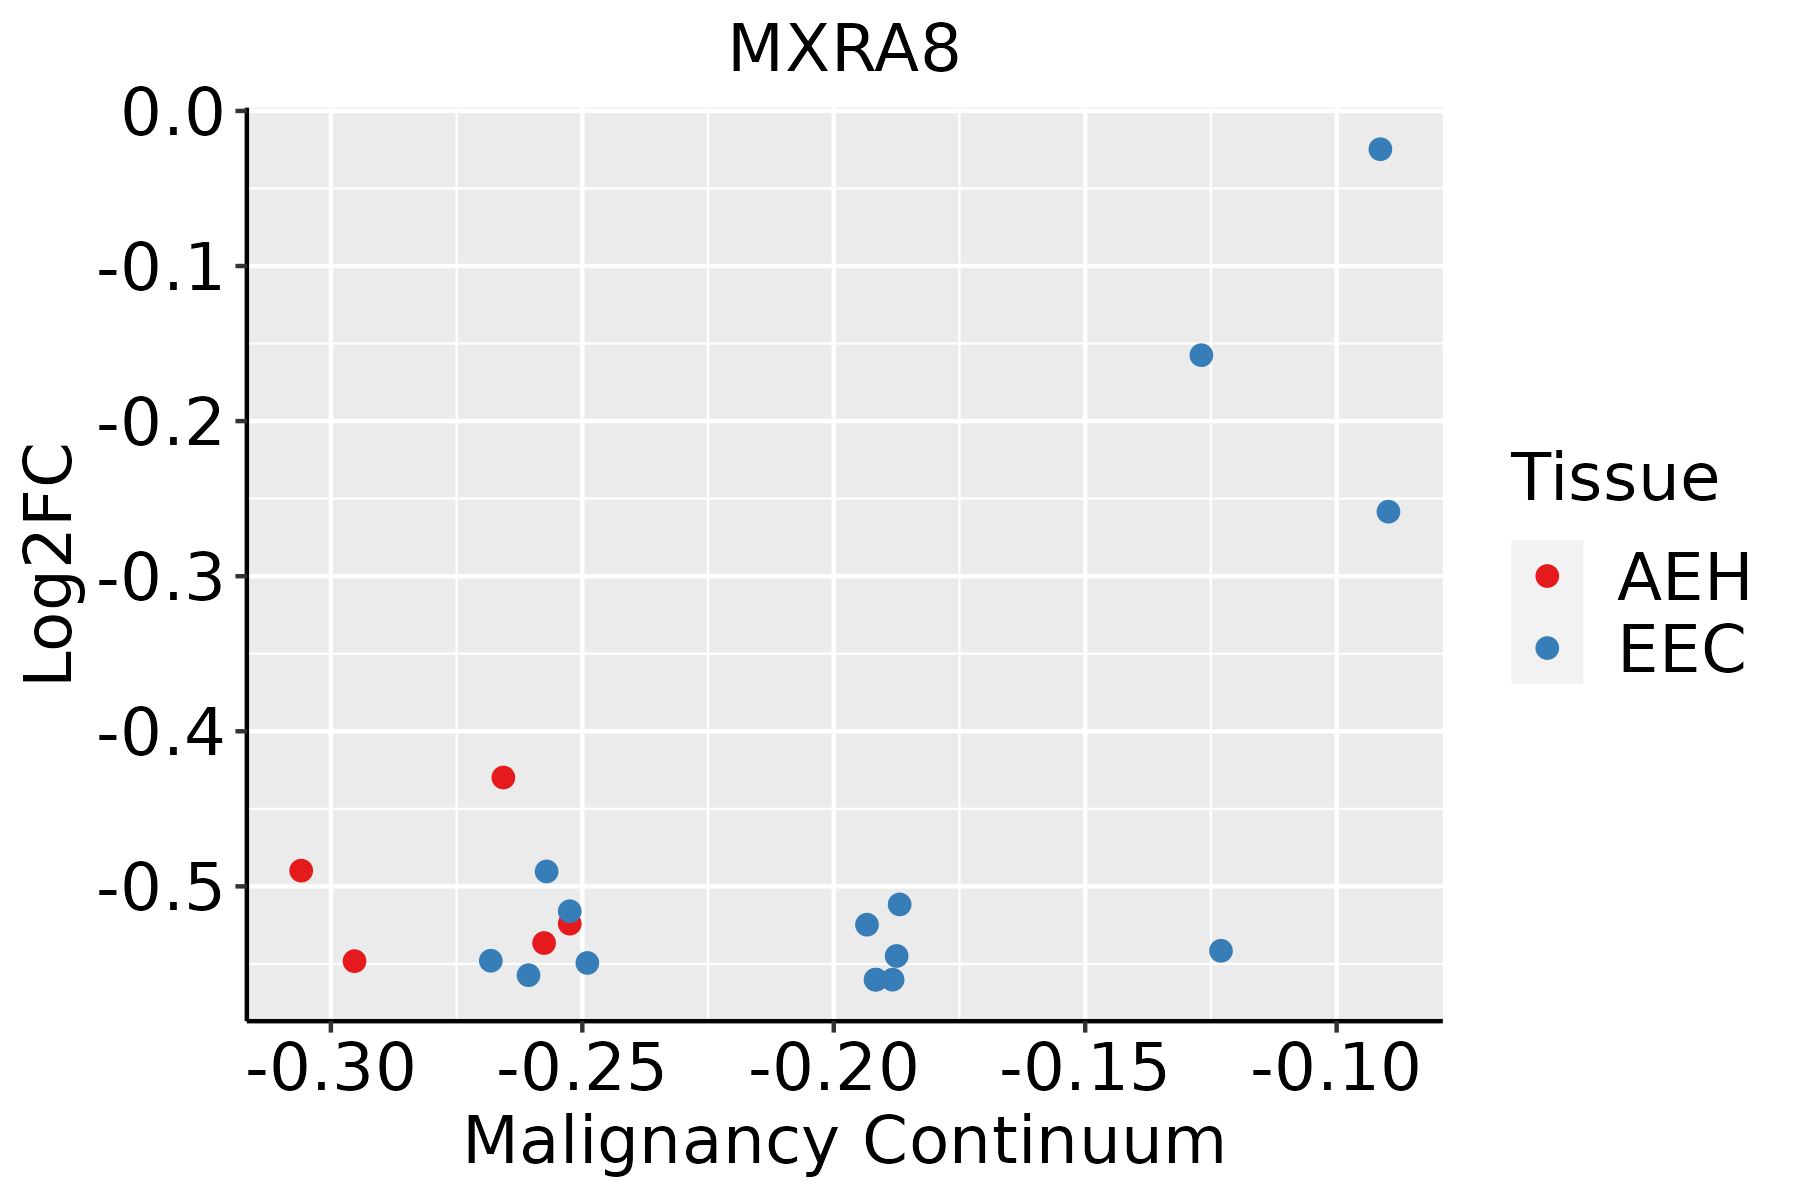 | AEH: Atypical endometrial hyperplasia |
| EEC: Endometrioid Cancer | ||
| Esophagus | 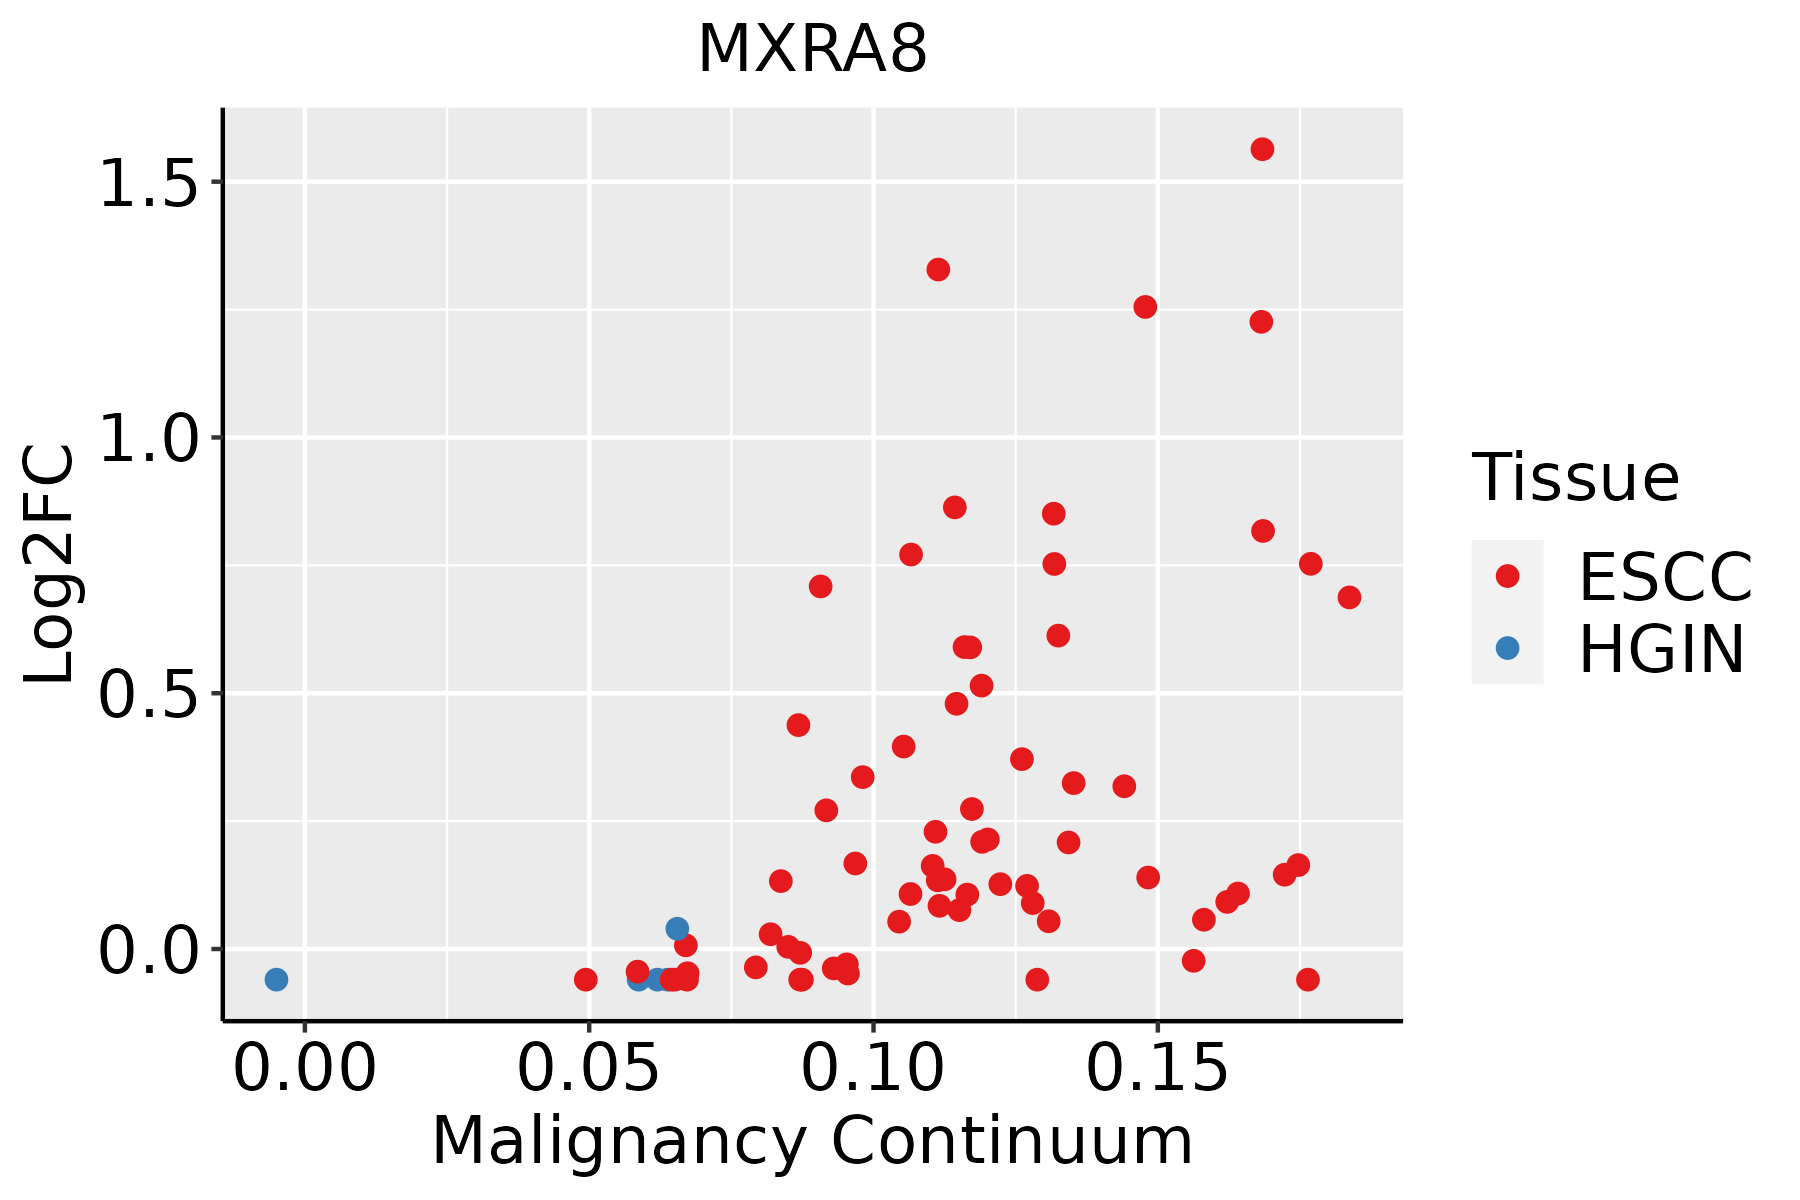 | ESCC: Esophageal squamous cell carcinoma |
| HGIN: High-grade intraepithelial neoplasias | ||
| LGIN: Low-grade intraepithelial neoplasias | ||
| Liver |  | HCC: Hepatocellular carcinoma |
| NAFLD: Non-alcoholic fatty liver disease | ||
| Oral Cavity | 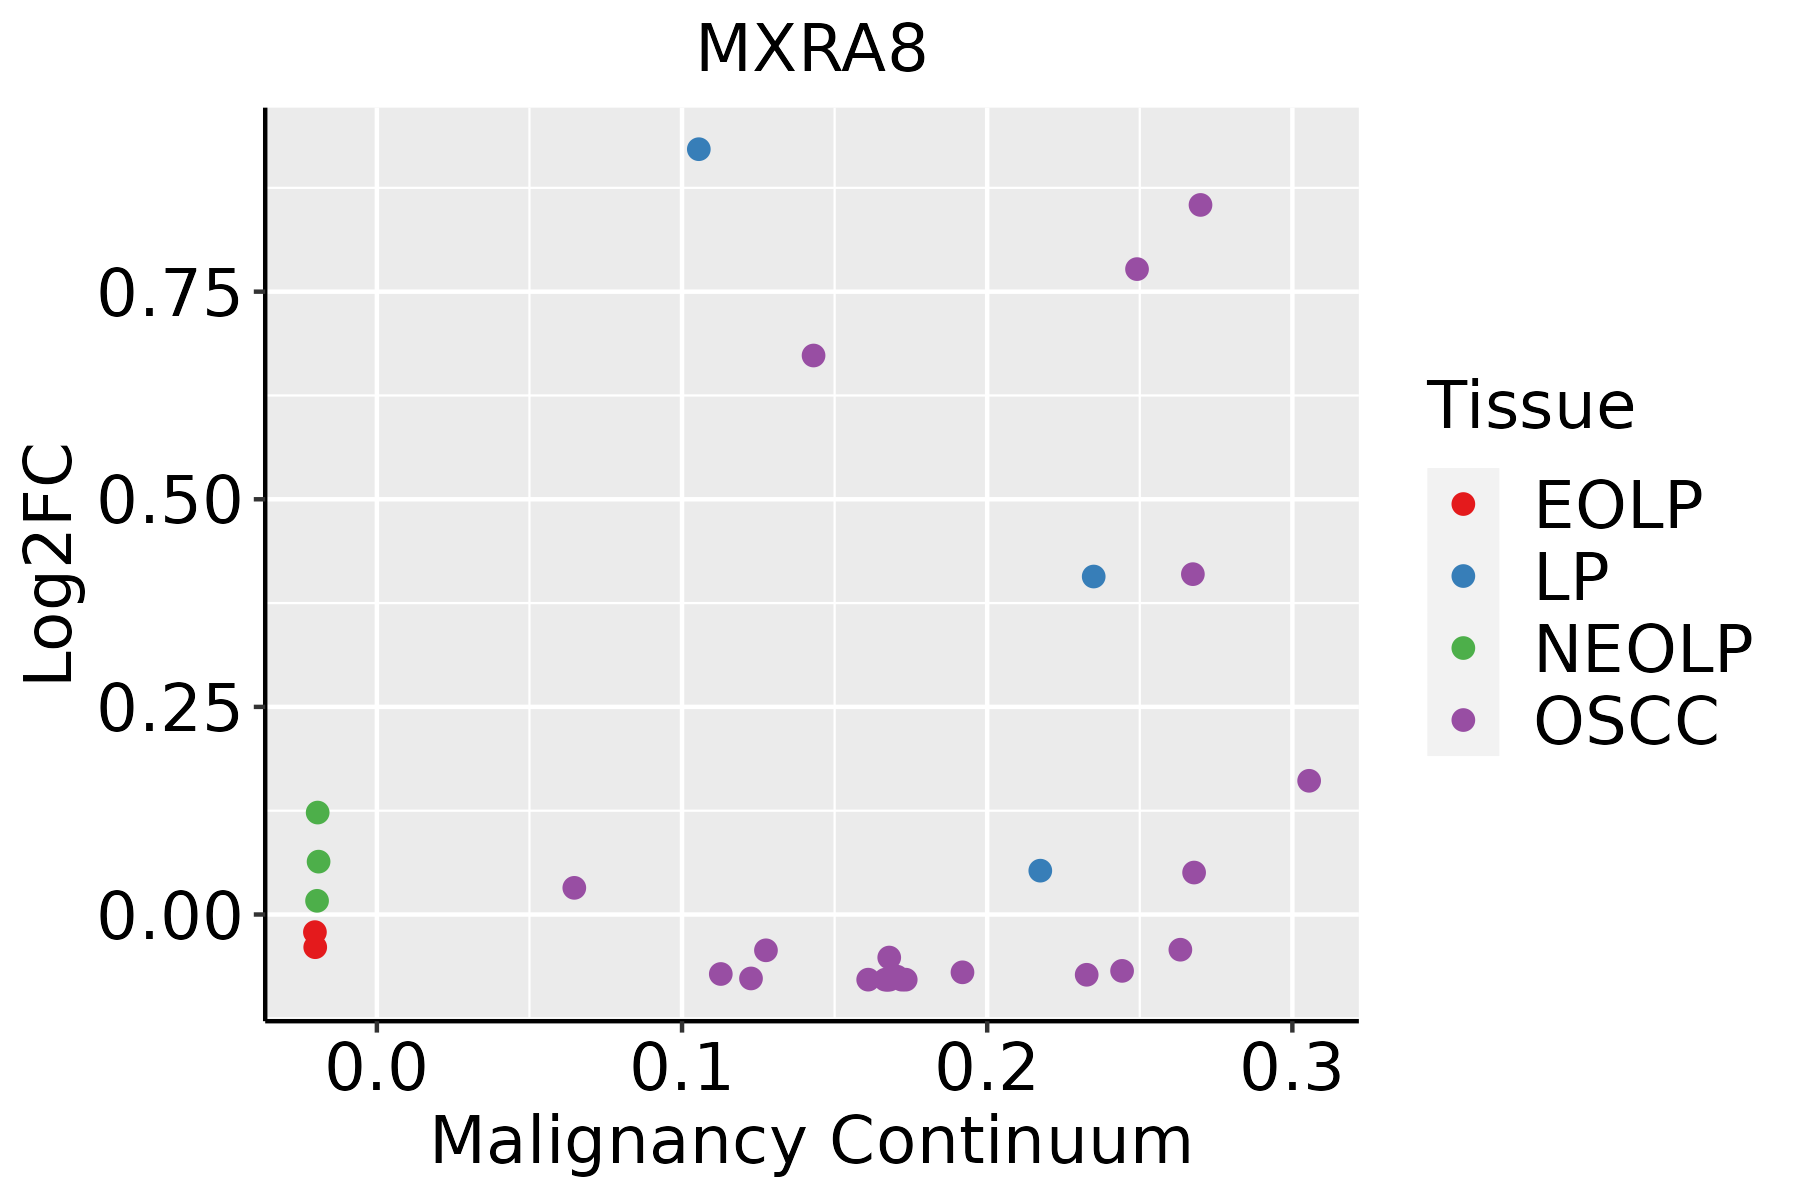 | EOLP: Erosive Oral lichen planus |
| LP: leukoplakia | ||
| NEOLP: Non-erosive oral lichen planus | ||
| OSCC: Oral squamous cell carcinoma | ||
| Thyroid |  | ATC: Anaplastic thyroid cancer |
| HT: Hashimoto's thyroiditis | ||
| PTC: Papillary thyroid cancer |
| ∗log2FC in expression of this searched gene in stem-like cells from each diseased tissue sample relative to stem-like cells in normal samples in each tissue plotted against the malignancy continuum. Samples are colored based on if they are from different disease stage. |
Top |
Malignant transformation related pathway analysis |
| Find out the enriched GO biological processes and KEGG pathways involved in transition from healthy to precancer to cancer |
| Tissue | Disease Stage | Enriched GO biological Processes |
| Colorectum | AD |  |
| Colorectum | SER |  |
| Colorectum | MSS |  |
| Colorectum | MSI-H |  |
| Colorectum | FAP |  |
| ∗Top 15 enriched GO BP terms are showed in the bar plot of each disease state in each tissue. Each row represents a significant GO biological process which is colored according to the -log10(p.adjust). |
| Page: 1 2 3 4 5 6 7 8 9 |
| GO ID | Tissue | Disease Stage | Description | Gene Ratio | Bg Ratio | pvalue | p.adjust | Count |
| GO:00420636 | Esophagus | ESCC | gliogenesis | 172/8552 | 301/18723 | 3.75e-05 | 3.04e-04 | 172 |
| GO:00100016 | Esophagus | ESCC | glial cell differentiation | 129/8552 | 225/18723 | 2.73e-04 | 1.65e-03 | 129 |
| GO:0042063 | Liver | Cirrhotic | gliogenesis | 98/4634 | 301/18723 | 1.28e-03 | 8.60e-03 | 98 |
| GO:0010001 | Liver | Cirrhotic | glial cell differentiation | 75/4634 | 225/18723 | 2.24e-03 | 1.36e-02 | 75 |
| GO:00420631 | Liver | HCC | gliogenesis | 148/7958 | 301/18723 | 1.10e-02 | 4.07e-02 | 148 |
| GO:00420635 | Oral cavity | OSCC | gliogenesis | 154/7305 | 301/18723 | 1.10e-05 | 1.14e-04 | 154 |
| GO:00100015 | Oral cavity | OSCC | glial cell differentiation | 110/7305 | 225/18723 | 1.56e-03 | 7.45e-03 | 110 |
| GO:004206313 | Oral cavity | LP | gliogenesis | 104/4623 | 301/18723 | 7.21e-05 | 9.49e-04 | 104 |
| GO:001000111 | Oral cavity | LP | glial cell differentiation | 78/4623 | 225/18723 | 4.82e-04 | 4.52e-03 | 78 |
| GO:004206315 | Thyroid | PTC | gliogenesis | 121/5968 | 301/18723 | 1.30e-03 | 7.41e-03 | 121 |
| GO:004206323 | Thyroid | ATC | gliogenesis | 127/6293 | 301/18723 | 1.07e-03 | 5.66e-03 | 127 |
| Page: 1 |
| Pathway ID | Tissue | Disease Stage | Description | Gene Ratio | Bg Ratio | pvalue | p.adjust | qvalue | Count |
| Page: 1 |
Top |
Cell-cell communication analysis |
| Identification of potential cell-cell interactions between two cell types and their ligand-receptor pairs for different disease states |
| Ligand | Receptor | LRpair | Pathway | Tissue | Disease Stage |
| Page: 1 |
Top |
Single-cell gene regulatory network inference analysis |
| Find out the significant the regulons (TFs) and the target genes of each regulon across cell types for different disease states |
| TF | Cell Type | Tissue | Disease Stage | Target Gene | RSS | Regulon Activity |
| ∗The dot plots of a searched regulon are shown for all cell subpopulations in each disease state of each tissue based on the regulon specific score inferred using pySCENIC and by calculating the average expression. |
| Page: 1 |
Top |
Somatic mutation of malignant transformation related genes |
| Annotation of somatic variants for genes involved in malignant transformation |
| Hugo Symbol | Variant Class | Variant Classification | dbSNP RS | HGVSc | HGVSp | HGVSp Short | SWISSPROT | BIOTYPE | SIFT | PolyPhen | Tumor Sample Barcode | Tissue | Histology | Sex | Age | Stage | Therapy Types | Drugs | Outcome |
| MXRA8 | SNV | Missense_Mutation | rs367562728 | c.1308N>G | p.Ile436Met | p.I436M | Q9BRK3 | protein_coding | deleterious(0) | possibly_damaging(0.605) | TCGA-C5-A7CL-01 | Cervix | cervical & endocervical cancer | Female | <65 | III/IV | Chemotherapy | cisplatin | PD |
| MXRA8 | SNV | Missense_Mutation | novel | c.1191N>C | p.Gln397His | p.Q397H | Q9BRK3 | protein_coding | tolerated(0.5) | possibly_damaging(0.634) | TCGA-MA-AA41-01 | Cervix | cervical & endocervical cancer | Female | <65 | I/II | Unknown | Unknown | SD |
| MXRA8 | SNV | Missense_Mutation | c.997G>A | p.Glu333Lys | p.E333K | Q9BRK3 | protein_coding | deleterious(0) | probably_damaging(0.966) | TCGA-A6-2686-01 | Colorectum | colon adenocarcinoma | Female | >=65 | I/II | Unknown | Unknown | SD | |
| MXRA8 | SNV | Missense_Mutation | c.982A>G | p.Asn328Asp | p.N328D | Q9BRK3 | protein_coding | deleterious(0.02) | possibly_damaging(0.691) | TCGA-A6-5661-01 | Colorectum | colon adenocarcinoma | Female | >=65 | I/II | Unknown | Unknown | SD | |
| MXRA8 | SNV | Missense_Mutation | c.742G>A | p.Asp248Asn | p.D248N | Q9BRK3 | protein_coding | tolerated(0.14) | benign(0.022) | TCGA-CK-4951-01 | Colorectum | colon adenocarcinoma | Female | >=65 | I/II | Unknown | Unknown | PD | |
| MXRA8 | SNV | Missense_Mutation | rs754512875 | c.703G>A | p.Gly235Arg | p.G235R | Q9BRK3 | protein_coding | deleterious(0) | probably_damaging(0.953) | TCGA-CM-6674-01 | Colorectum | colon adenocarcinoma | Male | <65 | I/II | Unknown | Unknown | SD |
| MXRA8 | SNV | Missense_Mutation | rs61730211 | c.965N>A | p.Arg322His | p.R322H | Q9BRK3 | protein_coding | tolerated(0.09) | possibly_damaging(0.882) | TCGA-D5-6928-01 | Colorectum | colon adenocarcinoma | Male | >=65 | I/II | Unknown | Unknown | SD |
| MXRA8 | SNV | Missense_Mutation | c.755G>A | p.Arg252His | p.R252H | Q9BRK3 | protein_coding | tolerated(0.59) | possibly_damaging(0.871) | TCGA-G4-6304-01 | Colorectum | colon adenocarcinoma | Female | >=65 | I/II | Chemotherapy | fluorouracil | PD | |
| MXRA8 | deletion | Frame_Shift_Del | rs764857791 | c.901delN | p.Arg301GlyfsTer107 | p.R301Gfs*107 | Q9BRK3 | protein_coding | TCGA-5M-AAT6-01 | Colorectum | colon adenocarcinoma | Female | <65 | III/IV | Unknown | Unknown | PD | ||
| MXRA8 | deletion | Frame_Shift_Del | rs764857791 | c.901delC | p.Arg301GlyfsTer107 | p.R301Gfs*107 | Q9BRK3 | protein_coding | TCGA-A6-2686-01 | Colorectum | colon adenocarcinoma | Female | >=65 | I/II | Unknown | Unknown | SD |
| Page: 1 2 3 4 5 6 7 |
Top |
Related drugs of malignant transformation related genes |
| Identification of chemicals and drugs interact with genes involved in malignant transfromation |
| (DGIdb 4.0) |
| Entrez ID | Symbol | Category | Interaction Types | Drug Claim Name | Drug Name | PMIDs |
| Page: 1 |

Copyright 2023-Present -The University of Texas Health Science Center at Houston |