
|
|||||
|
 | |
| |
| |
| |
| |
| |
|
Gene: MXRA5 |
Gene summary for MXRA5 |
| Gene information | Species | Human | Gene symbol | MXRA5 | Gene ID | 25878 |
| Gene name | matrix remodeling associated 5 | |
| Gene Alias | MXRA5 | |
| Cytomap | Xp22.33 | |
| Gene Type | protein-coding | GO ID | GO:0008150 | UniProtAcc | Q9NR99 |
Top |
Malignant transformation analysis |
| Identification of the aberrant gene expression in precancerous and cancerous lesions by comparing the gene expression of stem-like cells in diseased tissues with normal stem cells |
| Entrez ID | Symbol | Replicates | Species | Organ | Tissue | Adj P-value | Log2FC | Malignancy |
| 25878 | MXRA5 | LZE8T | Human | Esophagus | ESCC | 8.06e-04 | 1.35e-01 | 0.067 |
| 25878 | MXRA5 | LZE20T | Human | Esophagus | ESCC | 2.73e-03 | 2.06e-01 | 0.0662 |
| 25878 | MXRA5 | P5T-E | Human | Esophagus | ESCC | 5.64e-05 | 3.91e-01 | 0.1327 |
| 25878 | MXRA5 | P8T-E | Human | Esophagus | ESCC | 5.17e-13 | 5.56e-01 | 0.0889 |
| 25878 | MXRA5 | P9T-E | Human | Esophagus | ESCC | 7.09e-07 | 5.17e-01 | 0.1131 |
| 25878 | MXRA5 | P10T-E | Human | Esophagus | ESCC | 1.10e-18 | 5.46e-01 | 0.116 |
| 25878 | MXRA5 | P11T-E | Human | Esophagus | ESCC | 3.35e-21 | 1.14e+00 | 0.1426 |
| 25878 | MXRA5 | P12T-E | Human | Esophagus | ESCC | 1.12e-11 | 3.75e-01 | 0.1122 |
| 25878 | MXRA5 | P15T-E | Human | Esophagus | ESCC | 2.50e-06 | 4.52e-01 | 0.1149 |
| 25878 | MXRA5 | P21T-E | Human | Esophagus | ESCC | 3.89e-07 | 2.54e-01 | 0.1617 |
| 25878 | MXRA5 | P32T-E | Human | Esophagus | ESCC | 2.29e-02 | 3.35e-01 | 0.1666 |
| 25878 | MXRA5 | P36T-E | Human | Esophagus | ESCC | 2.00e-05 | 5.52e-01 | 0.1187 |
| 25878 | MXRA5 | P42T-E | Human | Esophagus | ESCC | 3.30e-03 | 4.91e-01 | 0.1175 |
| 25878 | MXRA5 | P44T-E | Human | Esophagus | ESCC | 1.02e-11 | 9.87e-01 | 0.1096 |
| 25878 | MXRA5 | P47T-E | Human | Esophagus | ESCC | 3.74e-10 | 6.79e-01 | 0.1067 |
| 25878 | MXRA5 | P54T-E | Human | Esophagus | ESCC | 4.50e-05 | 1.45e-01 | 0.0975 |
| 25878 | MXRA5 | P61T-E | Human | Esophagus | ESCC | 4.08e-33 | 1.59e+00 | 0.099 |
| 25878 | MXRA5 | P62T-E | Human | Esophagus | ESCC | 1.48e-05 | 1.68e-01 | 0.1302 |
| 25878 | MXRA5 | P65T-E | Human | Esophagus | ESCC | 1.49e-04 | 2.78e-01 | 0.0978 |
| 25878 | MXRA5 | P79T-E | Human | Esophagus | ESCC | 6.28e-13 | 4.43e-01 | 0.1154 |
| Page: 1 2 3 |
| Tissue | Expression Dynamics | Abbreviation |
| Esophagus |  | ESCC: Esophageal squamous cell carcinoma |
| HGIN: High-grade intraepithelial neoplasias | ||
| LGIN: Low-grade intraepithelial neoplasias | ||
| Oral Cavity | 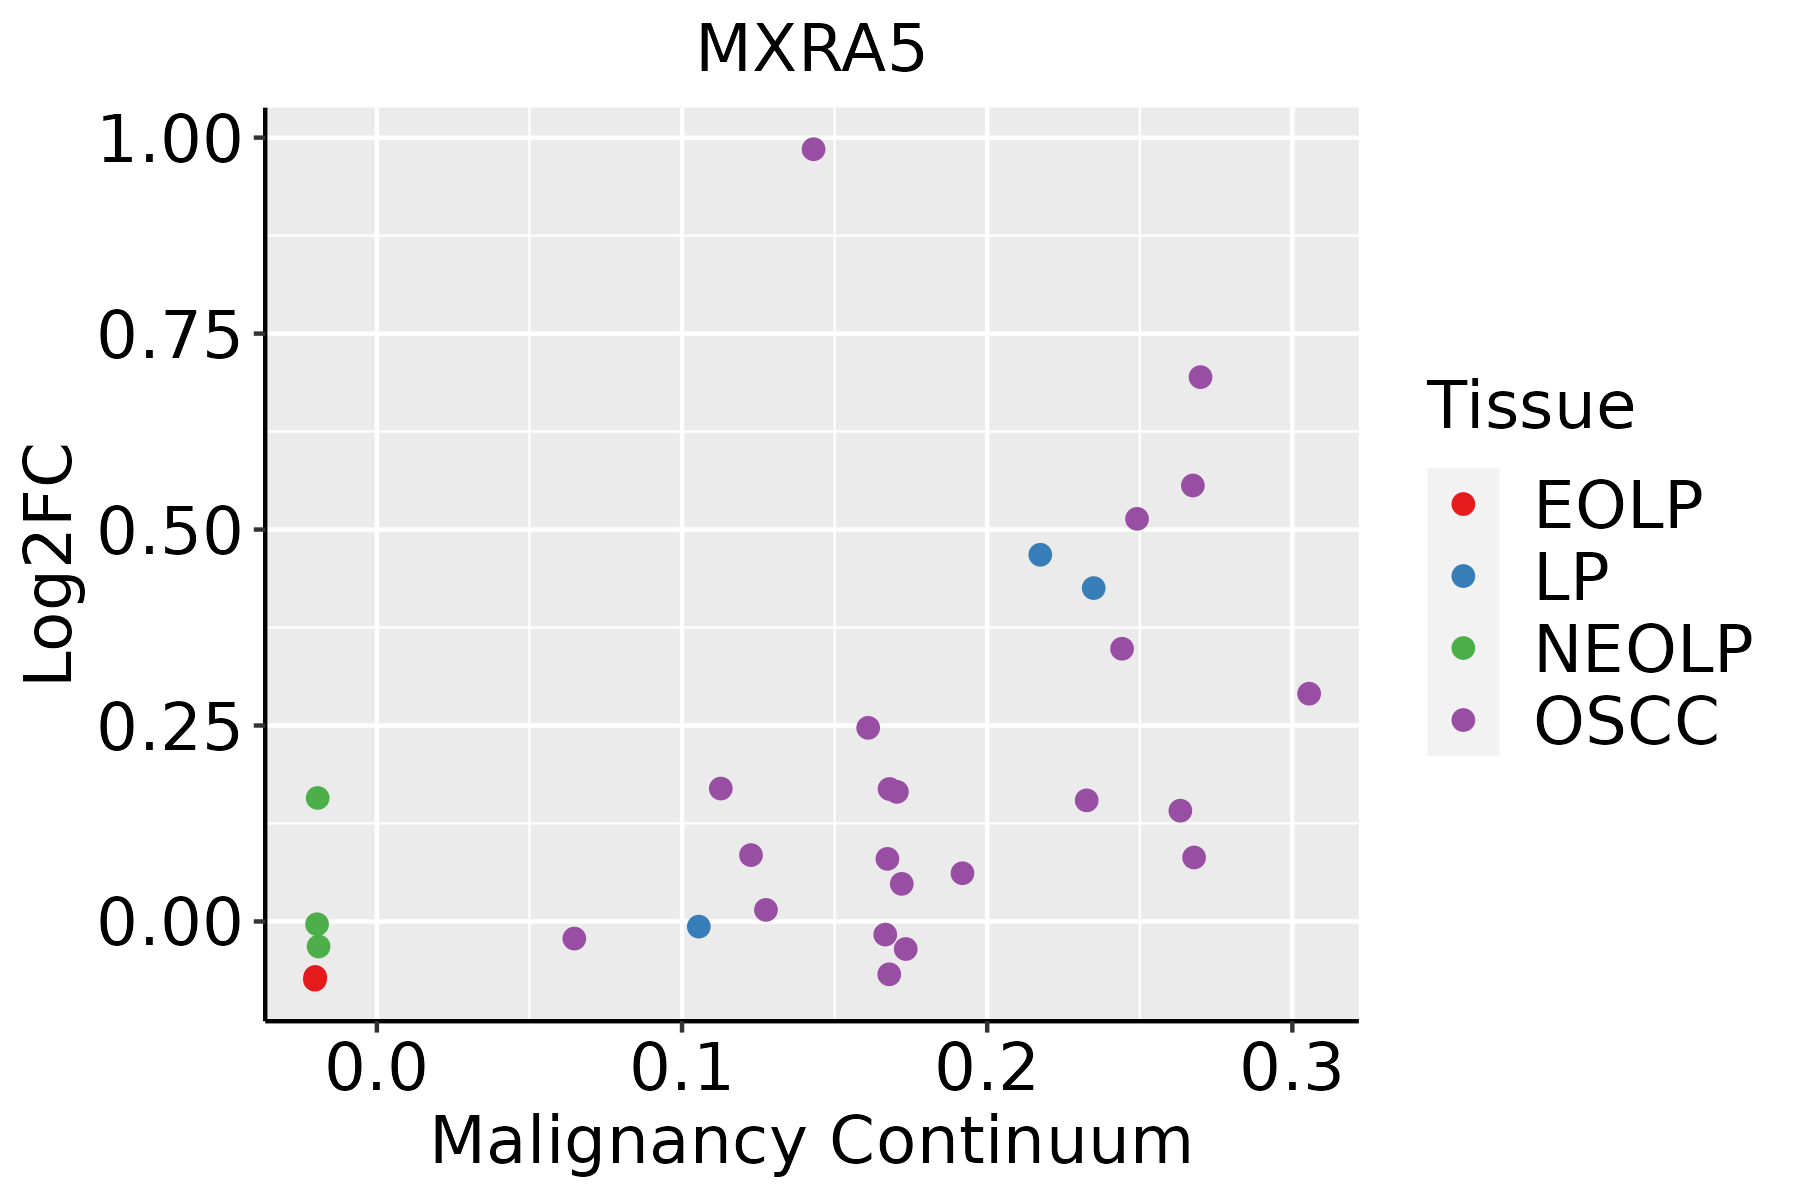 | EOLP: Erosive Oral lichen planus |
| LP: leukoplakia | ||
| NEOLP: Non-erosive oral lichen planus | ||
| OSCC: Oral squamous cell carcinoma | ||
| Prostate |  | BPH: Benign Prostatic Hyperplasia |
| Skin | 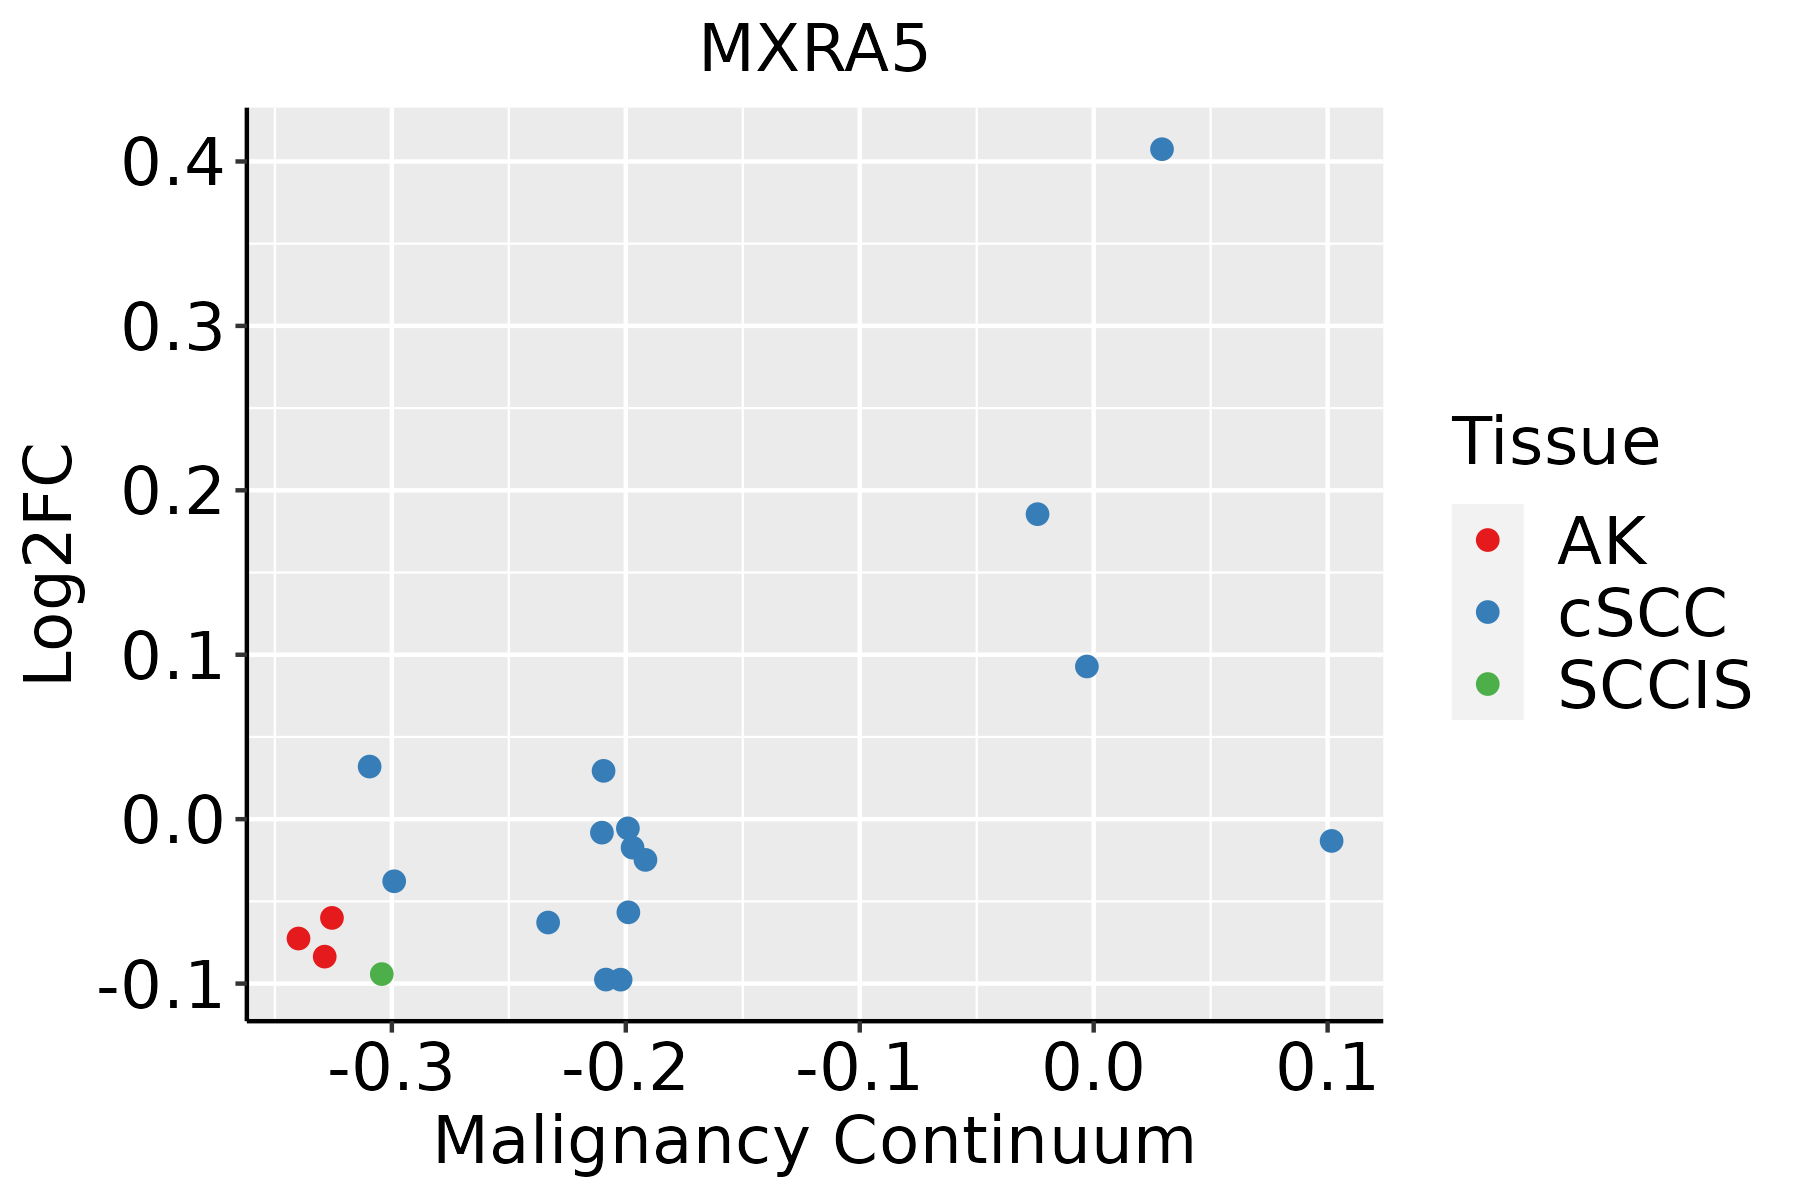 | AK: Actinic keratosis |
| cSCC: Cutaneous squamous cell carcinoma | ||
| SCCIS:squamous cell carcinoma in situ | ||
| Thyroid |  | ATC: Anaplastic thyroid cancer |
| HT: Hashimoto's thyroiditis | ||
| PTC: Papillary thyroid cancer |
| ∗log2FC in expression of this searched gene in stem-like cells from each diseased tissue sample relative to stem-like cells in normal samples in each tissue plotted against the malignancy continuum. Samples are colored based on if they are from different disease stage. |
Top |
Malignant transformation related pathway analysis |
| Find out the enriched GO biological processes and KEGG pathways involved in transition from healthy to precancer to cancer |
| Tissue | Disease Stage | Enriched GO biological Processes |
| Colorectum | AD |  |
| Colorectum | SER |  |
| Colorectum | MSS |  |
| Colorectum | MSI-H |  |
| Colorectum | FAP |  |
| ∗Top 15 enriched GO BP terms are showed in the bar plot of each disease state in each tissue. Each row represents a significant GO biological process which is colored according to the -log10(p.adjust). |
| Page: 1 2 3 4 5 6 7 8 9 |
| GO ID | Tissue | Disease Stage | Description | Gene Ratio | Bg Ratio | pvalue | p.adjust | Count |
| GO:00715599 | Esophagus | ESCC | response to transforming growth factor beta | 157/8552 | 256/18723 | 2.95e-07 | 4.23e-06 | 157 |
| GO:00715598 | Oral cavity | OSCC | response to transforming growth factor beta | 140/7305 | 256/18723 | 2.34e-07 | 3.70e-06 | 140 |
| GO:00715597 | Prostate | BPH | response to transforming growth factor beta | 76/3107 | 256/18723 | 1.14e-07 | 2.73e-06 | 76 |
| GO:007155915 | Prostate | Tumor | response to transforming growth factor beta | 76/3246 | 256/18723 | 6.86e-07 | 1.40e-05 | 76 |
| GO:007155917 | Skin | cSCC | response to transforming growth factor beta | 95/4864 | 256/18723 | 5.21e-05 | 5.31e-04 | 95 |
| GO:007155919 | Thyroid | PTC | response to transforming growth factor beta | 131/5968 | 256/18723 | 9.20e-11 | 3.17e-09 | 131 |
| GO:007155925 | Thyroid | ATC | response to transforming growth factor beta | 142/6293 | 256/18723 | 4.30e-13 | 1.94e-11 | 142 |
| Page: 1 |
| Pathway ID | Tissue | Disease Stage | Description | Gene Ratio | Bg Ratio | pvalue | p.adjust | qvalue | Count |
| Page: 1 |
Top |
Cell-cell communication analysis |
| Identification of potential cell-cell interactions between two cell types and their ligand-receptor pairs for different disease states |
| Ligand | Receptor | LRpair | Pathway | Tissue | Disease Stage |
| Page: 1 |
Top |
Single-cell gene regulatory network inference analysis |
| Find out the significant the regulons (TFs) and the target genes of each regulon across cell types for different disease states |
| TF | Cell Type | Tissue | Disease Stage | Target Gene | RSS | Regulon Activity |
| ∗The dot plots of a searched regulon are shown for all cell subpopulations in each disease state of each tissue based on the regulon specific score inferred using pySCENIC and by calculating the average expression. |
| Page: 1 |
Top |
Somatic mutation of malignant transformation related genes |
| Annotation of somatic variants for genes involved in malignant transformation |
| Hugo Symbol | Variant Class | Variant Classification | dbSNP RS | HGVSc | HGVSp | HGVSp Short | SWISSPROT | BIOTYPE | SIFT | PolyPhen | Tumor Sample Barcode | Tissue | Histology | Sex | Age | Stage | Therapy Types | Drugs | Outcome |
| MXRA5 | SNV | Missense_Mutation | rs137882293 | c.5831N>T | p.Ser1944Leu | p.S1944L | Q9NR99 | protein_coding | tolerated(0.13) | benign(0.081) | TCGA-5L-AAT1-01 | Breast | breast invasive carcinoma | Female | <65 | III/IV | Hormone Therapy | letrozol | SD |
| MXRA5 | SNV | Missense_Mutation | c.1417G>A | p.Gly473Ser | p.G473S | Q9NR99 | protein_coding | tolerated(1) | benign(0) | TCGA-A2-A0YD-01 | Breast | breast invasive carcinoma | Female | <65 | I/II | Chemotherapy | cytoxan | SD | |
| MXRA5 | SNV | Missense_Mutation | c.819N>T | p.Met273Ile | p.M273I | Q9NR99 | protein_coding | tolerated(1) | benign(0) | TCGA-A2-A1G1-01 | Breast | breast invasive carcinoma | Female | >=65 | I/II | Unknown | Unknown | SD | |
| MXRA5 | SNV | Missense_Mutation | c.2884N>A | p.Pro962Thr | p.P962T | Q9NR99 | protein_coding | tolerated(0.57) | benign(0.003) | TCGA-A2-A25A-01 | Breast | breast invasive carcinoma | Female | <65 | I/II | Unspecific | Cytoxan | SD | |
| MXRA5 | SNV | Missense_Mutation | c.4475N>G | p.Ala1492Gly | p.A1492G | Q9NR99 | protein_coding | tolerated(0.06) | benign(0.108) | TCGA-A2-A25B-01 | Breast | breast invasive carcinoma | Female | <65 | I/II | Chemotherapy | taxotere | PD | |
| MXRA5 | SNV | Missense_Mutation | novel | c.4685N>T | p.Ser1562Phe | p.S1562F | Q9NR99 | protein_coding | tolerated(0.08) | benign(0.062) | TCGA-A8-A08P-01 | Breast | breast invasive carcinoma | Female | >=65 | III/IV | Chemotherapy | 5-fluorouracil | CR |
| MXRA5 | SNV | Missense_Mutation | c.1633N>G | p.Met545Val | p.M545V | Q9NR99 | protein_coding | tolerated(1) | benign(0) | TCGA-A8-A09Z-01 | Breast | breast invasive carcinoma | Female | >=65 | I/II | Unknown | Unknown | SD | |
| MXRA5 | SNV | Missense_Mutation | c.5077N>A | p.Asp1693Asn | p.D1693N | Q9NR99 | protein_coding | tolerated(1) | benign(0) | TCGA-AC-A23H-01 | Breast | breast invasive carcinoma | Female | >=65 | I/II | Unknown | Unknown | PD | |
| MXRA5 | SNV | Missense_Mutation | c.3619N>A | p.Asp1207Asn | p.D1207N | Q9NR99 | protein_coding | tolerated(0.18) | benign(0) | TCGA-AC-A23H-01 | Breast | breast invasive carcinoma | Female | >=65 | I/II | Unknown | Unknown | PD | |
| MXRA5 | SNV | Missense_Mutation | novel | c.2665N>A | p.Asp889Asn | p.D889N | Q9NR99 | protein_coding | deleterious(0.03) | possibly_damaging(0.739) | TCGA-AC-A5XS-01 | Breast | breast invasive carcinoma | Female | >=65 | I/II | Hormone Therapy | femara | SD |
| Page: 1 2 3 4 5 6 7 8 9 10 11 12 13 14 15 16 17 18 19 20 21 22 23 24 25 26 27 28 29 30 31 32 33 34 35 36 37 38 39 40 41 42 43 44 45 46 |
Top |
Related drugs of malignant transformation related genes |
| Identification of chemicals and drugs interact with genes involved in malignant transfromation |
| (DGIdb 4.0) |
| Entrez ID | Symbol | Category | Interaction Types | Drug Claim Name | Drug Name | PMIDs |
| Page: 1 |

Copyright 2023-Present -The University of Texas Health Science Center at Houston |