
|
|||||
|
 | |
| |
| |
| |
| |
| |
|
Gene: MXI1 |
Gene summary for MXI1 |
| Gene information | Species | Human | Gene symbol | MXI1 | Gene ID | 4601 |
| Gene name | MAX interactor 1, dimerization protein | |
| Gene Alias | MAD2 | |
| Cytomap | 10q25.2 | |
| Gene Type | protein-coding | GO ID | GO:0000122 | UniProtAcc | A0A0S2Z3X5 |
Top |
Malignant transformation analysis |
| Identification of the aberrant gene expression in precancerous and cancerous lesions by comparing the gene expression of stem-like cells in diseased tissues with normal stem cells |
| Entrez ID | Symbol | Replicates | Species | Organ | Tissue | Adj P-value | Log2FC | Malignancy |
| 4601 | MXI1 | HTA11_347_2000001011 | Human | Colorectum | AD | 5.00e-11 | 5.21e-01 | -0.1954 |
| 4601 | MXI1 | HTA11_99999965104_69814 | Human | Colorectum | MSS | 3.62e-02 | 3.87e-01 | 0.281 |
| 4601 | MXI1 | HTA11_99999974143_84620 | Human | Colorectum | MSS | 8.76e-03 | -1.98e-01 | 0.3005 |
| 4601 | MXI1 | A015-C-203 | Human | Colorectum | FAP | 1.05e-09 | -1.54e-01 | -0.1294 |
| 4601 | MXI1 | A001-C-108 | Human | Colorectum | FAP | 4.09e-10 | -2.17e-01 | -0.0272 |
| 4601 | MXI1 | A002-C-205 | Human | Colorectum | FAP | 4.26e-04 | -2.65e-01 | -0.1236 |
| 4601 | MXI1 | A015-C-006 | Human | Colorectum | FAP | 8.34e-03 | -2.75e-01 | -0.0994 |
| 4601 | MXI1 | A015-C-106 | Human | Colorectum | FAP | 1.50e-02 | -8.25e-02 | -0.0511 |
| 4601 | MXI1 | A002-C-114 | Human | Colorectum | FAP | 2.65e-03 | -2.33e-01 | -0.1561 |
| 4601 | MXI1 | A015-C-104 | Human | Colorectum | FAP | 8.66e-13 | -2.79e-01 | -0.1899 |
| 4601 | MXI1 | A001-C-014 | Human | Colorectum | FAP | 1.07e-03 | -1.28e-01 | 0.0135 |
| 4601 | MXI1 | A002-C-016 | Human | Colorectum | FAP | 2.55e-08 | -2.19e-01 | 0.0521 |
| 4601 | MXI1 | A015-C-002 | Human | Colorectum | FAP | 4.24e-02 | -2.86e-01 | -0.0763 |
| 4601 | MXI1 | A001-C-203 | Human | Colorectum | FAP | 1.47e-02 | -8.41e-02 | -0.0481 |
| 4601 | MXI1 | A002-C-116 | Human | Colorectum | FAP | 1.38e-14 | -2.66e-01 | -0.0452 |
| 4601 | MXI1 | A018-E-020 | Human | Colorectum | FAP | 5.28e-06 | -3.05e-01 | -0.2034 |
| 4601 | MXI1 | F034 | Human | Colorectum | FAP | 6.69e-09 | -2.86e-01 | -0.0665 |
| 4601 | MXI1 | CRC-1-8810 | Human | Colorectum | CRC | 8.80e-06 | -2.24e-01 | 0.6257 |
| 4601 | MXI1 | CRC-3-11773 | Human | Colorectum | CRC | 1.72e-04 | -1.52e-01 | 0.2564 |
| 4601 | MXI1 | LZE4T | Human | Esophagus | ESCC | 2.62e-10 | 5.41e-02 | 0.0811 |
| Page: 1 2 3 4 5 6 |
| Tissue | Expression Dynamics | Abbreviation |
| Colorectum (GSE201348) |  | FAP: Familial adenomatous polyposis |
| CRC: Colorectal cancer | ||
| Colorectum (HTA11) |  | AD: Adenomas |
| SER: Sessile serrated lesions | ||
| MSI-H: Microsatellite-high colorectal cancer | ||
| MSS: Microsatellite stable colorectal cancer | ||
| Esophagus | 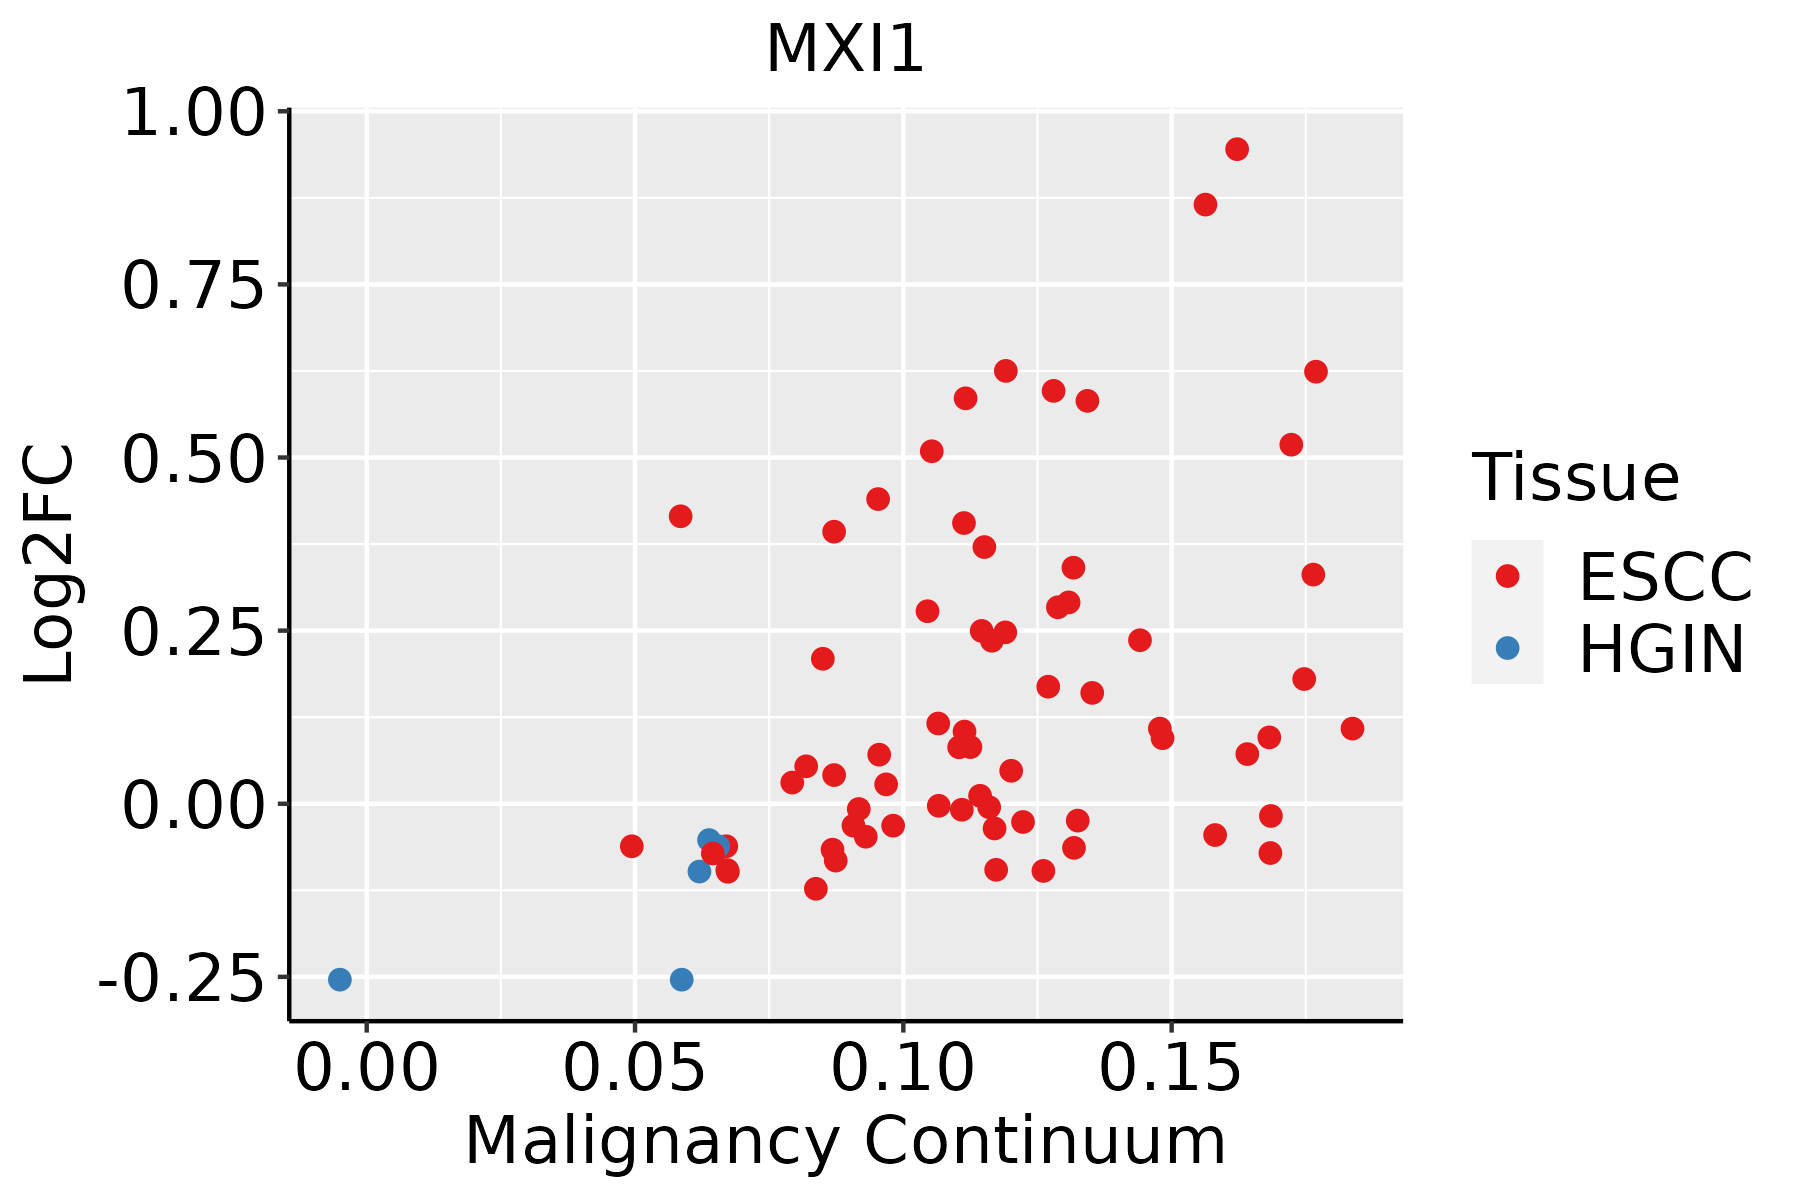 | ESCC: Esophageal squamous cell carcinoma |
| HGIN: High-grade intraepithelial neoplasias | ||
| LGIN: Low-grade intraepithelial neoplasias | ||
| Liver | 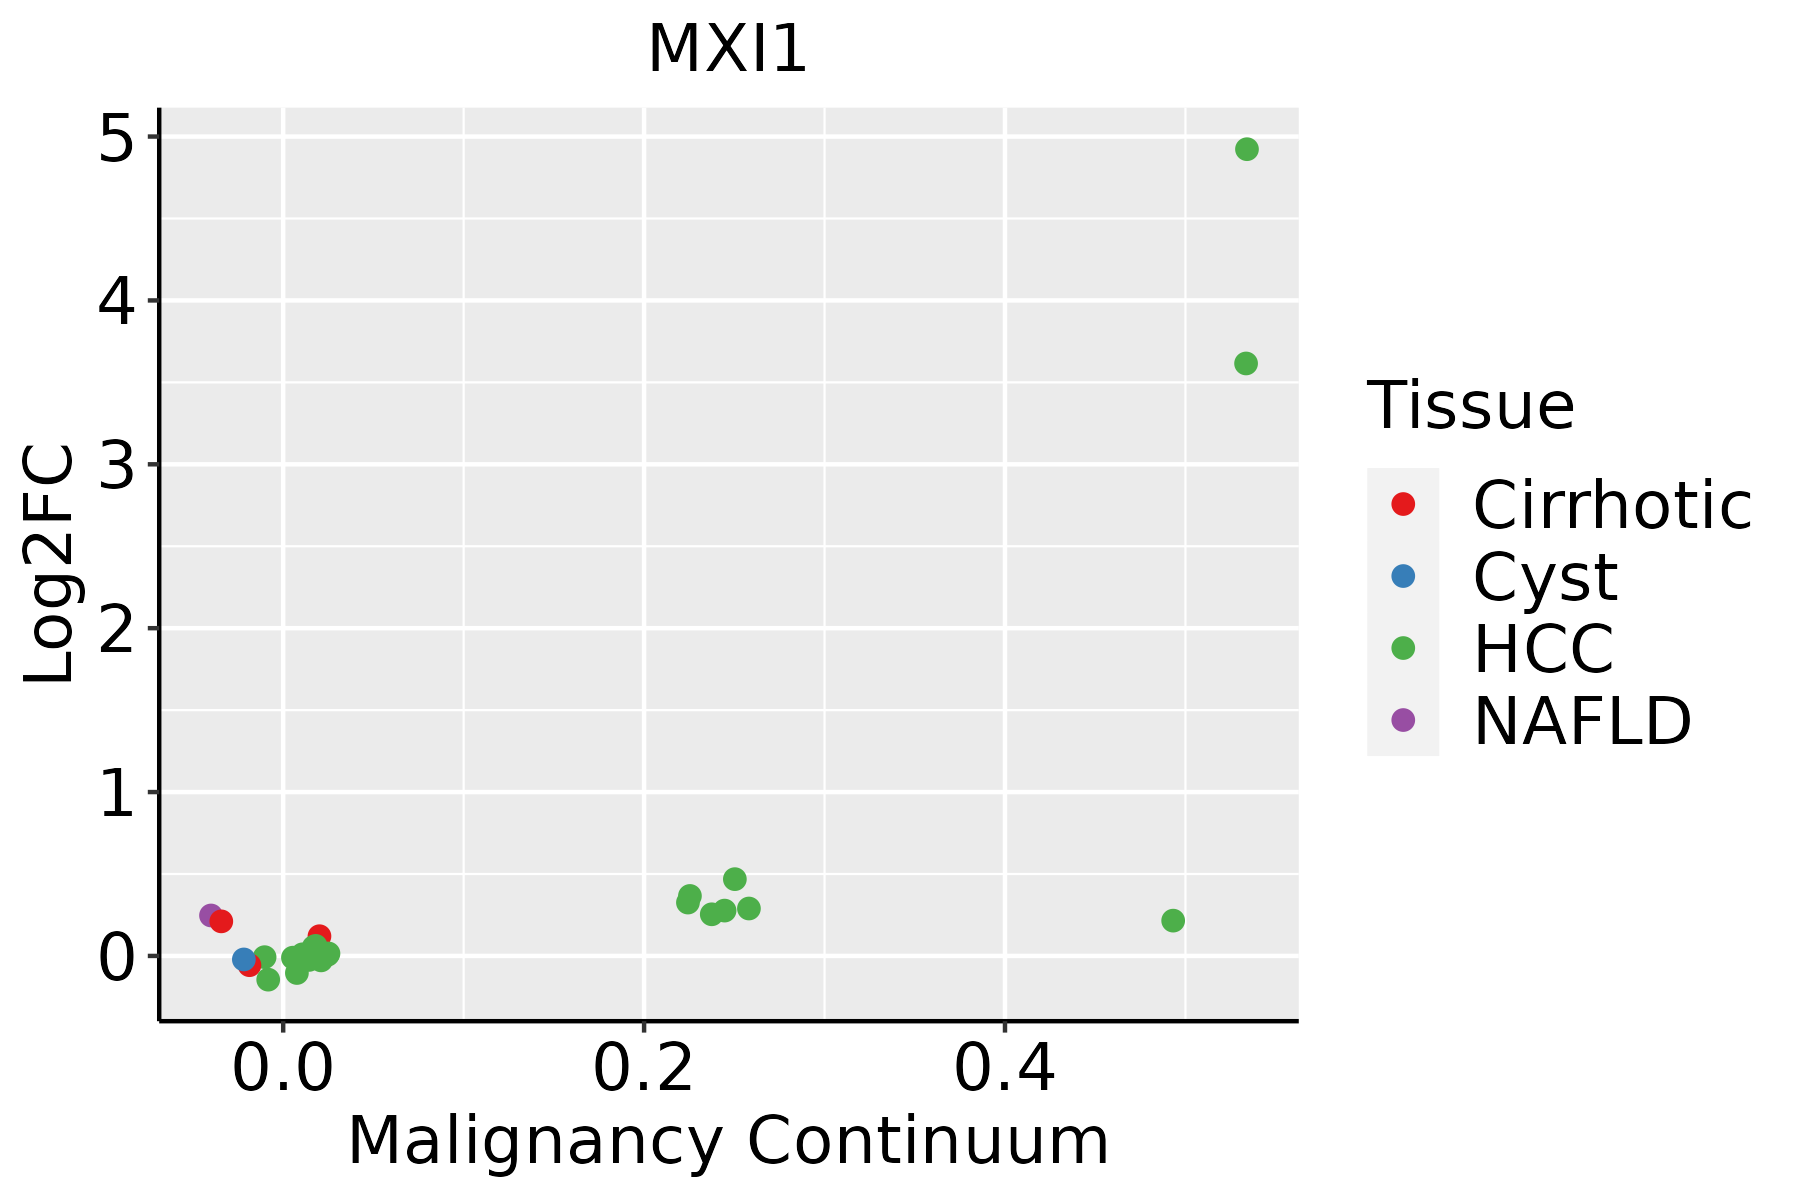 | HCC: Hepatocellular carcinoma |
| NAFLD: Non-alcoholic fatty liver disease | ||
| Thyroid | 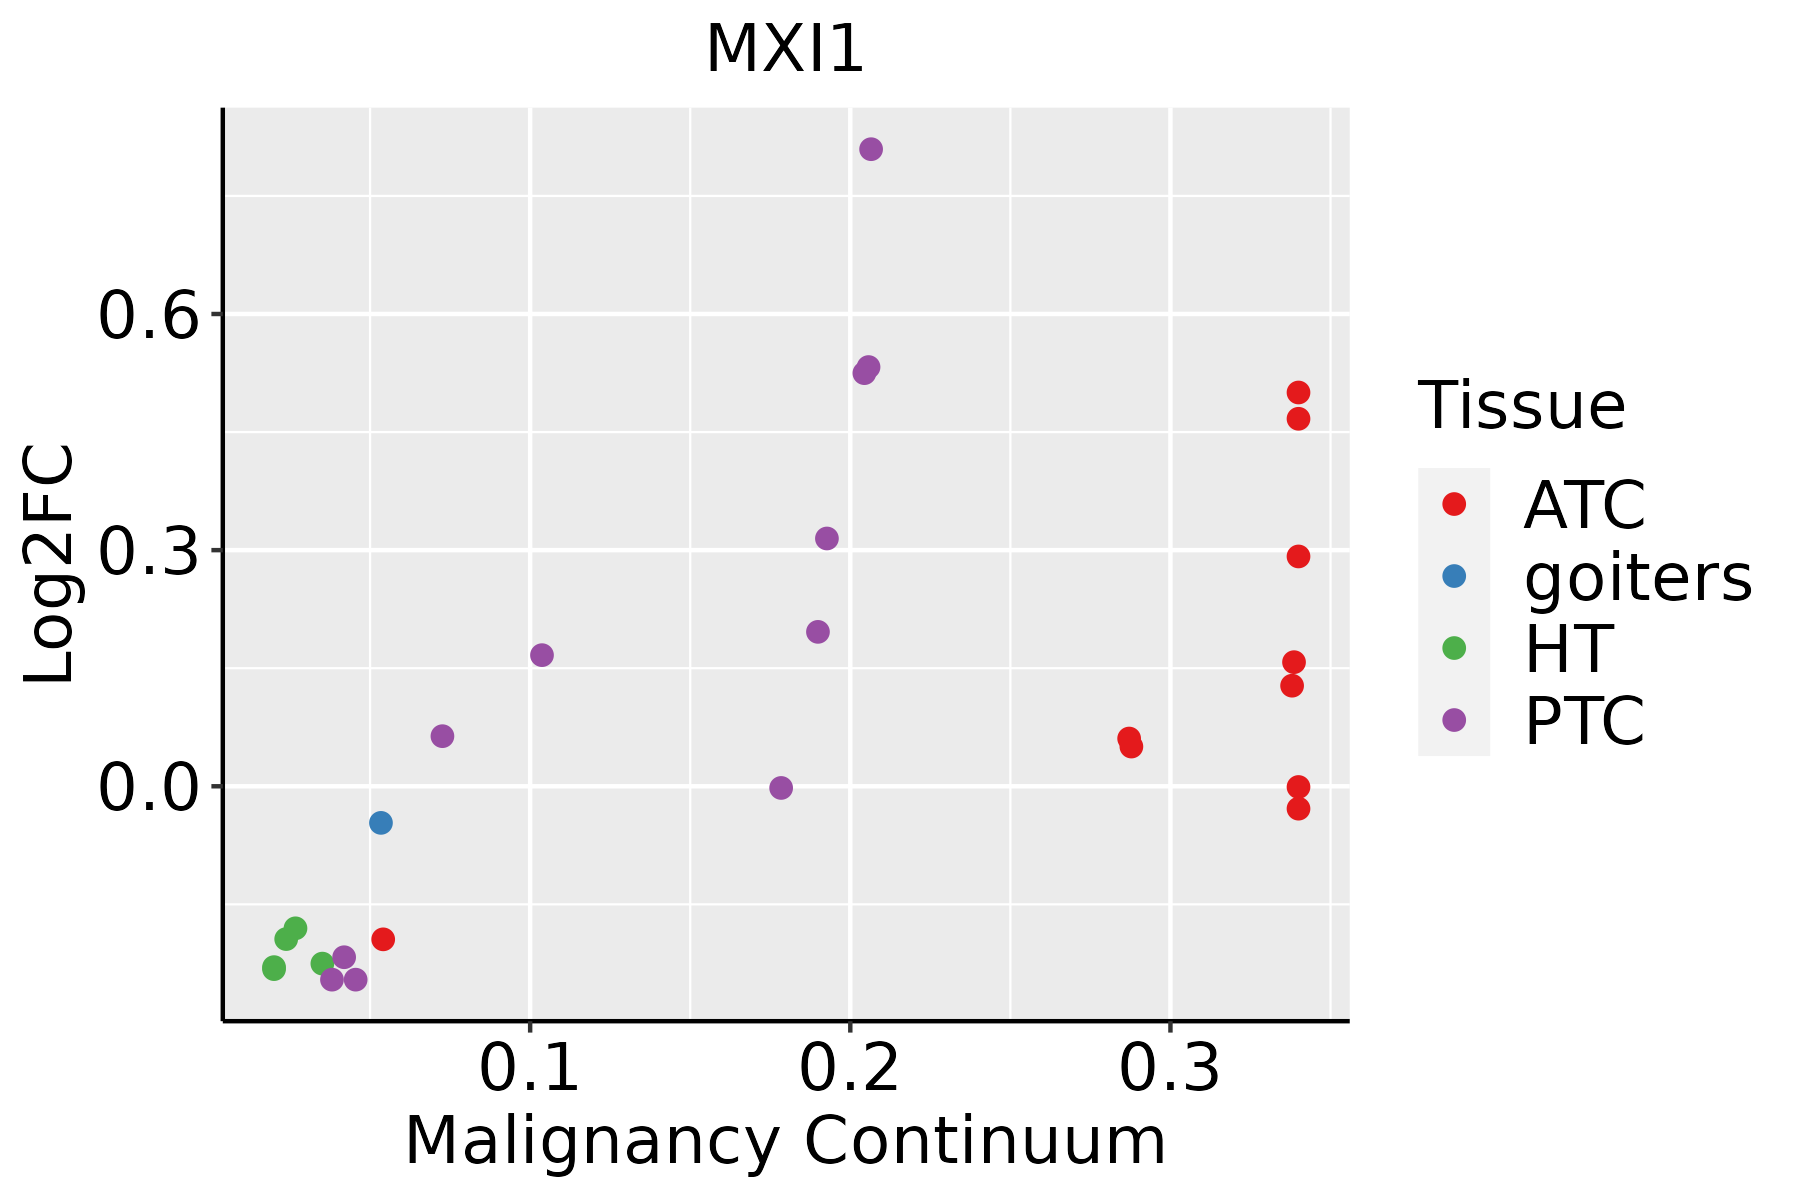 | ATC: Anaplastic thyroid cancer |
| HT: Hashimoto's thyroiditis | ||
| PTC: Papillary thyroid cancer |
| ∗log2FC in expression of this searched gene in stem-like cells from each diseased tissue sample relative to stem-like cells in normal samples in each tissue plotted against the malignancy continuum. Samples are colored based on if they are from different disease stage. |
Top |
Malignant transformation related pathway analysis |
| Find out the enriched GO biological processes and KEGG pathways involved in transition from healthy to precancer to cancer |
| Tissue | Disease Stage | Enriched GO biological Processes |
| Colorectum | AD |  |
| Colorectum | SER |  |
| Colorectum | MSS |  |
| Colorectum | MSI-H |  |
| Colorectum | FAP |  |
| ∗Top 15 enriched GO BP terms are showed in the bar plot of each disease state in each tissue. Each row represents a significant GO biological process which is colored according to the -log10(p.adjust). |
| Page: 1 2 3 4 5 6 7 8 9 |
| GO ID | Tissue | Disease Stage | Description | Gene Ratio | Bg Ratio | pvalue | p.adjust | Count |
| Page: 1 |
| Pathway ID | Tissue | Disease Stage | Description | Gene Ratio | Bg Ratio | pvalue | p.adjust | qvalue | Count |
| Page: 1 |
Top |
Cell-cell communication analysis |
| Identification of potential cell-cell interactions between two cell types and their ligand-receptor pairs for different disease states |
| Ligand | Receptor | LRpair | Pathway | Tissue | Disease Stage |
| Page: 1 |
Top |
Single-cell gene regulatory network inference analysis |
| Find out the significant the regulons (TFs) and the target genes of each regulon across cell types for different disease states |
| TF | Cell Type | Tissue | Disease Stage | Target Gene | RSS | Regulon Activity |
| MXI1 | TFH | Endometrium | ADJ | FBP1,IL1RN,RCAN3, etc. | 7.25e-02 |  |
| MXI1 | CD8TEXINT | Lung | AIS | PCAT1,TMBIM1,LZTFL1, etc. | 3.35e-01 |  |
| ∗The dot plots of a searched regulon are shown for all cell subpopulations in each disease state of each tissue based on the regulon specific score inferred using pySCENIC and by calculating the average expression. |
| Page: 1 |
Top |
Somatic mutation of malignant transformation related genes |
| Annotation of somatic variants for genes involved in malignant transformation |
| Hugo Symbol | Variant Class | Variant Classification | dbSNP RS | HGVSc | HGVSp | HGVSp Short | SWISSPROT | BIOTYPE | SIFT | PolyPhen | Tumor Sample Barcode | Tissue | Histology | Sex | Age | Stage | Therapy Types | Drugs | Outcome |
| MXI1 | deletion | Frame_Shift_Del | novel | c.369delA | p.Lys123AsnfsTer32 | p.K123Nfs*32 | P50539 | protein_coding | TCGA-D8-A27V-01 | Breast | breast invasive carcinoma | Female | <65 | I/II | Hormone Therapy | tamoxiphen | SD | ||
| MXI1 | SNV | Missense_Mutation | rs150249655 | c.197T>C | p.Ile66Thr | p.I66T | P50539 | protein_coding | deleterious(0) | benign(0.133) | TCGA-2W-A8YY-01 | Cervix | cervical & endocervical cancer | Female | <65 | I/II | Chemotherapy | cisplatin | CR |
| MXI1 | SNV | Missense_Mutation | c.182N>T | p.Ser61Leu | p.S61L | P50539 | protein_coding | deleterious_low_confidence(0.01) | benign(0.042) | TCGA-JX-A3Q0-01 | Cervix | cervical & endocervical cancer | Female | <65 | III/IV | Unknown | Unknown | SD | |
| MXI1 | SNV | Missense_Mutation | novel | c.812N>G | p.Asp271Gly | p.D271G | P50539 | protein_coding | deleterious(0.02) | probably_damaging(0.998) | TCGA-A6-2672-01 | Colorectum | colon adenocarcinoma | Female | >=65 | III/IV | Unknown | Unknown | SD |
| MXI1 | SNV | Missense_Mutation | rs367591565 | c.665G>A | p.Arg222Gln | p.R222Q | P50539 | protein_coding | deleterious(0.04) | probably_damaging(0.996) | TCGA-AZ-4315-01 | Colorectum | colon adenocarcinoma | Male | <65 | I/II | Unknown | Unknown | SD |
| MXI1 | SNV | Missense_Mutation | c.292N>A | p.Ala98Thr | p.A98T | P50539 | protein_coding | deleterious(0.01) | probably_damaging(0.998) | TCGA-CK-4951-01 | Colorectum | colon adenocarcinoma | Female | >=65 | I/II | Unknown | Unknown | PD | |
| MXI1 | SNV | Missense_Mutation | novel | c.572N>T | p.Arg191Ile | p.R191I | P50539 | protein_coding | deleterious(0) | probably_damaging(0.997) | TCGA-EI-6917-01 | Colorectum | rectum adenocarcinoma | Male | <65 | III/IV | Chemotherapy | 5fluorouracil+oxaciplatina+l-folinian | SD |
| MXI1 | SNV | Missense_Mutation | rs367591565 | c.665G>A | p.Arg222Gln | p.R222Q | P50539 | protein_coding | deleterious(0.04) | probably_damaging(0.996) | TCGA-F5-6814-01 | Colorectum | rectum adenocarcinoma | Male | <65 | I/II | Unknown | Unknown | SD |
| MXI1 | SNV | Missense_Mutation | novel | c.177N>T | p.Glu59Asp | p.E59D | P50539 | protein_coding | tolerated_low_confidence(0.53) | benign(0.007) | TCGA-AJ-A3EL-01 | Endometrium | uterine corpus endometrioid carcinoma | Female | <65 | I/II | Unknown | Unknown | SD |
| MXI1 | SNV | Missense_Mutation | novel | c.614G>T | p.Arg205Ile | p.R205I | P50539 | protein_coding | deleterious(0) | probably_damaging(0.997) | TCGA-AP-A056-01 | Endometrium | uterine corpus endometrioid carcinoma | Female | <65 | I/II | Unknown | Unknown | SD |
| Page: 1 2 3 |
Top |
Related drugs of malignant transformation related genes |
| Identification of chemicals and drugs interact with genes involved in malignant transfromation |
| (DGIdb 4.0) |
| Entrez ID | Symbol | Category | Interaction Types | Drug Claim Name | Drug Name | PMIDs |
| 4601 | MXI1 | TRANSCRIPTION FACTOR | TGFBETA1 | 11420421 |
| Page: 1 |

Copyright 2023-Present -The University of Texas Health Science Center at Houston |