
|
|||||
|
 | |
| |
| |
| |
| |
| |
|
Gene: MXD4 |
Gene summary for MXD4 |
| Gene information | Species | Human | Gene symbol | MXD4 | Gene ID | 10608 |
| Gene name | MAX dimerization protein 4 | |
| Gene Alias | MAD4 | |
| Cytomap | 4p16.3 | |
| Gene Type | protein-coding | GO ID | GO:0000122 | UniProtAcc | Q14582 |
Top |
Malignant transformation analysis |
| Identification of the aberrant gene expression in precancerous and cancerous lesions by comparing the gene expression of stem-like cells in diseased tissues with normal stem cells |
| Entrez ID | Symbol | Replicates | Species | Organ | Tissue | Adj P-value | Log2FC | Malignancy |
| 10608 | MXD4 | HTA11_2487_2000001011 | Human | Colorectum | SER | 2.72e-04 | 2.65e-01 | -0.1808 |
| 10608 | MXD4 | HTA11_1938_2000001011 | Human | Colorectum | AD | 2.22e-11 | 4.93e-01 | -0.0811 |
| 10608 | MXD4 | HTA11_347_2000001011 | Human | Colorectum | AD | 1.62e-15 | 4.19e-01 | -0.1954 |
| 10608 | MXD4 | HTA11_411_2000001011 | Human | Colorectum | SER | 1.39e-03 | 5.75e-01 | -0.2602 |
| 10608 | MXD4 | HTA11_696_2000001011 | Human | Colorectum | AD | 1.45e-09 | 3.81e-01 | -0.1464 |
| 10608 | MXD4 | HTA11_866_2000001011 | Human | Colorectum | AD | 3.68e-03 | 2.66e-01 | -0.1001 |
| 10608 | MXD4 | HTA11_1391_2000001011 | Human | Colorectum | AD | 3.34e-15 | 4.59e-01 | -0.059 |
| 10608 | MXD4 | HTA11_546_2000001011 | Human | Colorectum | AD | 8.19e-03 | 3.01e-01 | -0.0842 |
| 10608 | MXD4 | HTA11_866_3004761011 | Human | Colorectum | AD | 3.18e-02 | 1.89e-01 | 0.096 |
| 10608 | MXD4 | HTA11_4255_2000001011 | Human | Colorectum | SER | 3.64e-04 | 4.93e-01 | 0.0446 |
| 10608 | MXD4 | HTA11_9408_2000001011 | Human | Colorectum | AD | 4.06e-02 | 4.71e-01 | 0.0451 |
| 10608 | MXD4 | HTA11_8622_2000001021 | Human | Colorectum | SER | 1.26e-02 | 3.95e-01 | 0.0528 |
| 10608 | MXD4 | HTA11_7663_2000001011 | Human | Colorectum | SER | 8.98e-03 | 4.28e-01 | 0.0131 |
| 10608 | MXD4 | HTA11_10623_2000001011 | Human | Colorectum | AD | 1.37e-05 | 3.39e-01 | -0.0177 |
| 10608 | MXD4 | HTA11_10711_2000001011 | Human | Colorectum | AD | 6.26e-07 | 3.30e-01 | 0.0338 |
| 10608 | MXD4 | HTA11_7696_3000711011 | Human | Colorectum | AD | 4.46e-05 | 3.30e-01 | 0.0674 |
| 10608 | MXD4 | HTA11_99999974143_84620 | Human | Colorectum | MSS | 7.18e-03 | 2.33e-01 | 0.3005 |
| 10608 | MXD4 | A002-C-116 | Human | Colorectum | FAP | 1.84e-02 | -7.47e-02 | -0.0452 |
| 10608 | MXD4 | LZE24T | Human | Esophagus | ESCC | 3.84e-03 | 1.01e-01 | 0.0596 |
| 10608 | MXD4 | P2T-E | Human | Esophagus | ESCC | 6.90e-14 | 2.97e-01 | 0.1177 |
| Page: 1 2 3 4 5 6 |
| Tissue | Expression Dynamics | Abbreviation |
| Colorectum (GSE201348) |  | FAP: Familial adenomatous polyposis |
| CRC: Colorectal cancer | ||
| Colorectum (HTA11) |  | AD: Adenomas |
| SER: Sessile serrated lesions | ||
| MSI-H: Microsatellite-high colorectal cancer | ||
| MSS: Microsatellite stable colorectal cancer | ||
| Esophagus |  | ESCC: Esophageal squamous cell carcinoma |
| HGIN: High-grade intraepithelial neoplasias | ||
| LGIN: Low-grade intraepithelial neoplasias | ||
| Liver |  | HCC: Hepatocellular carcinoma |
| NAFLD: Non-alcoholic fatty liver disease | ||
| Oral Cavity |  | EOLP: Erosive Oral lichen planus |
| LP: leukoplakia | ||
| NEOLP: Non-erosive oral lichen planus | ||
| OSCC: Oral squamous cell carcinoma | ||
| Prostate | 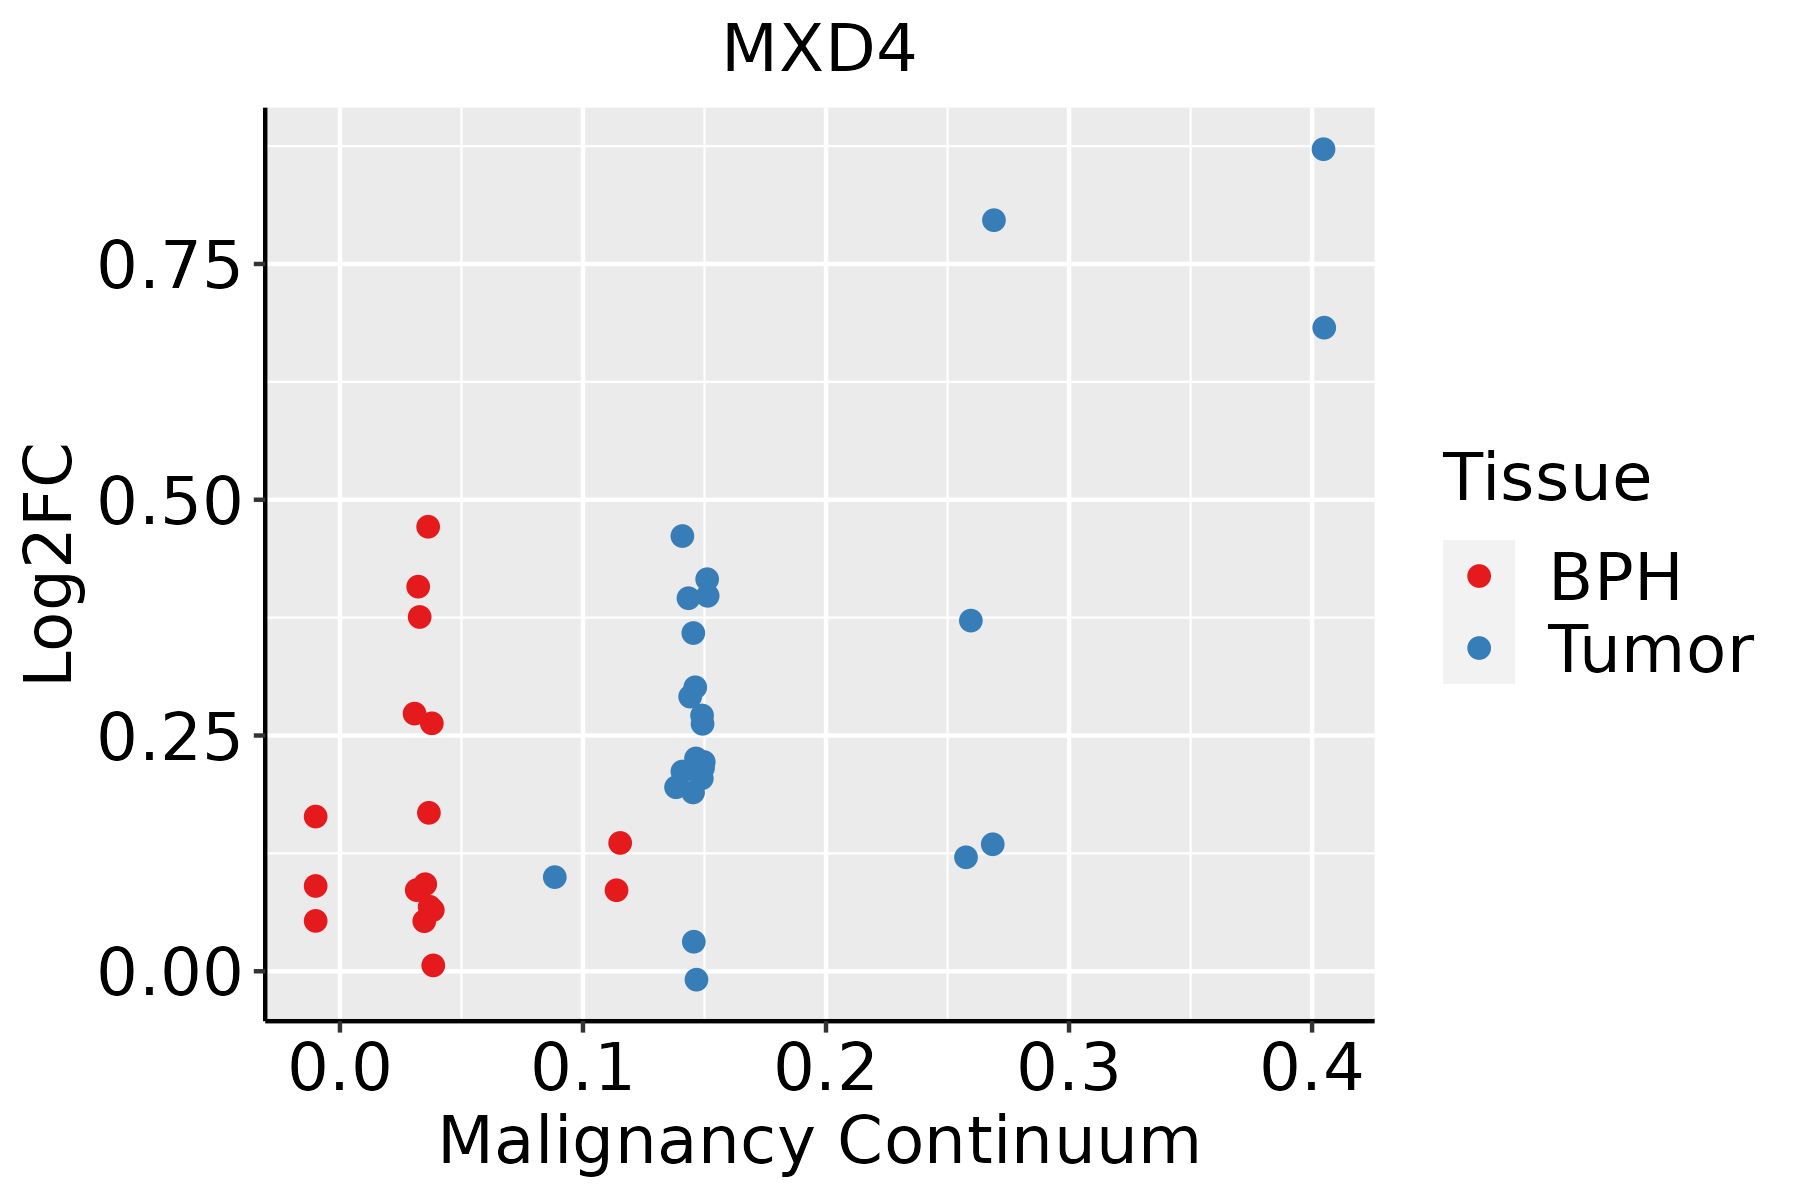 | BPH: Benign Prostatic Hyperplasia |
| Skin | 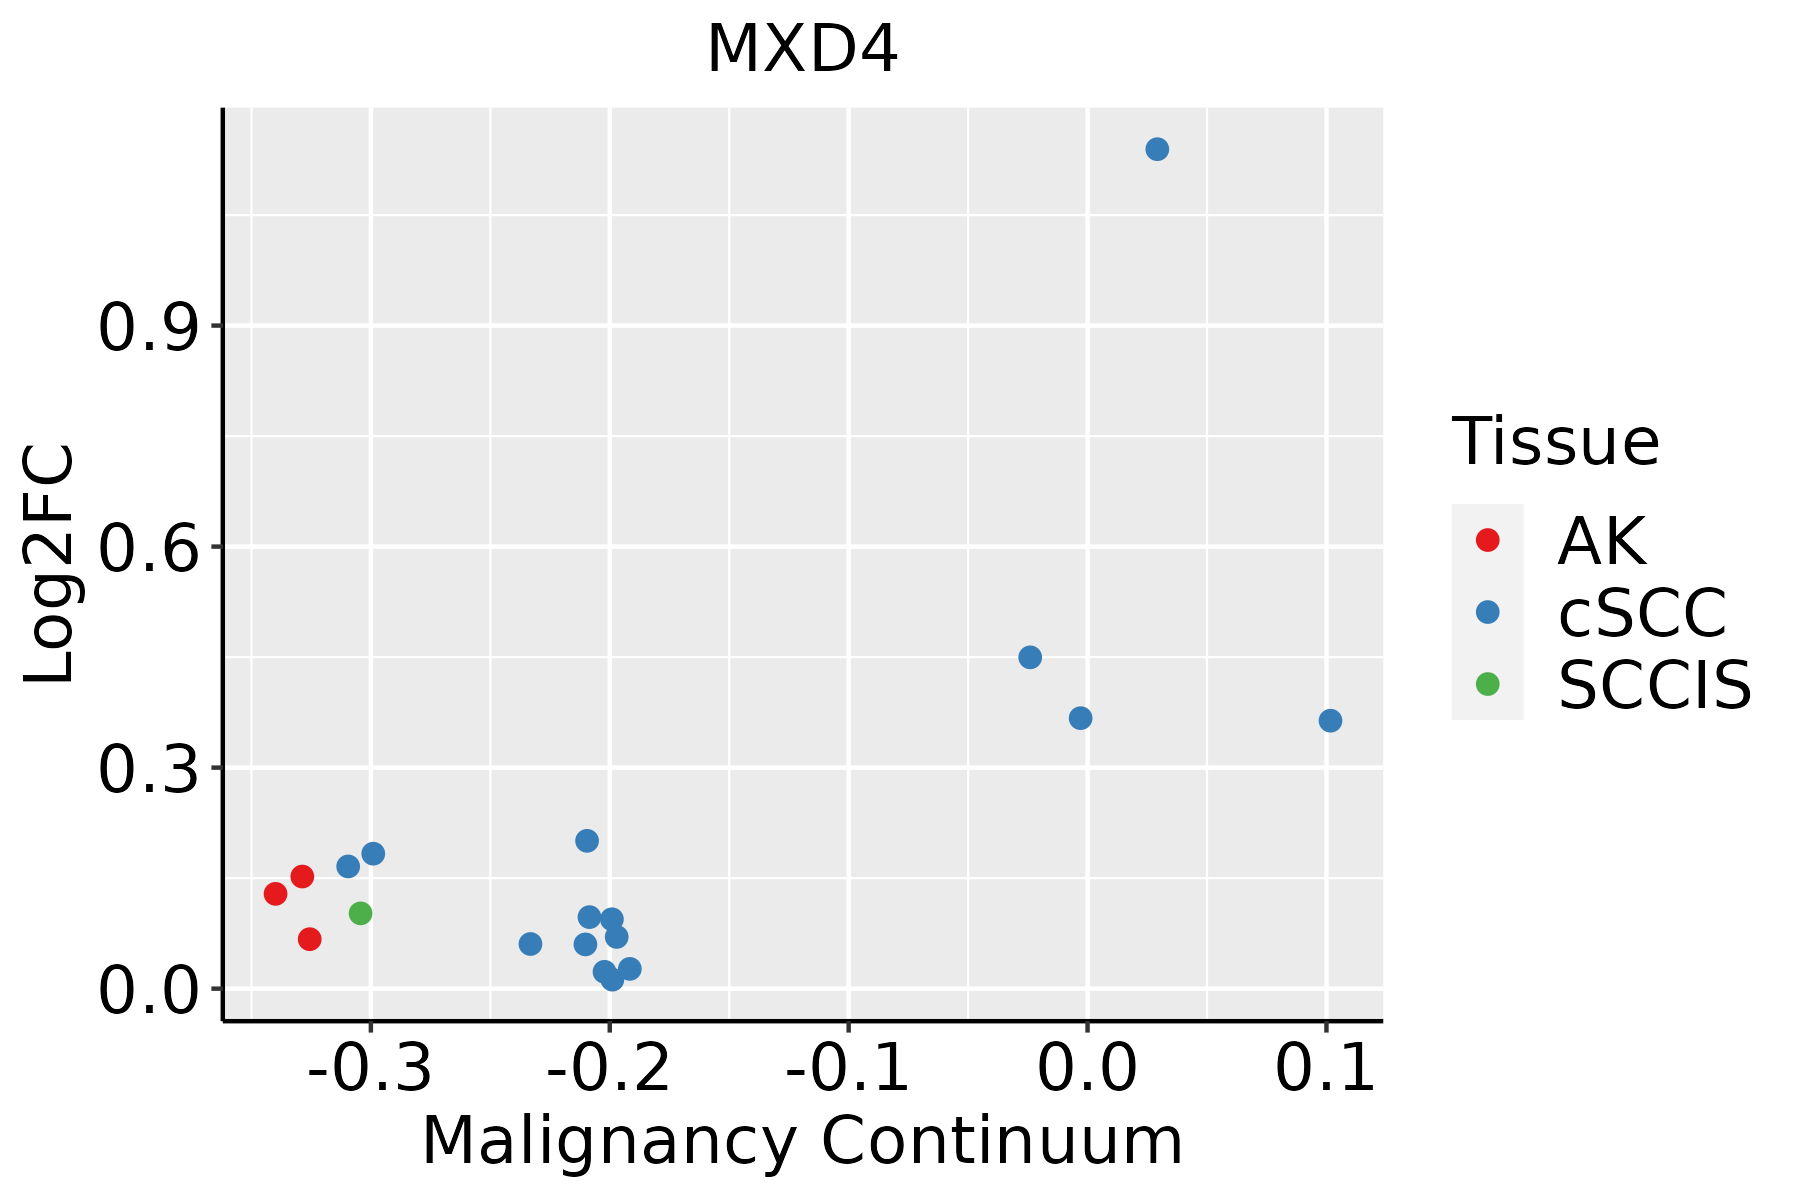 | AK: Actinic keratosis |
| cSCC: Cutaneous squamous cell carcinoma | ||
| SCCIS:squamous cell carcinoma in situ | ||
| Thyroid | 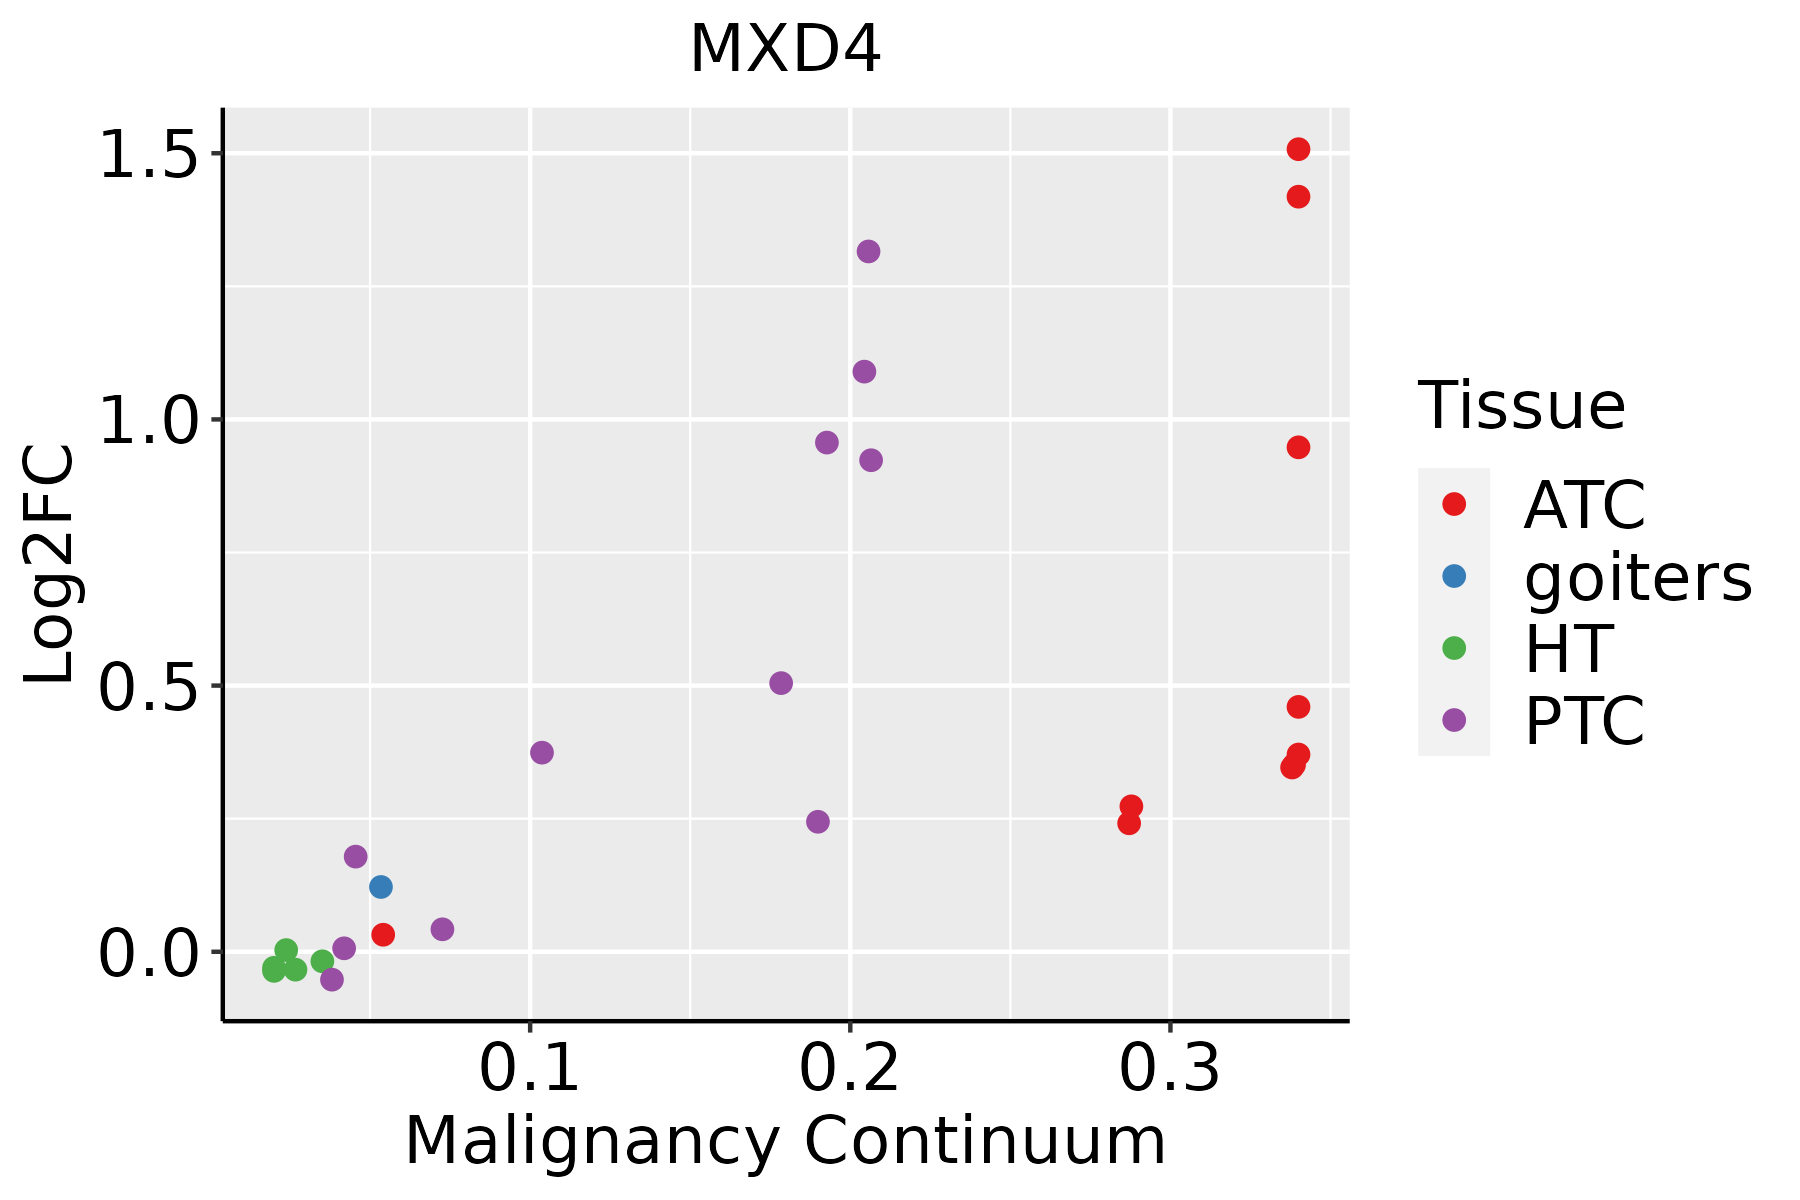 | ATC: Anaplastic thyroid cancer |
| HT: Hashimoto's thyroiditis | ||
| PTC: Papillary thyroid cancer |
| ∗log2FC in expression of this searched gene in stem-like cells from each diseased tissue sample relative to stem-like cells in normal samples in each tissue plotted against the malignancy continuum. Samples are colored based on if they are from different disease stage. |
Top |
Malignant transformation related pathway analysis |
| Find out the enriched GO biological processes and KEGG pathways involved in transition from healthy to precancer to cancer |
| Tissue | Disease Stage | Enriched GO biological Processes |
| Colorectum | AD |  |
| Colorectum | SER |  |
| Colorectum | MSS |  |
| Colorectum | MSI-H |  |
| Colorectum | FAP |  |
| ∗Top 15 enriched GO BP terms are showed in the bar plot of each disease state in each tissue. Each row represents a significant GO biological process which is colored according to the -log10(p.adjust). |
| Page: 1 2 3 4 5 6 7 8 9 |
| GO ID | Tissue | Disease Stage | Description | Gene Ratio | Bg Ratio | pvalue | p.adjust | Count |
| Page: 1 |
| Pathway ID | Tissue | Disease Stage | Description | Gene Ratio | Bg Ratio | pvalue | p.adjust | qvalue | Count |
| Page: 1 |
Top |
Cell-cell communication analysis |
| Identification of potential cell-cell interactions between two cell types and their ligand-receptor pairs for different disease states |
| Ligand | Receptor | LRpair | Pathway | Tissue | Disease Stage |
| Page: 1 |
Top |
Single-cell gene regulatory network inference analysis |
| Find out the significant the regulons (TFs) and the target genes of each regulon across cell types for different disease states |
| TF | Cell Type | Tissue | Disease Stage | Target Gene | RSS | Regulon Activity |
| MXD4 | ECM | Breast | Healthy | CD81,EPHX1,ITM2B, etc. | 3.77e-01 |  |
| MXD4 | CD8TEFF | Cervix | ADJ | APOBEC3G,ITM2C,CD27, etc. | 2.05e-02 |  |
| MXD4 | TFH | Cervix | ADJ | APOBEC3G,ITM2C,CD27, etc. | 3.12e-02 | |
| MXD4 | NK | Cervix | ADJ | APOBEC3G,ITM2C,CD27, etc. | 1.01e-02 | |
| MXD4 | CD8TEXP | Cervix | CC | APOBEC3G,ITM2C,CD27, etc. | 2.61e-02 |  |
| MXD4 | CD8TEXP | Cervix | N_HPV | APOBEC3G,ITM2C,CD27, etc. | 3.01e-02 |  |
| MXD4 | CD8TEXINT | Cervix | N_HPV | APOBEC3G,ITM2C,CD27, etc. | 2.70e-02 | |
| MXD4 | GOB | Colorectum | CRC | MAGI2,CA8,LINC01060, etc. | 3.10e-02 |  |
| MXD4 | IMGOB | Colorectum | FAP | MAGI2,CA8,LINC01060, etc. | 2.65e-01 |  |
| MXD4 | GOB | Colorectum | FAP | MAGI2,CA8,LINC01060, etc. | 1.80e-01 | |
| ∗The dot plots of a searched regulon are shown for all cell subpopulations in each disease state of each tissue based on the regulon specific score inferred using pySCENIC and by calculating the average expression. |
| Page: 1 2 |
Top |
Somatic mutation of malignant transformation related genes |
| Annotation of somatic variants for genes involved in malignant transformation |
| Hugo Symbol | Variant Class | Variant Classification | dbSNP RS | HGVSc | HGVSp | HGVSp Short | SWISSPROT | BIOTYPE | SIFT | PolyPhen | Tumor Sample Barcode | Tissue | Histology | Sex | Age | Stage | Therapy Types | Drugs | Outcome |
| MXD4 | SNV | Missense_Mutation | c.170C>T | p.Ser57Leu | p.S57L | Q14582 | protein_coding | deleterious(0) | benign(0.251) | TCGA-GM-A2D9-01 | Breast | breast invasive carcinoma | Female | >=65 | I/II | Hormone Therapy | arimidex | SD | |
| MXD4 | SNV | Missense_Mutation | rs776946148 | c.289N>T | p.Arg97Trp | p.R97W | Q14582 | protein_coding | deleterious(0.04) | probably_damaging(0.994) | TCGA-AA-A010-01 | Colorectum | colon adenocarcinoma | Female | <65 | I/II | Chemotherapy | folinic | CR |
| MXD4 | SNV | Missense_Mutation | c.205C>T | p.Leu69Phe | p.L69F | Q14582 | protein_coding | deleterious(0) | probably_damaging(0.978) | TCGA-AZ-6599-01 | Colorectum | colon adenocarcinoma | Male | >=65 | I/II | Unknown | Unknown | SD | |
| MXD4 | SNV | Missense_Mutation | rs201554312 | c.386G>A | p.Arg129His | p.R129H | Q14582 | protein_coding | deleterious(0) | probably_damaging(0.964) | TCGA-F5-6814-01 | Colorectum | rectum adenocarcinoma | Male | <65 | I/II | Unknown | Unknown | SD |
| MXD4 | SNV | Missense_Mutation | novel | c.167C>A | p.Ser56Tyr | p.S56Y | Q14582 | protein_coding | deleterious(0) | probably_damaging(0.963) | TCGA-F5-6814-01 | Colorectum | rectum adenocarcinoma | Male | <65 | I/II | Unknown | Unknown | SD |
| MXD4 | SNV | Missense_Mutation | novel | c.430G>A | p.Asp144Asn | p.D144N | Q14582 | protein_coding | deleterious(0.04) | probably_damaging(0.987) | TCGA-AJ-A8CW-01 | Endometrium | uterine corpus endometrioid carcinoma | Female | <65 | I/II | Unknown | Unknown | SD |
| MXD4 | SNV | Missense_Mutation | c.544G>A | p.Asp182Asn | p.D182N | Q14582 | protein_coding | deleterious(0.01) | possibly_damaging(0.787) | TCGA-AX-A06F-01 | Endometrium | uterine corpus endometrioid carcinoma | Female | <65 | III/IV | Chemotherapy | carboplatin | SD | |
| MXD4 | SNV | Missense_Mutation | rs772082970 | c.329N>A | p.Arg110His | p.R110H | Q14582 | protein_coding | deleterious(0) | benign(0.042) | TCGA-BG-A0VZ-01 | Endometrium | uterine corpus endometrioid carcinoma | Female | <65 | III/IV | Chemotherapy | cisplatin | CR |
| MXD4 | SNV | Missense_Mutation | rs757540498 | c.332G>A | p.Arg111Gln | p.R111Q | Q14582 | protein_coding | deleterious(0.04) | benign(0.037) | TCGA-EO-A22U-01 | Endometrium | uterine corpus endometrioid carcinoma | Female | >=65 | I/II | Unknown | Unknown | SD |
| MXD4 | SNV | Missense_Mutation | novel | c.263N>A | p.Arg88His | p.R88H | Q14582 | protein_coding | deleterious(0) | probably_damaging(0.984) | TCGA-EO-A3B0-01 | Endometrium | uterine corpus endometrioid carcinoma | Female | <65 | III/IV | Unknown | Unknown | SD |
| Page: 1 2 |
Top |
Related drugs of malignant transformation related genes |
| Identification of chemicals and drugs interact with genes involved in malignant transfromation |
| (DGIdb 4.0) |
| Entrez ID | Symbol | Category | Interaction Types | Drug Claim Name | Drug Name | PMIDs |
| Page: 1 |

Copyright 2023-Present -The University of Texas Health Science Center at Houston |