
|
|||||
|
 | |
| |
| |
| |
| |
| |
|
Gene: MXD1 |
Gene summary for MXD1 |
| Gene information | Species | Human | Gene symbol | MXD1 | Gene ID | 4084 |
| Gene name | MAX dimerization protein 1 | |
| Gene Alias | BHLHC58 | |
| Cytomap | 2p13.3 | |
| Gene Type | protein-coding | GO ID | GO:0000122 | UniProtAcc | B7ZLI7 |
Top |
Malignant transformation analysis |
| Identification of the aberrant gene expression in precancerous and cancerous lesions by comparing the gene expression of stem-like cells in diseased tissues with normal stem cells |
| Entrez ID | Symbol | Replicates | Species | Organ | Tissue | Adj P-value | Log2FC | Malignancy |
| 4084 | MXD1 | GSM4909282 | Human | Breast | IDC | 3.65e-02 | -1.20e-01 | -0.0288 |
| 4084 | MXD1 | GSM4909294 | Human | Breast | IDC | 9.88e-04 | -2.19e-01 | 0.2022 |
| 4084 | MXD1 | GSM4909297 | Human | Breast | IDC | 2.06e-03 | -1.05e-01 | 0.1517 |
| 4084 | MXD1 | GSM4909306 | Human | Breast | IDC | 2.56e-04 | -2.18e-01 | 0.1564 |
| 4084 | MXD1 | GSM4909311 | Human | Breast | IDC | 1.60e-11 | -2.53e-01 | 0.1534 |
| 4084 | MXD1 | GSM4909312 | Human | Breast | IDC | 2.20e-05 | -2.13e-01 | 0.1552 |
| 4084 | MXD1 | GSM4909319 | Human | Breast | IDC | 8.27e-09 | -2.38e-01 | 0.1563 |
| 4084 | MXD1 | GSM4909321 | Human | Breast | IDC | 7.75e-04 | -1.47e-01 | 0.1559 |
| 4084 | MXD1 | ctrl6 | Human | Breast | Precancer | 1.02e-23 | 9.29e-01 | -0.0061 |
| 4084 | MXD1 | brca10 | Human | Breast | Precancer | 1.10e-19 | 6.16e-01 | -0.0029 |
| 4084 | MXD1 | P1 | Human | Breast | IDC | 9.09e-03 | -1.03e-01 | 0.1527 |
| 4084 | MXD1 | DCIS2 | Human | Breast | DCIS | 1.31e-31 | -9.87e-03 | 0.0085 |
| 4084 | MXD1 | CA_HPV_1 | Human | Cervix | CC | 8.68e-03 | 1.56e-01 | 0.0264 |
| 4084 | MXD1 | CA_HPV_2 | Human | Cervix | CC | 1.12e-08 | 4.07e-01 | 0.0391 |
| 4084 | MXD1 | N_HPV_2 | Human | Cervix | N_HPV | 4.49e-06 | 3.24e-01 | -0.0131 |
| 4084 | MXD1 | CCI_1 | Human | Cervix | CC | 3.19e-06 | 1.19e+00 | 0.528 |
| 4084 | MXD1 | sample3 | Human | Cervix | CC | 6.98e-18 | 6.30e-01 | 0.1387 |
| 4084 | MXD1 | H2 | Human | Cervix | HSIL_HPV | 2.73e-17 | 5.67e-01 | 0.0632 |
| 4084 | MXD1 | T1 | Human | Cervix | CC | 1.25e-07 | 4.90e-01 | 0.0918 |
| 4084 | MXD1 | T3 | Human | Cervix | CC | 9.07e-22 | 6.53e-01 | 0.1389 |
| Page: 1 2 3 4 5 6 7 |
| Tissue | Expression Dynamics | Abbreviation |
| Breast | 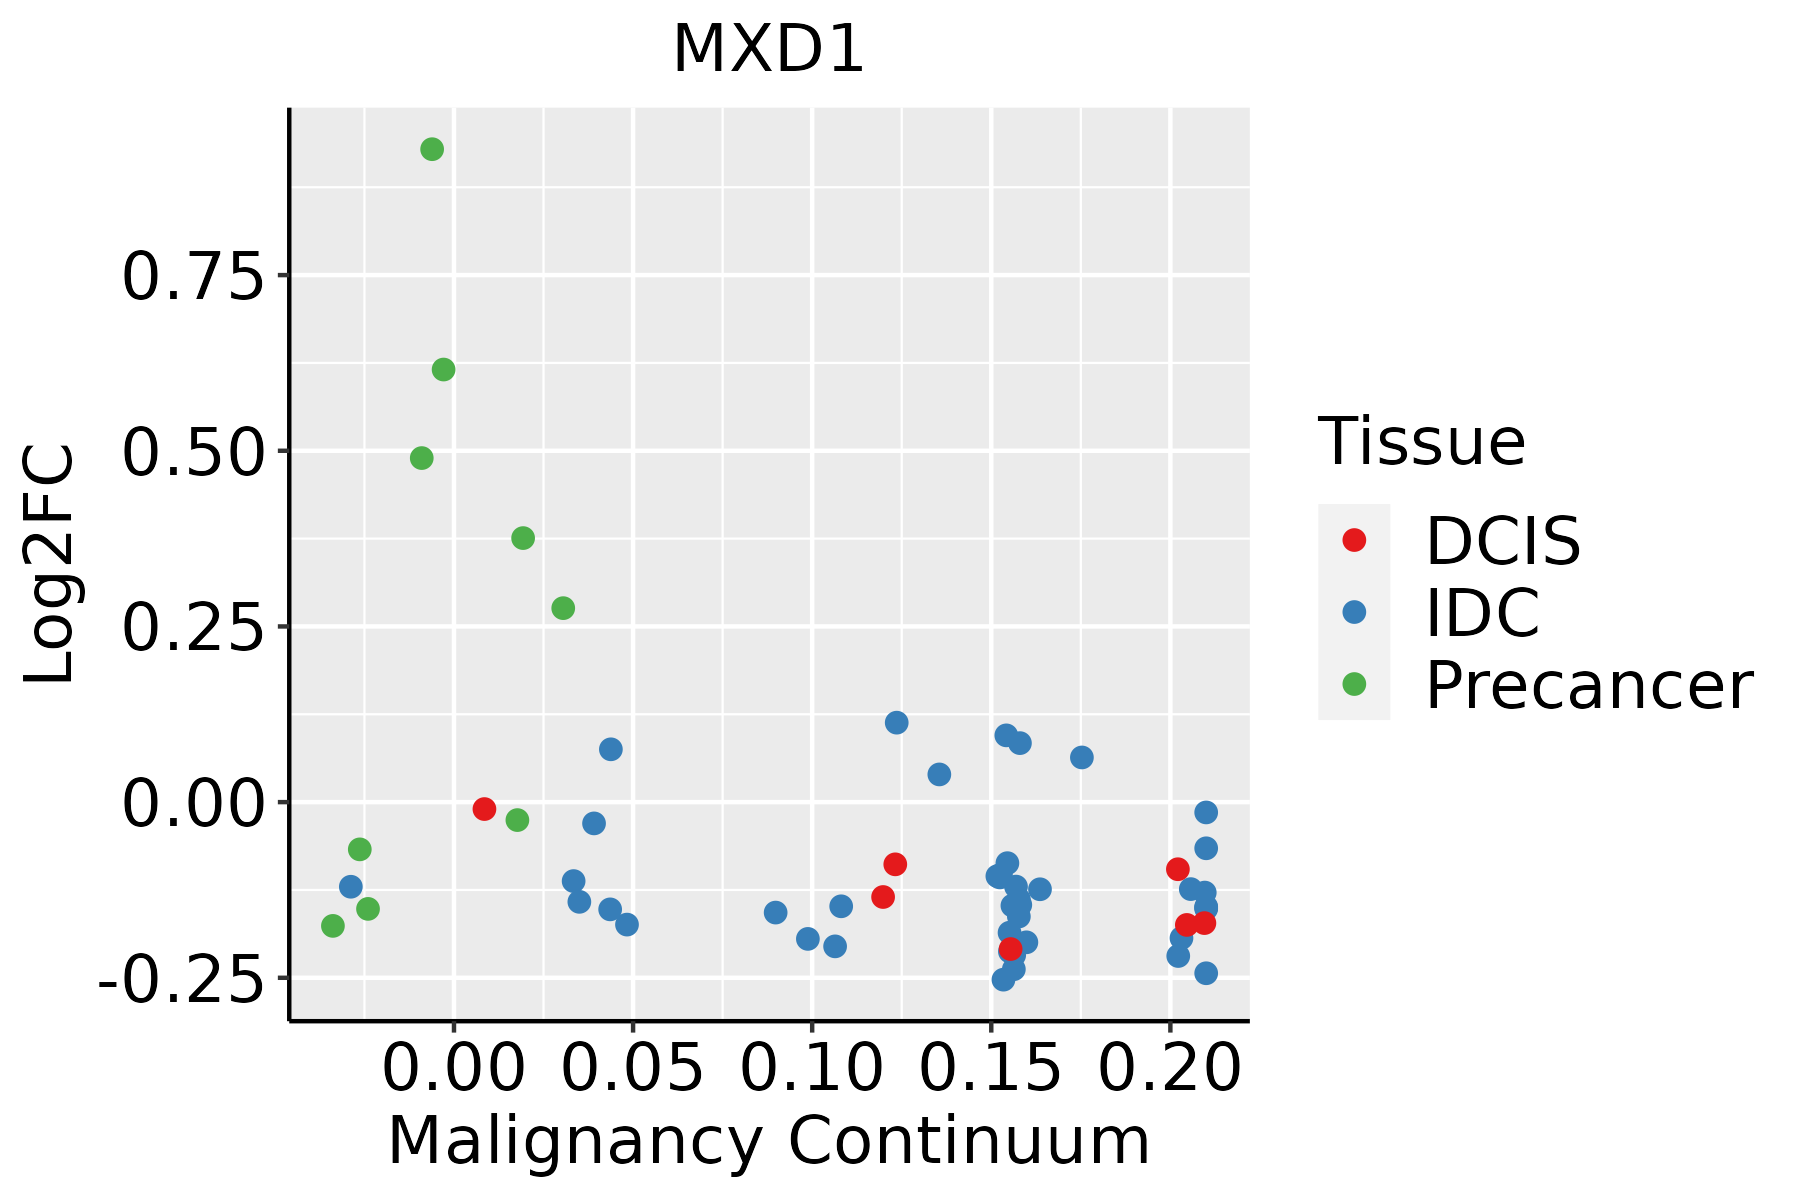 | IDC: Invasive ductal carcinoma |
| DCIS: Ductal carcinoma in situ | ||
| Precancer(BRCA1-mut): Precancerous lesion from BRCA1 mutation carriers | ||
| Cervix | 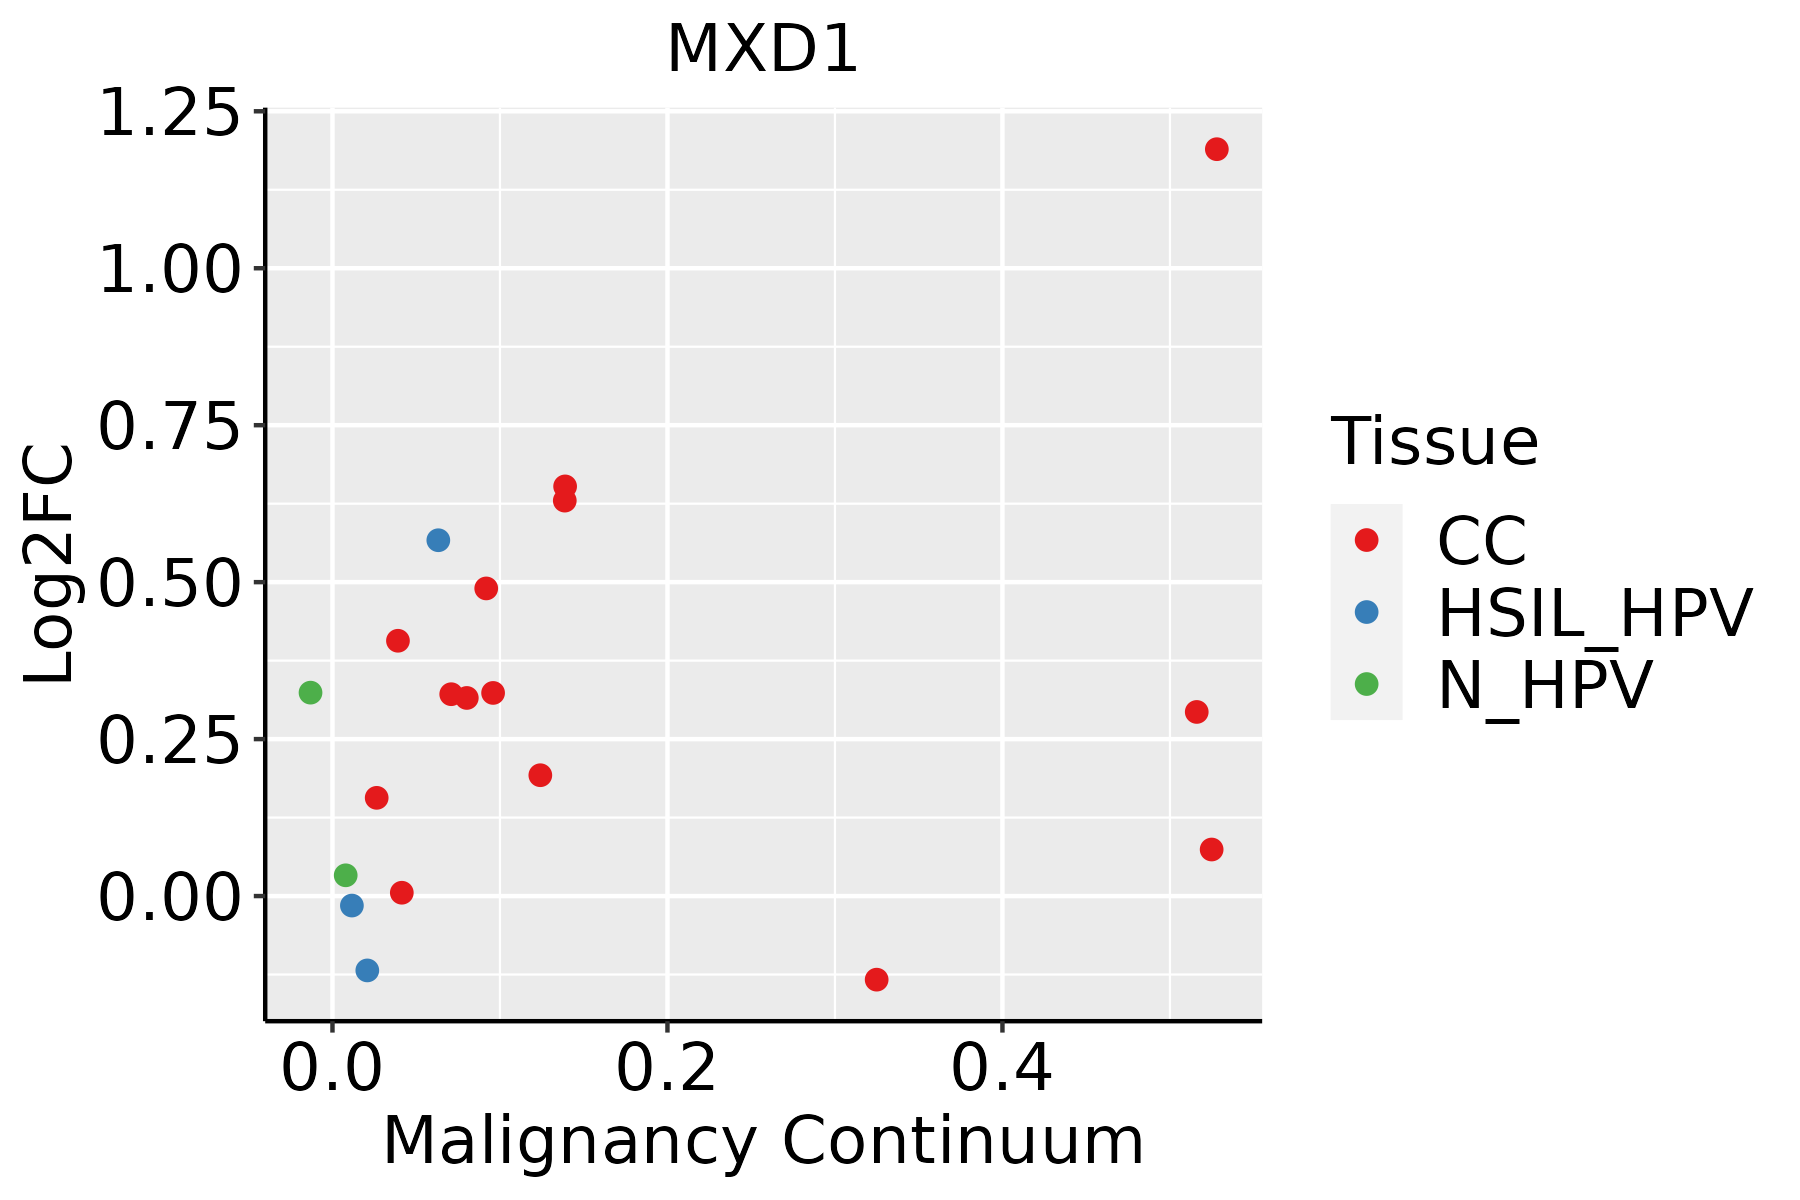 | CC: Cervix cancer |
| HSIL_HPV: HPV-infected high-grade squamous intraepithelial lesions | ||
| N_HPV: HPV-infected normal cervix | ||
| Colorectum (GSE201348) |  | FAP: Familial adenomatous polyposis |
| CRC: Colorectal cancer | ||
| Colorectum (HTA11) |  | AD: Adenomas |
| SER: Sessile serrated lesions | ||
| MSI-H: Microsatellite-high colorectal cancer | ||
| MSS: Microsatellite stable colorectal cancer | ||
| Esophagus | 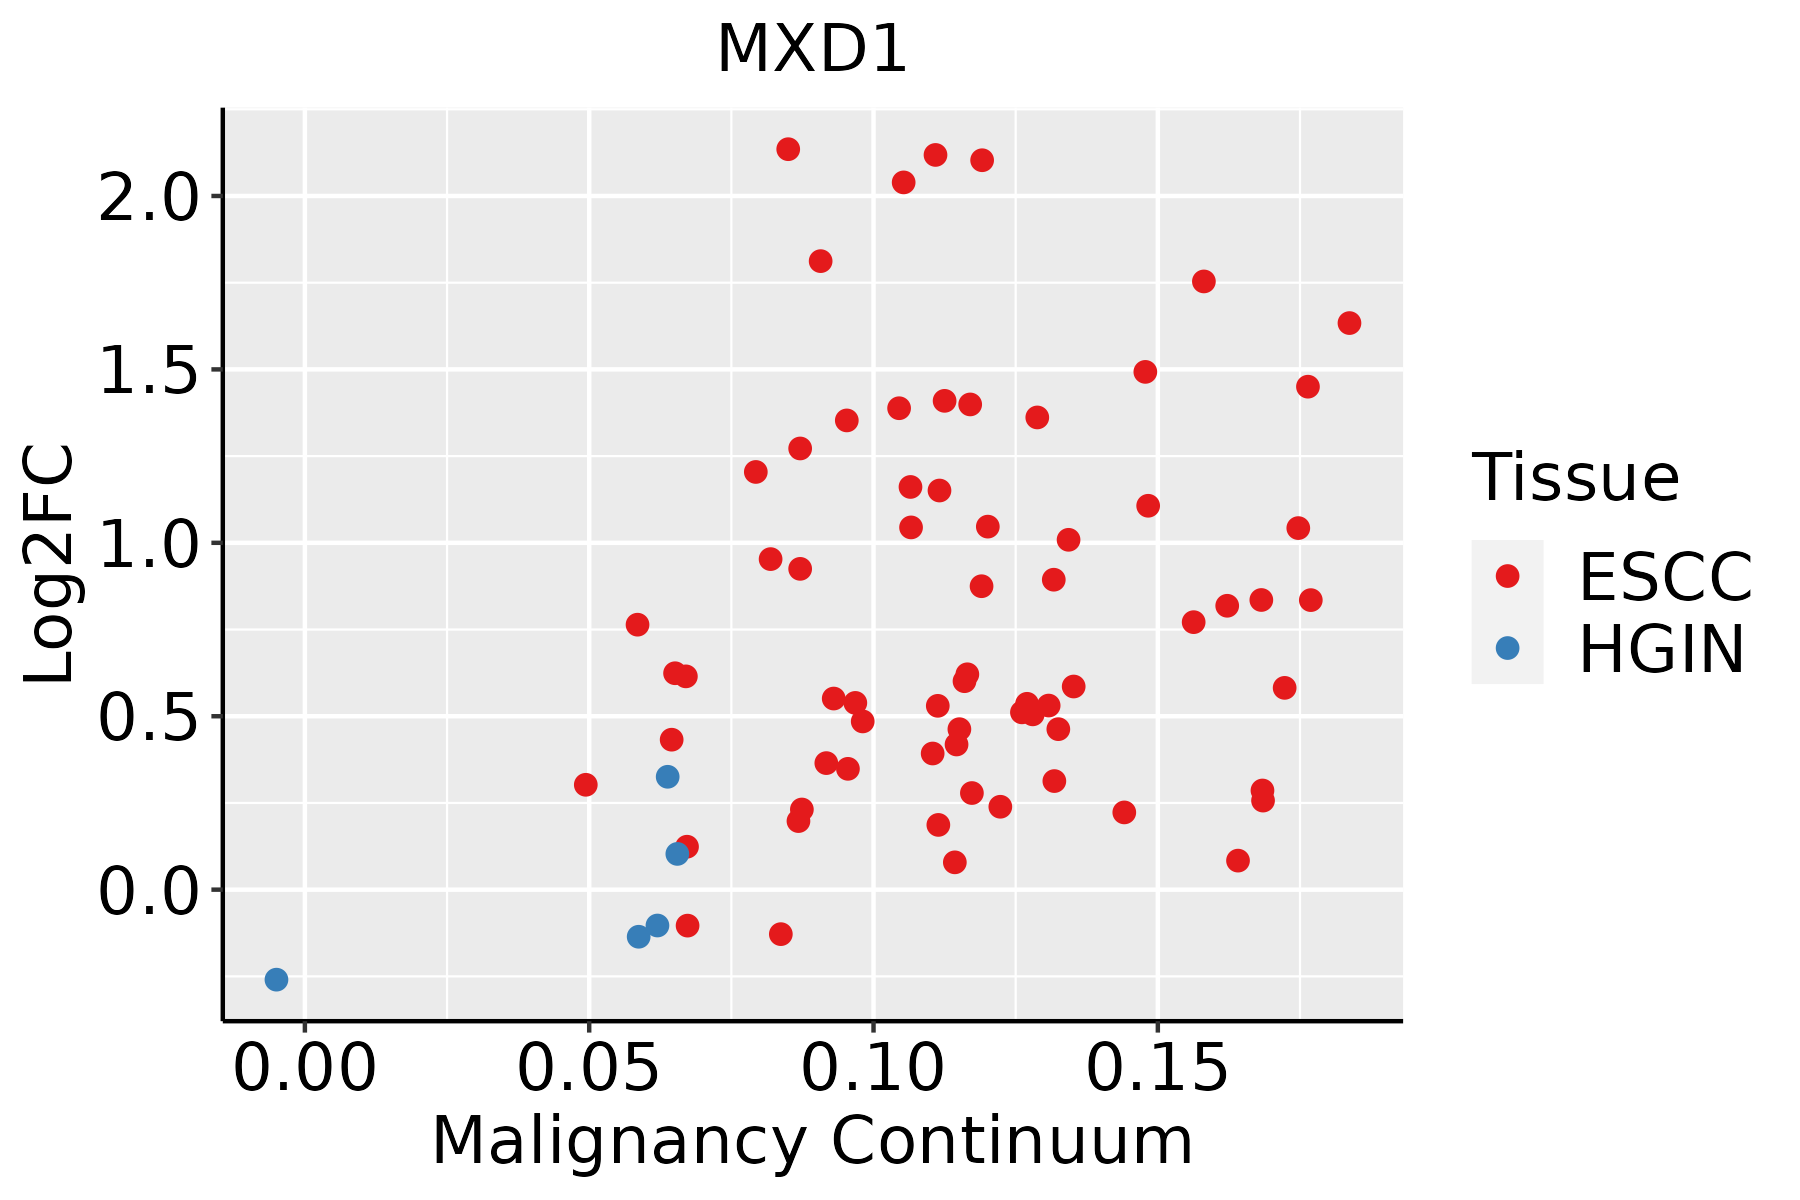 | ESCC: Esophageal squamous cell carcinoma |
| HGIN: High-grade intraepithelial neoplasias | ||
| LGIN: Low-grade intraepithelial neoplasias | ||
| GC | 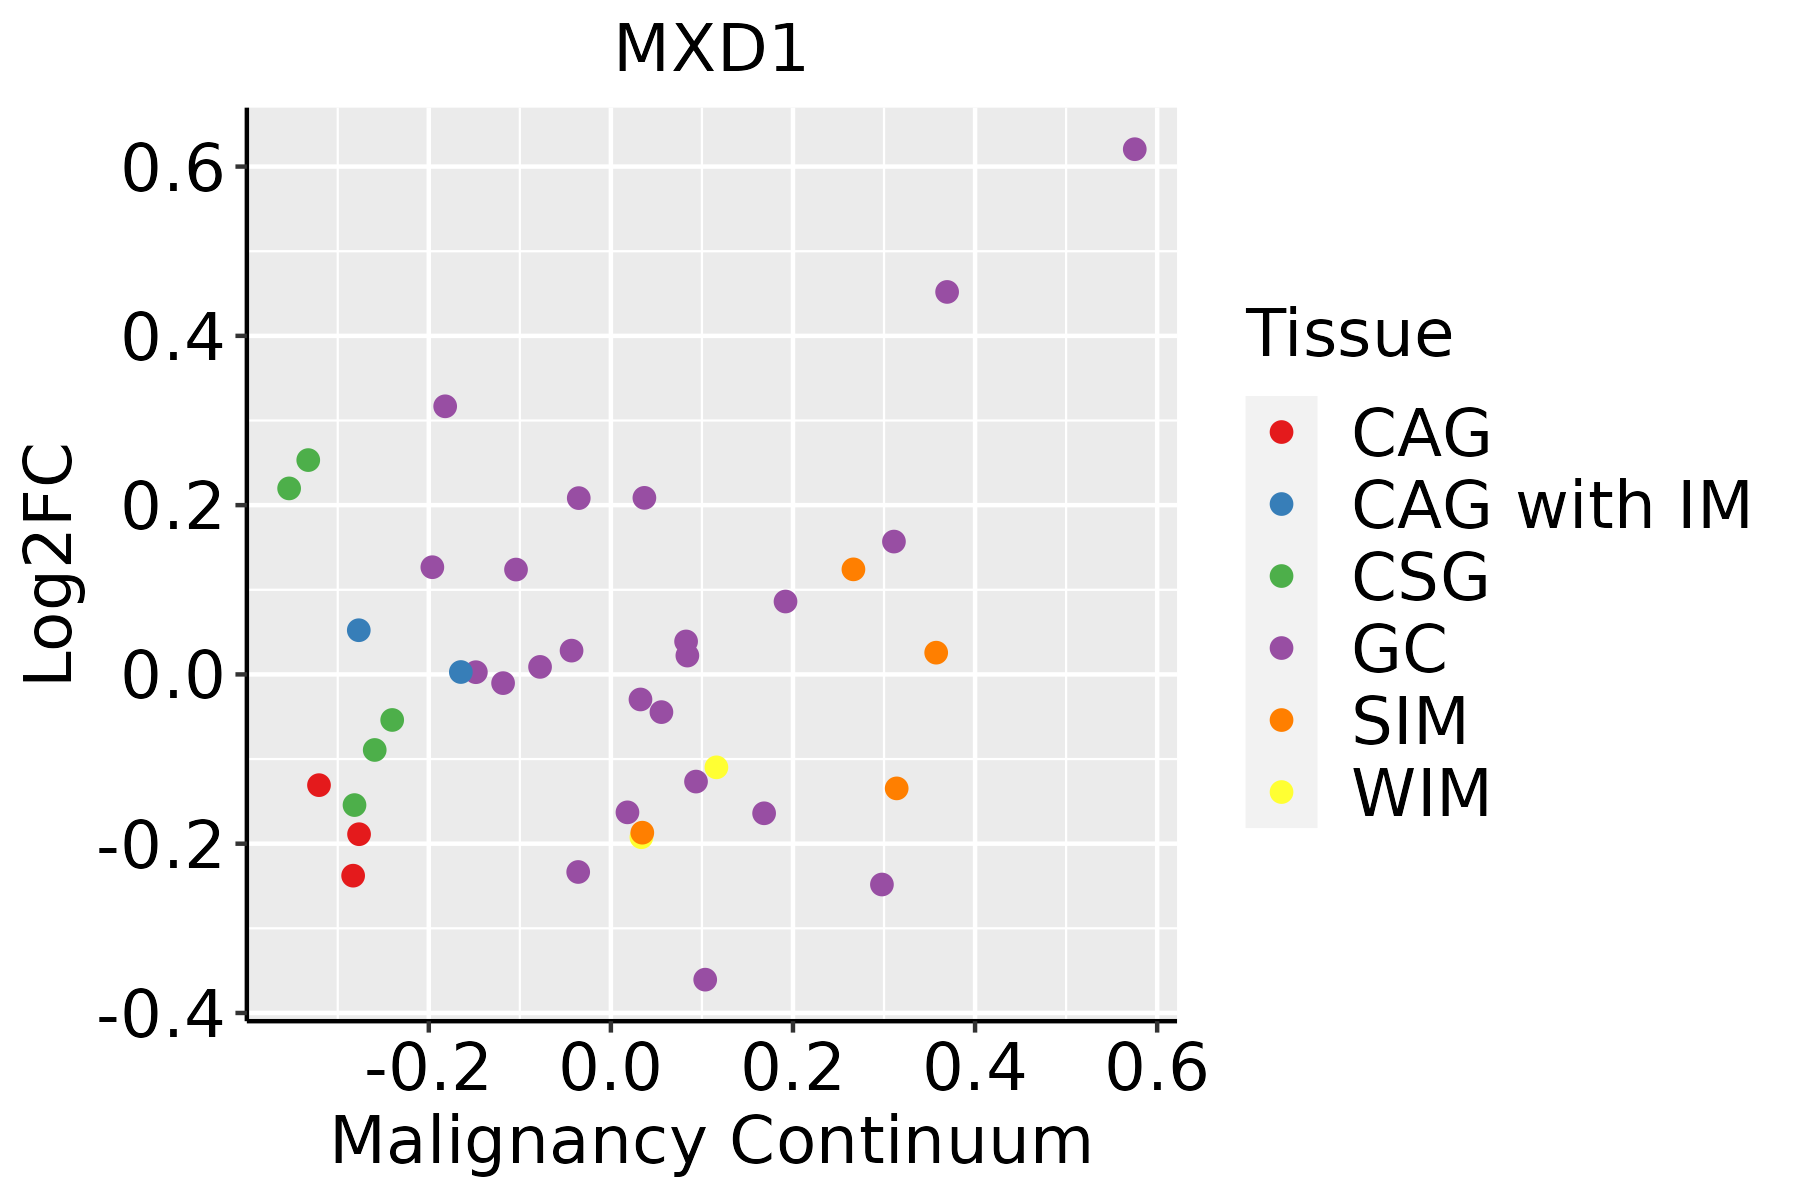 | CAG: Chronic atrophic gastritis |
| CAG with IM: Chronic atrophic gastritis with intestinal metaplasia | ||
| CSG: Chronic superficial gastritis | ||
| GC: Gastric cancer | ||
| SIM: Severe intestinal metaplasia | ||
| WIM: Wild intestinal metaplasia | ||
| Oral Cavity | 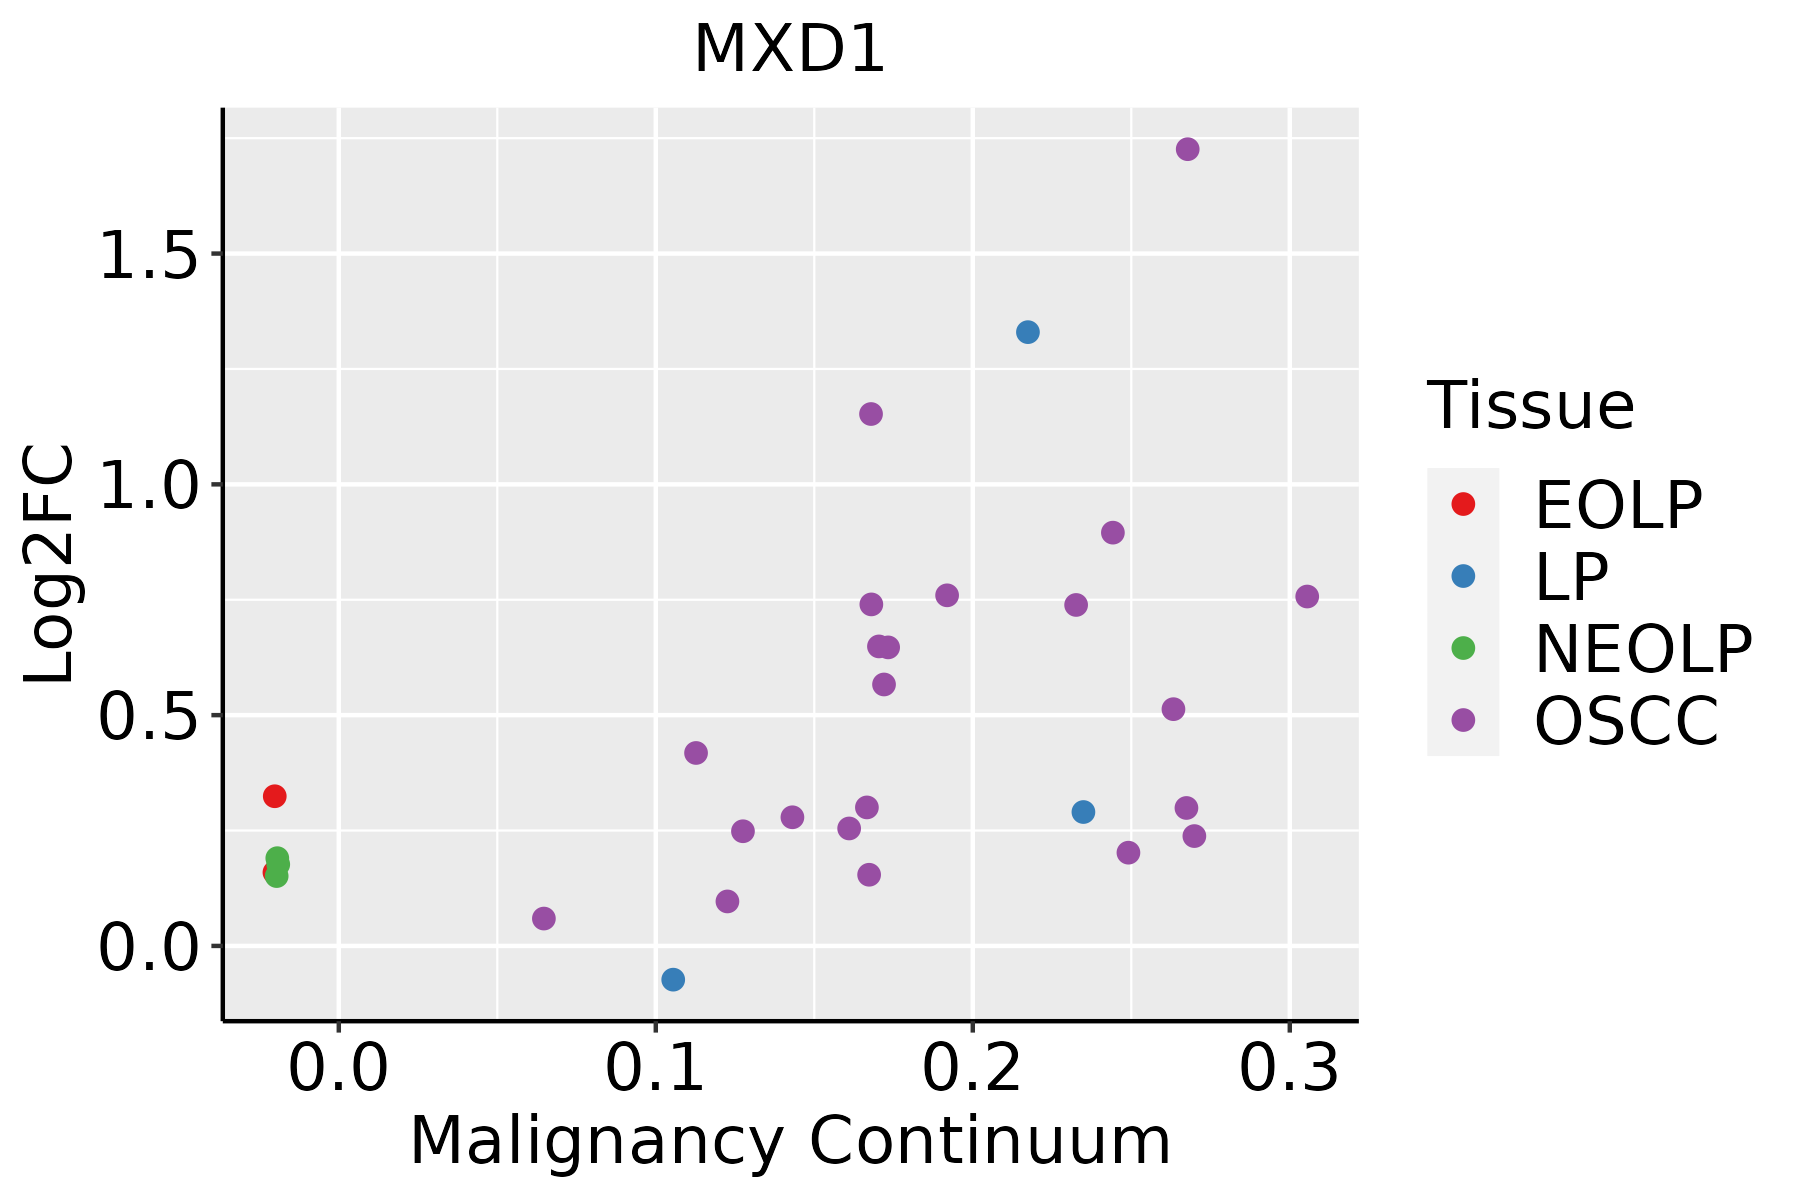 | EOLP: Erosive Oral lichen planus |
| LP: leukoplakia | ||
| NEOLP: Non-erosive oral lichen planus | ||
| OSCC: Oral squamous cell carcinoma | ||
| Prostate | 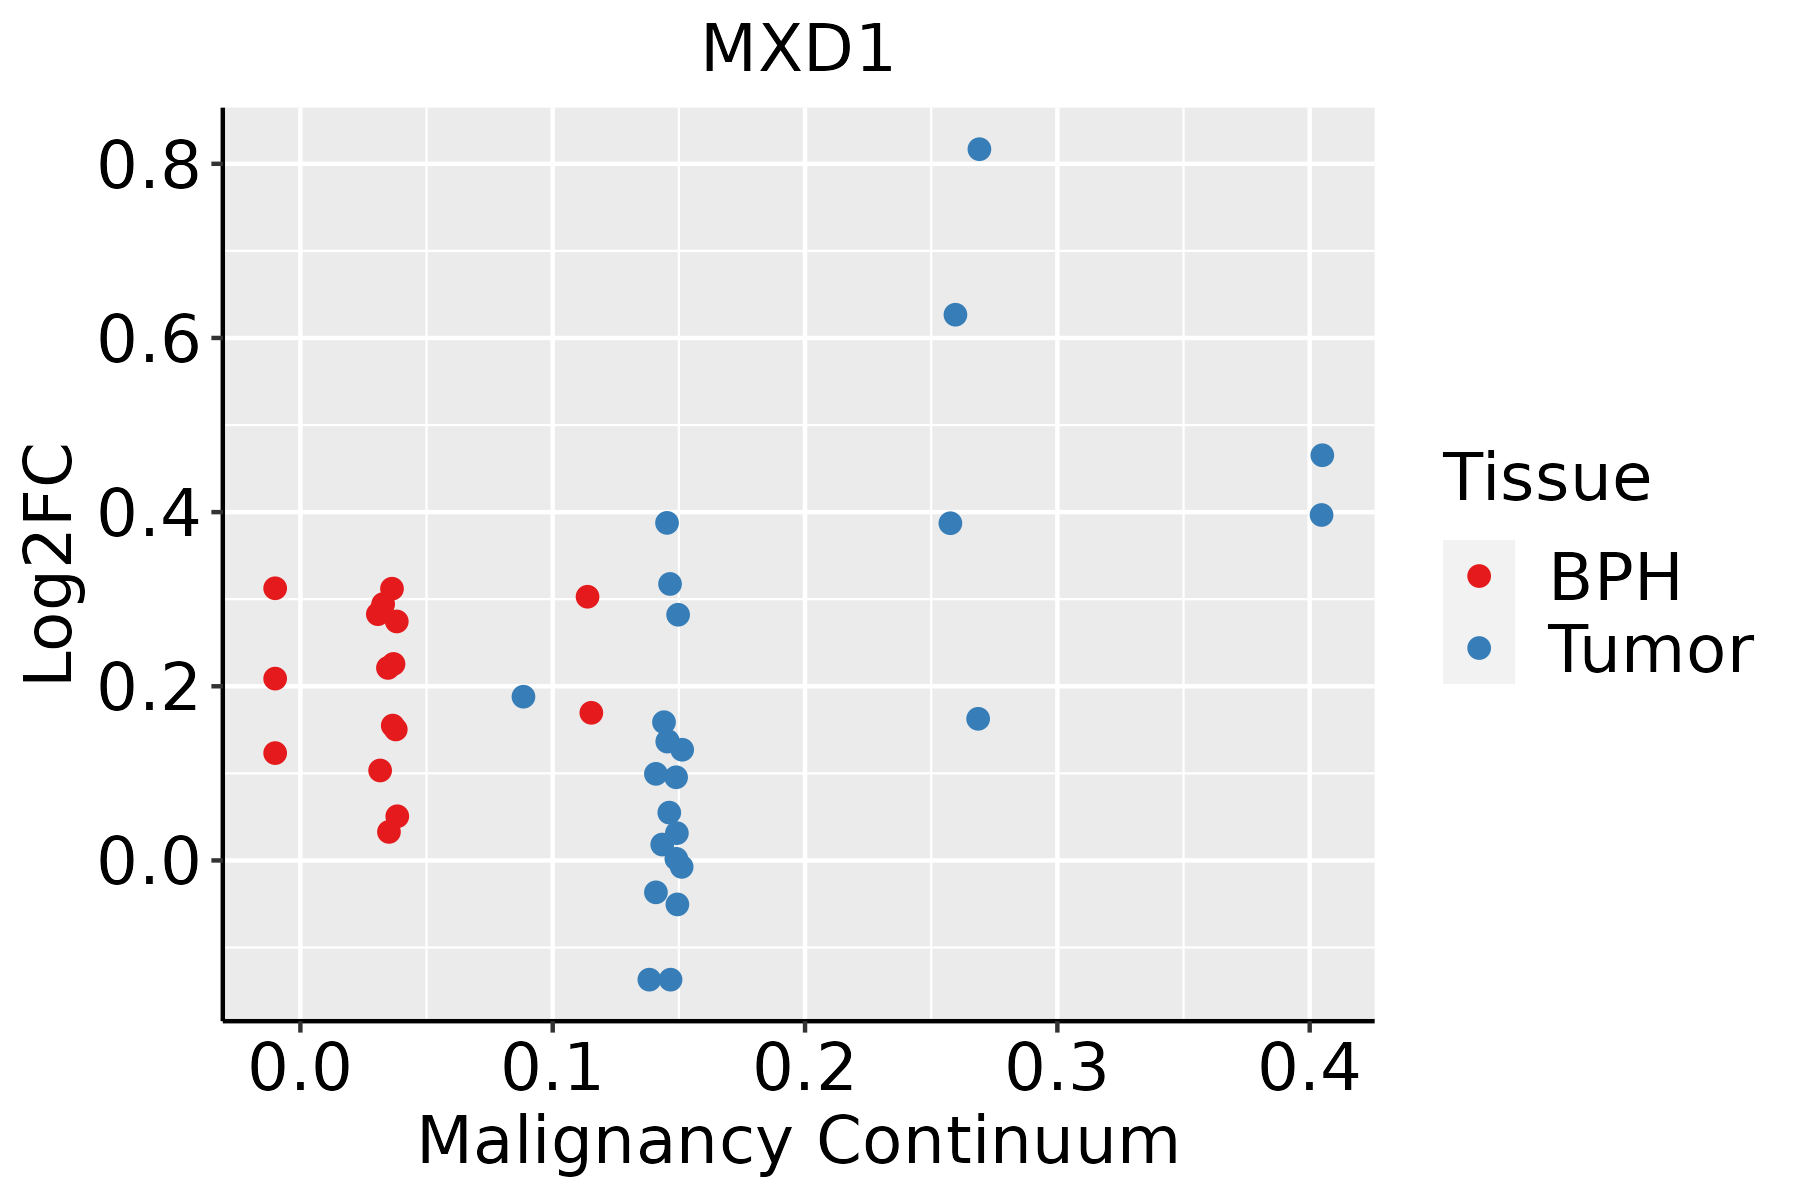 | BPH: Benign Prostatic Hyperplasia |
| Skin |  | AK: Actinic keratosis |
| cSCC: Cutaneous squamous cell carcinoma | ||
| SCCIS:squamous cell carcinoma in situ |
| ∗log2FC in expression of this searched gene in stem-like cells from each diseased tissue sample relative to stem-like cells in normal samples in each tissue plotted against the malignancy continuum. Samples are colored based on if they are from different disease stage. |
Top |
Malignant transformation related pathway analysis |
| Find out the enriched GO biological processes and KEGG pathways involved in transition from healthy to precancer to cancer |
| Tissue | Disease Stage | Enriched GO biological Processes |
| Colorectum | AD |  |
| Colorectum | SER |  |
| Colorectum | MSS |  |
| Colorectum | MSI-H |  |
| Colorectum | FAP |  |
| ∗Top 15 enriched GO BP terms are showed in the bar plot of each disease state in each tissue. Each row represents a significant GO biological process which is colored according to the -log10(p.adjust). |
| Page: 1 2 3 4 5 6 7 8 9 |
| GO ID | Tissue | Disease Stage | Description | Gene Ratio | Bg Ratio | pvalue | p.adjust | Count |
| Page: 1 |
| Pathway ID | Tissue | Disease Stage | Description | Gene Ratio | Bg Ratio | pvalue | p.adjust | qvalue | Count |
| Page: 1 |
Top |
Cell-cell communication analysis |
| Identification of potential cell-cell interactions between two cell types and their ligand-receptor pairs for different disease states |
| Ligand | Receptor | LRpair | Pathway | Tissue | Disease Stage |
| Page: 1 |
Top |
Single-cell gene regulatory network inference analysis |
| Find out the significant the regulons (TFs) and the target genes of each regulon across cell types for different disease states |
| TF | Cell Type | Tissue | Disease Stage | Target Gene | RSS | Regulon Activity |
| MXD1 | MLUM | Breast | Healthy | USP53,MALAT1,IER3, etc. | 3.96e-01 |  |
| MXD1 | SMC | Esophagus | ESCC | BDH1,CDKN2A,MFSD1, etc. | 4.56e-02 |  |
| MXD1 | SMC | Esophagus | Healthy | BDH1,CDKN2A,MFSD1, etc. | 8.77e-02 |  |
| MXD1 | MON | Liver | Cirrhotic | PLAUR,S100A8,VCAN, etc. | 3.94e-01 |  |
| MXD1 | DC | Liver | Healthy | PLAUR,S100A8,VCAN, etc. | 1.63e-02 |  |
| MXD1 | MON | Liver | Healthy | PLAUR,S100A8,VCAN, etc. | 1.33e-02 | |
| MXD1 | INMON | Lung | IAC | FCGR3B,SLC25A37,NAMPT, etc. | 2.55e-02 |  |
| MXD1 | NEUT | Lung | IAC | FCGR3B,SLC25A37,NAMPT, etc. | 6.17e-02 | |
| ∗The dot plots of a searched regulon are shown for all cell subpopulations in each disease state of each tissue based on the regulon specific score inferred using pySCENIC and by calculating the average expression. |
| Page: 1 |
Top |
Somatic mutation of malignant transformation related genes |
| Annotation of somatic variants for genes involved in malignant transformation |
| Hugo Symbol | Variant Class | Variant Classification | dbSNP RS | HGVSc | HGVSp | HGVSp Short | SWISSPROT | BIOTYPE | SIFT | PolyPhen | Tumor Sample Barcode | Tissue | Histology | Sex | Age | Stage | Therapy Types | Drugs | Outcome |
| MXD1 | SNV | Missense_Mutation | c.571N>C | p.Ser191Arg | p.S191R | Q05195 | protein_coding | deleterious(0) | probably_damaging(0.942) | TCGA-A8-A07L-01 | Breast | breast invasive carcinoma | Female | <65 | III/IV | Chemotherapy | CR | ||
| MXD1 | insertion | Nonsense_Mutation | novel | c.574_575insCTGAGTCTACTTAATATATTTCATTGCTCTCCTG | p.Met192ThrfsTer5 | p.M192Tfs*5 | Q05195 | protein_coding | TCGA-A2-A0CQ-01 | Breast | breast invasive carcinoma | Female | <65 | I/II | Chemotherapy | adriamycin | SD | ||
| MXD1 | SNV | Missense_Mutation | novel | c.398T>C | p.Leu133Pro | p.L133P | Q05195 | protein_coding | deleterious(0) | probably_damaging(0.999) | TCGA-2W-A8YY-01 | Cervix | cervical & endocervical cancer | Female | <65 | I/II | Chemotherapy | cisplatin | CR |
| MXD1 | SNV | Missense_Mutation | rs767887648 | c.281N>T | p.Thr94Met | p.T94M | Q05195 | protein_coding | deleterious(0.01) | probably_damaging(0.964) | TCGA-A6-5661-01 | Colorectum | colon adenocarcinoma | Female | >=65 | I/II | Unknown | Unknown | SD |
| MXD1 | SNV | Missense_Mutation | rs185788603 | c.496G>A | p.Val166Met | p.V166M | Q05195 | protein_coding | deleterious(0.02) | possibly_damaging(0.765) | TCGA-DM-A288-01 | Colorectum | colon adenocarcinoma | Male | >=65 | III/IV | Unknown | Unknown | PD |
| MXD1 | SNV | Missense_Mutation | rs535119144 | c.487N>A | p.Asp163Asn | p.D163N | Q05195 | protein_coding | deleterious(0.01) | probably_damaging(0.996) | TCGA-F5-6814-01 | Colorectum | rectum adenocarcinoma | Male | <65 | I/II | Unknown | Unknown | SD |
| MXD1 | SNV | Missense_Mutation | novel | c.406N>A | p.Leu136Met | p.L136M | Q05195 | protein_coding | deleterious(0.01) | probably_damaging(0.95) | TCGA-A5-A0G1-01 | Endometrium | uterine corpus endometrioid carcinoma | Female | >=65 | I/II | Unknown | Unknown | SD |
| MXD1 | SNV | Missense_Mutation | novel | c.661C>T | p.Leu221Phe | p.L221F | Q05195 | protein_coding | deleterious_low_confidence(0.01) | probably_damaging(0.986) | TCGA-AX-A2HC-01 | Endometrium | uterine corpus endometrioid carcinoma | Female | <65 | III/IV | Chemotherapy | paclitaxel | PD |
| MXD1 | SNV | Missense_Mutation | c.164G>T | p.Ser55Ile | p.S55I | Q05195 | protein_coding | tolerated(0.17) | benign(0.09) | TCGA-BS-A0UV-01 | Endometrium | uterine corpus endometrioid carcinoma | Female | <65 | III/IV | Unknown | Unknown | SD | |
| MXD1 | SNV | Missense_Mutation | c.400N>A | p.Glu134Lys | p.E134K | Q05195 | protein_coding | deleterious(0.01) | probably_damaging(0.998) | TCGA-D1-A168-01 | Endometrium | uterine corpus endometrioid carcinoma | Female | >=65 | I/II | Unknown | Unknown | SD |
| Page: 1 2 |
Top |
Related drugs of malignant transformation related genes |
| Identification of chemicals and drugs interact with genes involved in malignant transfromation |
| (DGIdb 4.0) |
| Entrez ID | Symbol | Category | Interaction Types | Drug Claim Name | Drug Name | PMIDs |
| Page: 1 |

Copyright 2023-Present -The University of Texas Health Science Center at Houston |