
|
|||||
|
 | |
| |
| |
| |
| |
| |
|
Gene: MX2 |
Gene summary for MX2 |
| Gene information | Species | Human | Gene symbol | MX2 | Gene ID | 4600 |
| Gene name | MX dynamin like GTPase 2 | |
| Gene Alias | MXB | |
| Cytomap | 21q22.3 | |
| Gene Type | protein-coding | GO ID | GO:0002376 | UniProtAcc | P20592 |
Top |
Malignant transformation analysis |
| Identification of the aberrant gene expression in precancerous and cancerous lesions by comparing the gene expression of stem-like cells in diseased tissues with normal stem cells |
| Entrez ID | Symbol | Replicates | Species | Organ | Tissue | Adj P-value | Log2FC | Malignancy |
| 4600 | MX2 | LZE4T | Human | Esophagus | ESCC | 1.03e-06 | 2.51e-01 | 0.0811 |
| 4600 | MX2 | LZE7T | Human | Esophagus | ESCC | 2.04e-02 | 2.04e-01 | 0.0667 |
| 4600 | MX2 | LZE8T | Human | Esophagus | ESCC | 1.47e-05 | 2.34e-01 | 0.067 |
| 4600 | MX2 | LZE20T | Human | Esophagus | ESCC | 2.78e-08 | 3.99e-01 | 0.0662 |
| 4600 | MX2 | LZE24T | Human | Esophagus | ESCC | 1.77e-40 | 1.48e+00 | 0.0596 |
| 4600 | MX2 | P1T-E | Human | Esophagus | ESCC | 9.32e-11 | 8.41e-01 | 0.0875 |
| 4600 | MX2 | P2T-E | Human | Esophagus | ESCC | 9.69e-14 | 3.50e-01 | 0.1177 |
| 4600 | MX2 | P4T-E | Human | Esophagus | ESCC | 1.82e-19 | 4.87e-01 | 0.1323 |
| 4600 | MX2 | P5T-E | Human | Esophagus | ESCC | 4.40e-09 | 2.09e-01 | 0.1327 |
| 4600 | MX2 | P8T-E | Human | Esophagus | ESCC | 3.95e-30 | 4.88e-01 | 0.0889 |
| 4600 | MX2 | P9T-E | Human | Esophagus | ESCC | 6.02e-15 | 4.42e-01 | 0.1131 |
| 4600 | MX2 | P10T-E | Human | Esophagus | ESCC | 5.17e-27 | 4.45e-01 | 0.116 |
| 4600 | MX2 | P11T-E | Human | Esophagus | ESCC | 3.16e-17 | 8.46e-01 | 0.1426 |
| 4600 | MX2 | P16T-E | Human | Esophagus | ESCC | 1.62e-13 | 2.30e-01 | 0.1153 |
| 4600 | MX2 | P17T-E | Human | Esophagus | ESCC | 1.76e-06 | 3.77e-01 | 0.1278 |
| 4600 | MX2 | P19T-E | Human | Esophagus | ESCC | 3.41e-06 | 5.36e-01 | 0.1662 |
| 4600 | MX2 | P20T-E | Human | Esophagus | ESCC | 4.59e-14 | 3.59e-01 | 0.1124 |
| 4600 | MX2 | P21T-E | Human | Esophagus | ESCC | 2.03e-09 | 2.92e-01 | 0.1617 |
| 4600 | MX2 | P23T-E | Human | Esophagus | ESCC | 1.93e-06 | 2.39e-01 | 0.108 |
| 4600 | MX2 | P24T-E | Human | Esophagus | ESCC | 5.30e-21 | 4.58e-01 | 0.1287 |
| Page: 1 2 3 4 5 |
| Tissue | Expression Dynamics | Abbreviation |
| Esophagus | 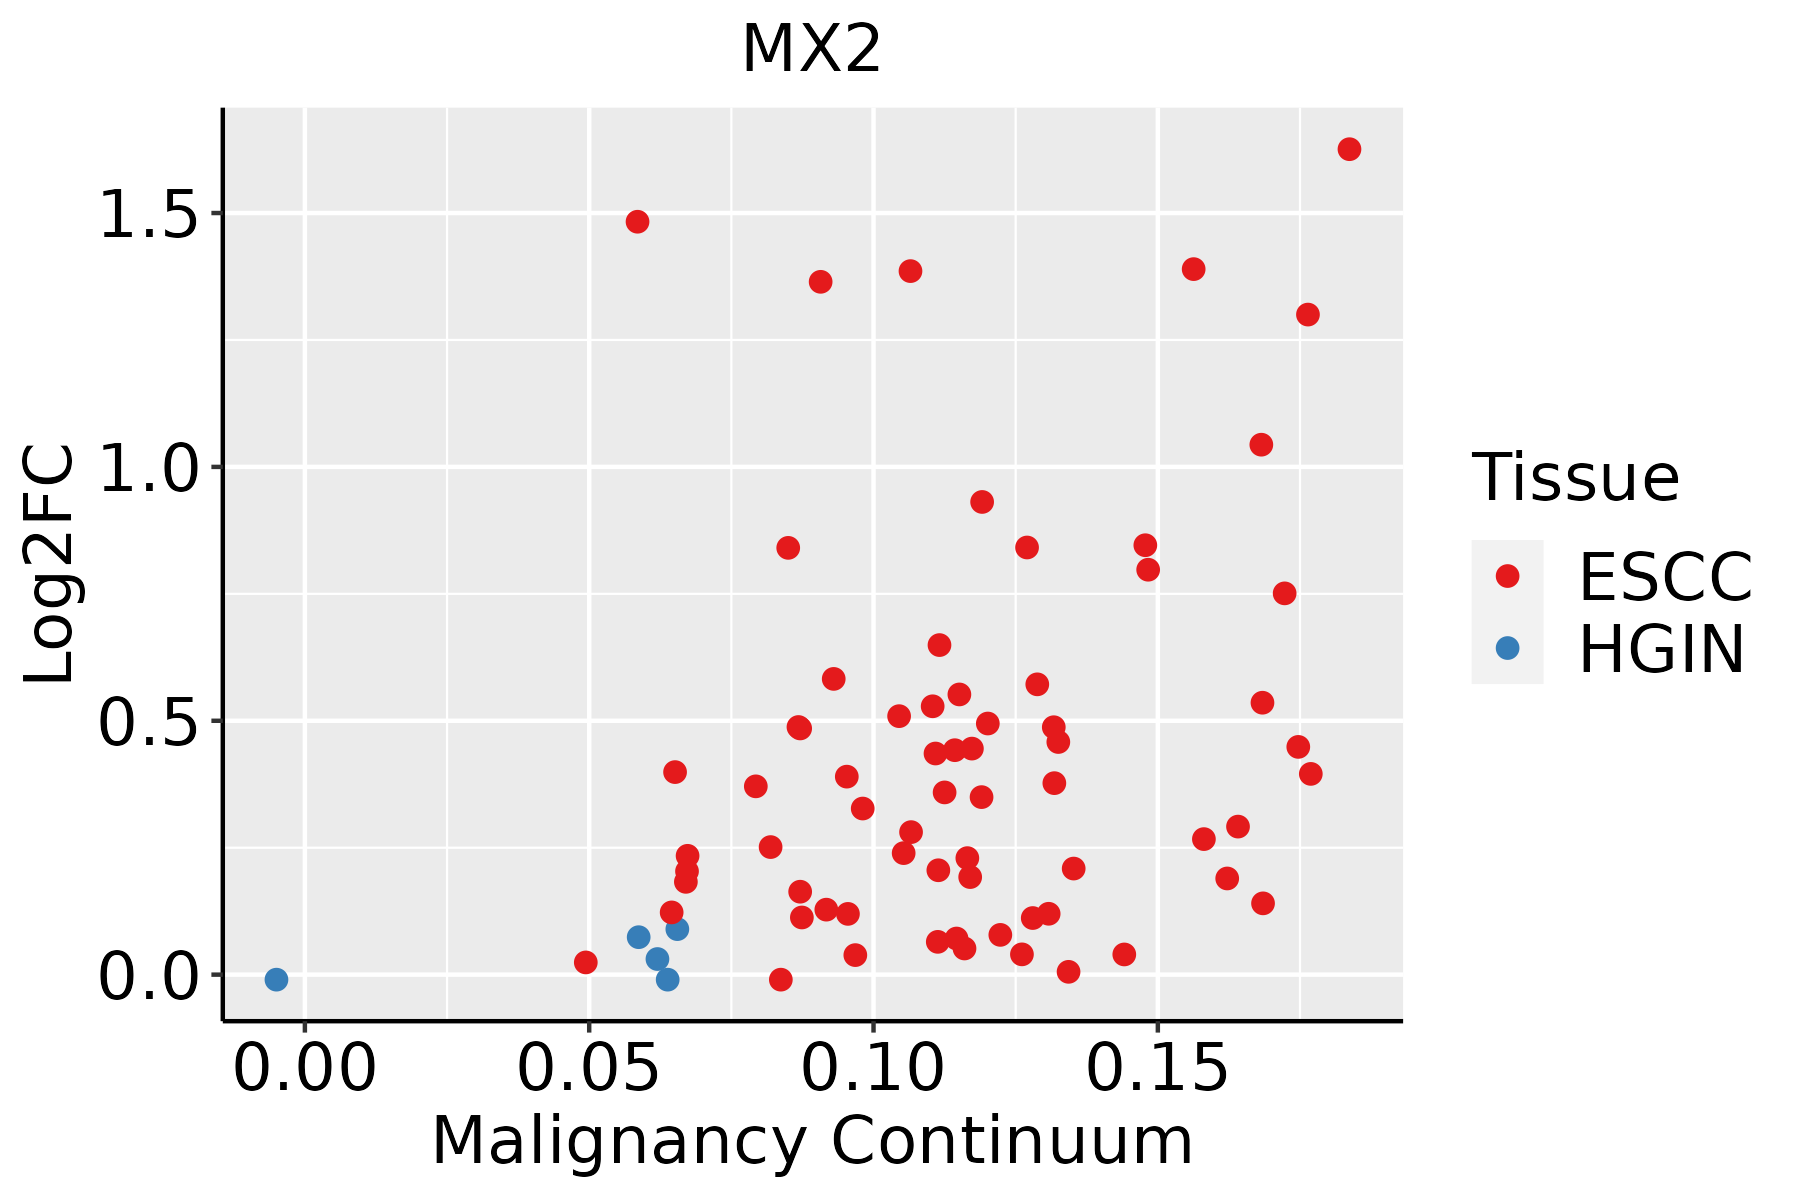 | ESCC: Esophageal squamous cell carcinoma |
| HGIN: High-grade intraepithelial neoplasias | ||
| LGIN: Low-grade intraepithelial neoplasias | ||
| Liver | 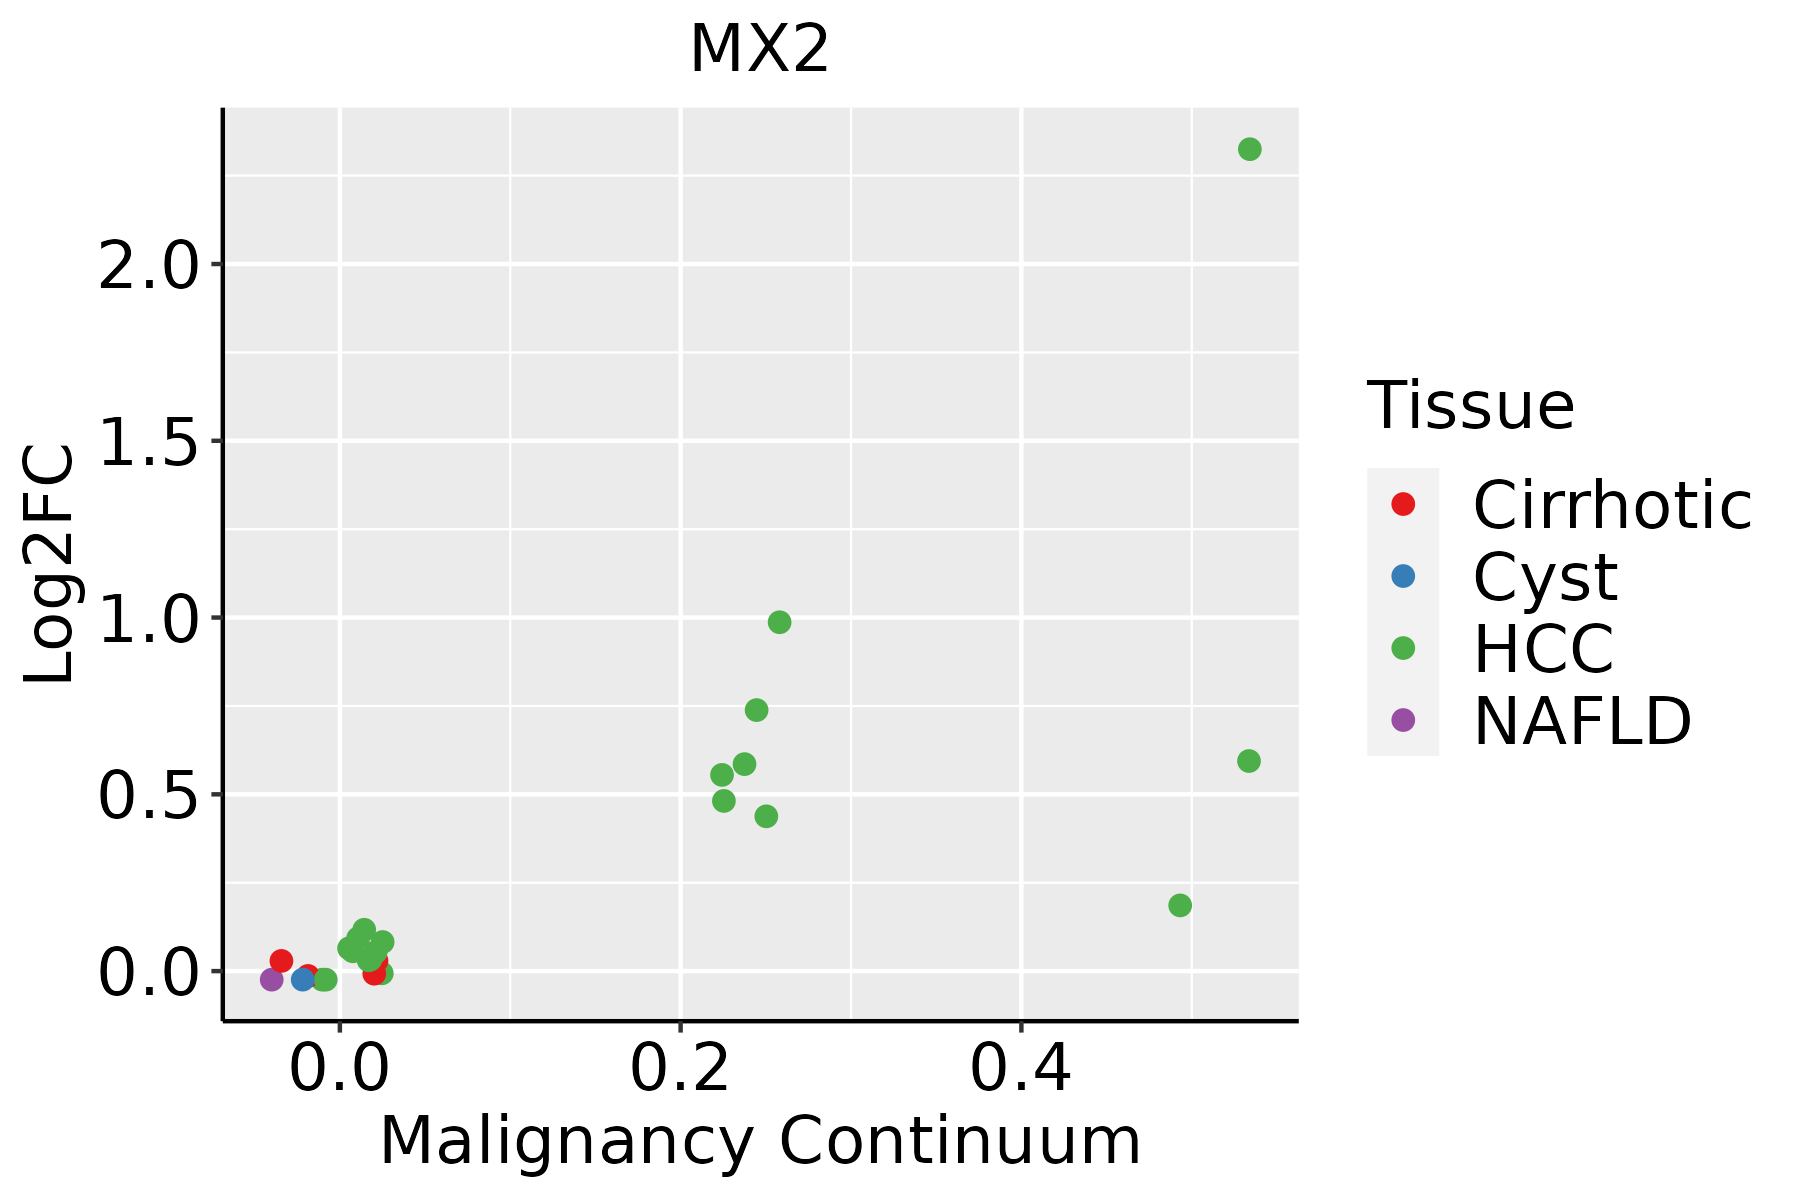 | HCC: Hepatocellular carcinoma |
| NAFLD: Non-alcoholic fatty liver disease | ||
| Lung |  | AAH: Atypical adenomatous hyperplasia |
| AIS: Adenocarcinoma in situ | ||
| IAC: Invasive lung adenocarcinoma | ||
| MIA: Minimally invasive adenocarcinoma | ||
| Oral Cavity | 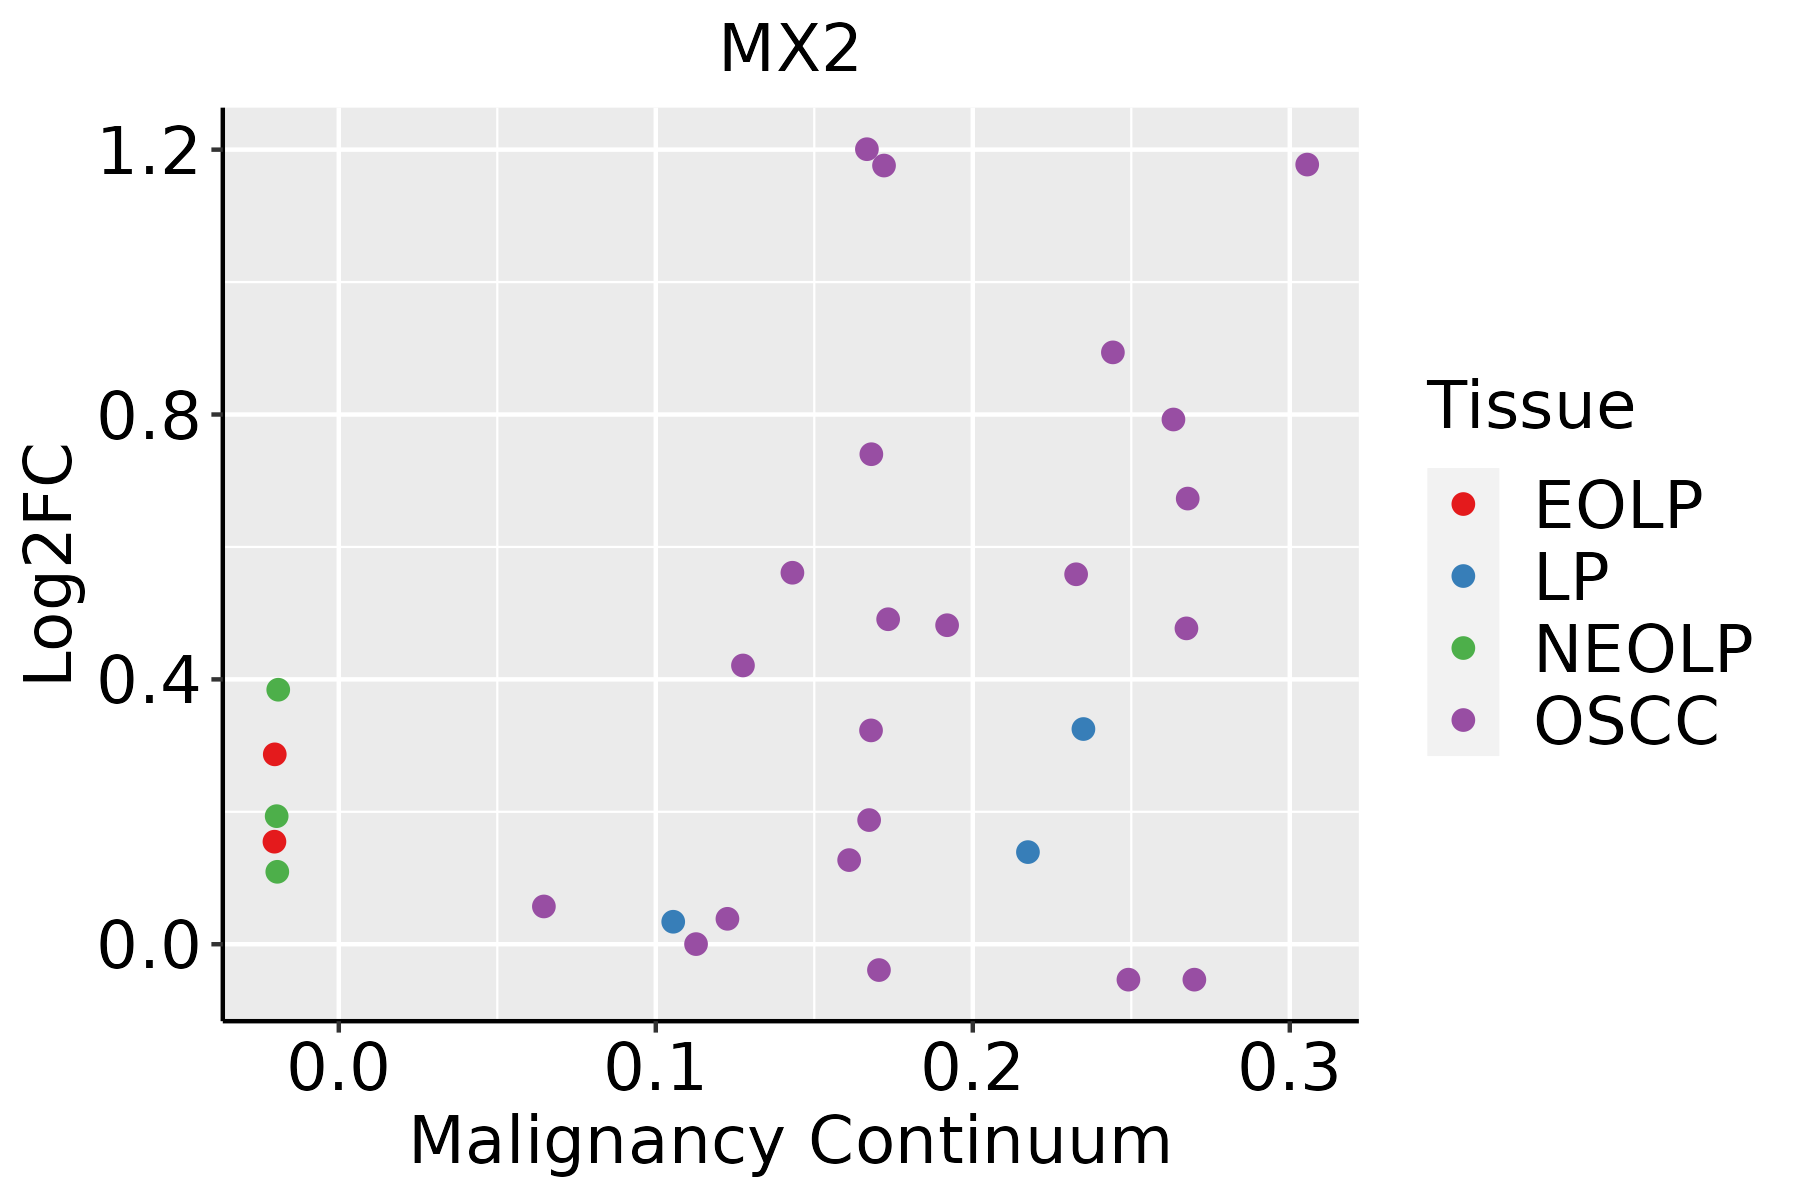 | EOLP: Erosive Oral lichen planus |
| LP: leukoplakia | ||
| NEOLP: Non-erosive oral lichen planus | ||
| OSCC: Oral squamous cell carcinoma | ||
| Thyroid |  | ATC: Anaplastic thyroid cancer |
| HT: Hashimoto's thyroiditis | ||
| PTC: Papillary thyroid cancer |
| ∗log2FC in expression of this searched gene in stem-like cells from each diseased tissue sample relative to stem-like cells in normal samples in each tissue plotted against the malignancy continuum. Samples are colored based on if they are from different disease stage. |
Top |
Malignant transformation related pathway analysis |
| Find out the enriched GO biological processes and KEGG pathways involved in transition from healthy to precancer to cancer |
| Tissue | Disease Stage | Enriched GO biological Processes |
| Colorectum | AD |  |
| Colorectum | SER |  |
| Colorectum | MSS |  |
| Colorectum | MSI-H |  |
| Colorectum | FAP |  |
| ∗Top 15 enriched GO BP terms are showed in the bar plot of each disease state in each tissue. Each row represents a significant GO biological process which is colored according to the -log10(p.adjust). |
| Page: 1 2 3 4 5 6 7 8 9 |
| GO ID | Tissue | Disease Stage | Description | Gene Ratio | Bg Ratio | pvalue | p.adjust | Count |
| GO:00016556 | Endometrium | AEH | urogenital system development | 67/2100 | 338/18723 | 2.30e-06 | 6.76e-05 | 67 |
| GO:00720015 | Endometrium | AEH | renal system development | 61/2100 | 302/18723 | 3.43e-06 | 9.24e-05 | 61 |
| GO:000941010 | Endometrium | AEH | response to xenobiotic stimulus | 71/2100 | 462/18723 | 3.66e-03 | 2.50e-02 | 71 |
| GO:000165512 | Endometrium | EEC | urogenital system development | 69/2168 | 338/18723 | 1.70e-06 | 5.18e-05 | 69 |
| GO:007200112 | Endometrium | EEC | renal system development | 63/2168 | 302/18723 | 2.24e-06 | 6.59e-05 | 63 |
| GO:00613511 | Endometrium | EEC | neural precursor cell proliferation | 29/2168 | 145/18723 | 2.24e-03 | 1.67e-02 | 29 |
| GO:000941015 | Endometrium | EEC | response to xenobiotic stimulus | 73/2168 | 462/18723 | 3.55e-03 | 2.38e-02 | 73 |
| GO:00219874 | Endometrium | EEC | cerebral cortex development | 23/2168 | 114/18723 | 5.41e-03 | 3.32e-02 | 23 |
| GO:0008380111 | Esophagus | ESCC | RNA splicing | 336/8552 | 434/18723 | 1.74e-42 | 3.67e-39 | 336 |
| GO:0000375111 | Esophagus | ESCC | RNA splicing, via transesterification reactions | 248/8552 | 324/18723 | 3.05e-30 | 1.49e-27 | 248 |
| GO:0000377111 | Esophagus | ESCC | RNA splicing, via transesterification reactions with bulged adenosine as nucleophile | 244/8552 | 320/18723 | 2.52e-29 | 1.07e-26 | 244 |
| GO:0000398111 | Esophagus | ESCC | mRNA splicing, via spliceosome | 244/8552 | 320/18723 | 2.52e-29 | 1.07e-26 | 244 |
| GO:0006913110 | Esophagus | ESCC | nucleocytoplasmic transport | 230/8552 | 301/18723 | 6.04e-28 | 2.02e-25 | 230 |
| GO:0051169110 | Esophagus | ESCC | nuclear transport | 230/8552 | 301/18723 | 6.04e-28 | 2.02e-25 | 230 |
| GO:0006403110 | Esophagus | ESCC | RNA localization | 166/8552 | 201/18723 | 1.95e-27 | 6.18e-25 | 166 |
| GO:003238618 | Esophagus | ESCC | regulation of intracellular transport | 243/8552 | 337/18723 | 3.20e-23 | 7.25e-21 | 243 |
| GO:005123617 | Esophagus | ESCC | establishment of RNA localization | 134/8552 | 166/18723 | 1.23e-20 | 1.81e-18 | 134 |
| GO:005102815 | Esophagus | ESCC | mRNA transport | 110/8552 | 130/18723 | 2.76e-20 | 3.80e-18 | 110 |
| GO:005065717 | Esophagus | ESCC | nucleic acid transport | 131/8552 | 163/18723 | 6.94e-20 | 8.46e-18 | 131 |
| GO:005065817 | Esophagus | ESCC | RNA transport | 131/8552 | 163/18723 | 6.94e-20 | 8.46e-18 | 131 |
| Page: 1 2 3 4 5 6 7 |
| Pathway ID | Tissue | Disease Stage | Description | Gene Ratio | Bg Ratio | pvalue | p.adjust | qvalue | Count |
| hsa032509 | Esophagus | ESCC | Viral life cycle - HIV-1 | 54/4205 | 63/8465 | 2.01e-09 | 2.17e-08 | 1.11e-08 | 54 |
| hsa0516425 | Esophagus | ESCC | Influenza A | 122/4205 | 171/8465 | 5.01e-09 | 4.79e-08 | 2.45e-08 | 122 |
| hsa0516510 | Esophagus | ESCC | Human papillomavirus infection | 215/4205 | 331/8465 | 7.86e-09 | 7.12e-08 | 3.65e-08 | 215 |
| hsa05171211 | Esophagus | ESCC | Coronavirus disease - COVID-19 | 156/4205 | 232/8465 | 3.18e-08 | 2.68e-07 | 1.37e-07 | 156 |
| hsa051609 | Esophagus | ESCC | Hepatitis C | 107/4205 | 157/8465 | 1.75e-06 | 1.08e-05 | 5.55e-06 | 107 |
| hsa051629 | Esophagus | ESCC | Measles | 90/4205 | 139/8465 | 2.16e-04 | 7.87e-04 | 4.03e-04 | 90 |
| hsa0325014 | Esophagus | ESCC | Viral life cycle - HIV-1 | 54/4205 | 63/8465 | 2.01e-09 | 2.17e-08 | 1.11e-08 | 54 |
| hsa0516435 | Esophagus | ESCC | Influenza A | 122/4205 | 171/8465 | 5.01e-09 | 4.79e-08 | 2.45e-08 | 122 |
| hsa0516515 | Esophagus | ESCC | Human papillomavirus infection | 215/4205 | 331/8465 | 7.86e-09 | 7.12e-08 | 3.65e-08 | 215 |
| hsa05171310 | Esophagus | ESCC | Coronavirus disease - COVID-19 | 156/4205 | 232/8465 | 3.18e-08 | 2.68e-07 | 1.37e-07 | 156 |
| hsa0516016 | Esophagus | ESCC | Hepatitis C | 107/4205 | 157/8465 | 1.75e-06 | 1.08e-05 | 5.55e-06 | 107 |
| hsa0516213 | Esophagus | ESCC | Measles | 90/4205 | 139/8465 | 2.16e-04 | 7.87e-04 | 4.03e-04 | 90 |
| hsa0517142 | Liver | HCC | Coronavirus disease - COVID-19 | 167/4020 | 232/8465 | 1.50e-14 | 4.19e-13 | 2.33e-13 | 167 |
| hsa032502 | Liver | HCC | Viral life cycle - HIV-1 | 46/4020 | 63/8465 | 3.25e-05 | 1.88e-04 | 1.04e-04 | 46 |
| hsa051652 | Liver | HCC | Human papillomavirus infection | 188/4020 | 331/8465 | 3.34e-04 | 1.49e-03 | 8.29e-04 | 188 |
| hsa0516021 | Liver | HCC | Hepatitis C | 94/4020 | 157/8465 | 1.11e-03 | 4.10e-03 | 2.28e-03 | 94 |
| hsa0516421 | Liver | HCC | Influenza A | 101/4020 | 171/8465 | 1.41e-03 | 5.07e-03 | 2.82e-03 | 101 |
| hsa0517152 | Liver | HCC | Coronavirus disease - COVID-19 | 167/4020 | 232/8465 | 1.50e-14 | 4.19e-13 | 2.33e-13 | 167 |
| hsa0325011 | Liver | HCC | Viral life cycle - HIV-1 | 46/4020 | 63/8465 | 3.25e-05 | 1.88e-04 | 1.04e-04 | 46 |
| hsa051653 | Liver | HCC | Human papillomavirus infection | 188/4020 | 331/8465 | 3.34e-04 | 1.49e-03 | 8.29e-04 | 188 |
| Page: 1 2 3 4 |
Top |
Cell-cell communication analysis |
| Identification of potential cell-cell interactions between two cell types and their ligand-receptor pairs for different disease states |
| Ligand | Receptor | LRpair | Pathway | Tissue | Disease Stage |
| Page: 1 |
Top |
Single-cell gene regulatory network inference analysis |
| Find out the significant the regulons (TFs) and the target genes of each regulon across cell types for different disease states |
| TF | Cell Type | Tissue | Disease Stage | Target Gene | RSS | Regulon Activity |
| ∗The dot plots of a searched regulon are shown for all cell subpopulations in each disease state of each tissue based on the regulon specific score inferred using pySCENIC and by calculating the average expression. |
| Page: 1 |
Top |
Somatic mutation of malignant transformation related genes |
| Annotation of somatic variants for genes involved in malignant transformation |
| Hugo Symbol | Variant Class | Variant Classification | dbSNP RS | HGVSc | HGVSp | HGVSp Short | SWISSPROT | BIOTYPE | SIFT | PolyPhen | Tumor Sample Barcode | Tissue | Histology | Sex | Age | Stage | Therapy Types | Drugs | Outcome |
| MX2 | SNV | Missense_Mutation | c.2050G>A | p.Glu684Lys | p.E684K | P20592 | protein_coding | deleterious(0.01) | possibly_damaging(0.489) | TCGA-AC-A23H-01 | Breast | breast invasive carcinoma | Female | >=65 | I/II | Unknown | Unknown | PD | |
| MX2 | SNV | Missense_Mutation | rs527335705 | c.373G>A | p.Gly125Arg | p.G125R | P20592 | protein_coding | deleterious(0) | probably_damaging(1) | TCGA-BH-A0WA-01 | Breast | breast invasive carcinoma | Female | >=65 | I/II | Unknown | Unknown | SD |
| MX2 | SNV | Missense_Mutation | c.649G>A | p.Glu217Lys | p.E217K | P20592 | protein_coding | tolerated(0.07) | benign(0.06) | TCGA-D8-A1JN-01 | Breast | breast invasive carcinoma | Female | >=65 | III/IV | Hormone Therapy | anastrozolum | SD | |
| MX2 | insertion | Nonsense_Mutation | novel | c.75_76insCTACAAGTAGCAAAGGAACATTGAGACTCT | p.Glu25_Met26insLeuGlnValAlaLysGluHisTerAspSer | p.E25_M26insLQVAKEH*DS | P20592 | protein_coding | TCGA-A7-A0CJ-01 | Breast | breast invasive carcinoma | Female | <65 | I/II | Chemotherapy | cytoxan | SD | ||
| MX2 | insertion | Frame_Shift_Ins | novel | c.144_145insGGGTGGGGTGAGGAGGGGT | p.Trp49GlyfsTer60 | p.W49Gfs*60 | P20592 | protein_coding | TCGA-BH-A0B4-01 | Breast | breast invasive carcinoma | Male | >=65 | III/IV | Hormone Therapy | tamoxiphen | SD | ||
| MX2 | SNV | Missense_Mutation | c.1655N>T | p.Thr552Met | p.T552M | P20592 | protein_coding | tolerated(0.08) | benign(0.01) | TCGA-2W-A8YY-01 | Cervix | cervical & endocervical cancer | Female | <65 | I/II | Chemotherapy | cisplatin | CR | |
| MX2 | SNV | Missense_Mutation | rs367788793 | c.1106G>A | p.Arg369Gln | p.R369Q | P20592 | protein_coding | tolerated(0.29) | possibly_damaging(0.545) | TCGA-C5-A8XJ-01 | Cervix | cervical & endocervical cancer | Female | >=65 | I/II | Chemotherapy | cisplatin | SD |
| MX2 | SNV | Missense_Mutation | novel | c.78N>A | p.Met26Ile | p.M26I | P20592 | protein_coding | tolerated_low_confidence(0.11) | benign(0.001) | TCGA-DS-A1OB-01 | Cervix | cervical & endocervical cancer | Female | <65 | I/II | Chemotherapy | carboplatin | PD |
| MX2 | SNV | Missense_Mutation | novel | c.1003A>C | p.Asn335His | p.N335H | P20592 | protein_coding | tolerated(0.05) | benign(0.035) | TCGA-FU-A3HZ-01 | Cervix | cervical & endocervical cancer | Female | <65 | I/II | Chemotherapy | cisplatin | CR |
| MX2 | SNV | Missense_Mutation | novel | c.919N>T | p.Val307Phe | p.V307F | P20592 | protein_coding | deleterious(0) | probably_damaging(0.934) | TCGA-LP-A7HU-01 | Cervix | cervical & endocervical cancer | Female | <65 | I/II | Unknown | Unknown | SD |
| Page: 1 2 3 4 5 6 7 |
Top |
Related drugs of malignant transformation related genes |
| Identification of chemicals and drugs interact with genes involved in malignant transfromation |
| (DGIdb 4.0) |
| Entrez ID | Symbol | Category | Interaction Types | Drug Claim Name | Drug Name | PMIDs |
| Page: 1 |

Copyright 2023-Present -The University of Texas Health Science Center at Houston |