| Tissue | Expression Dynamics | Abbreviation |
| Breast | 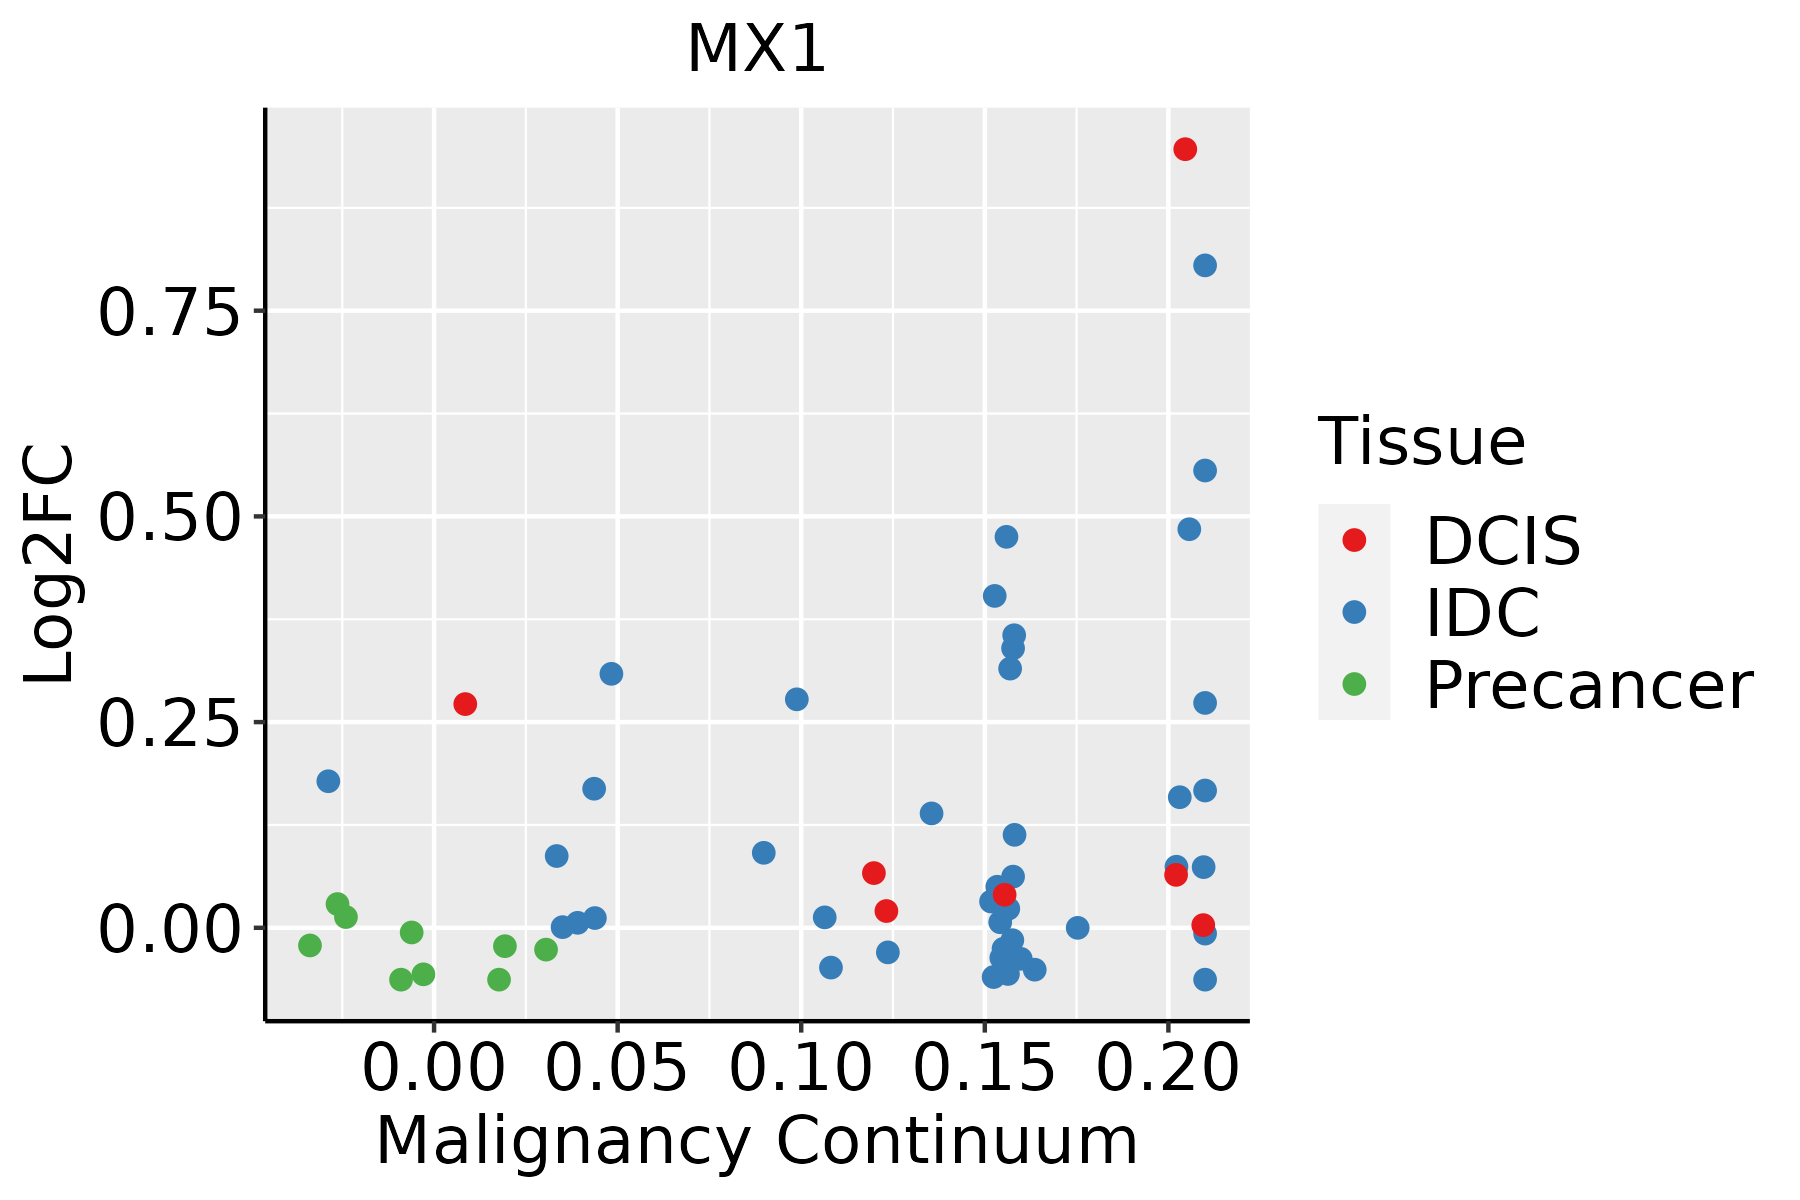 | IDC: Invasive ductal carcinoma |
| DCIS: Ductal carcinoma in situ |
| Precancer(BRCA1-mut): Precancerous lesion from BRCA1 mutation carriers |
| Cervix |  | CC: Cervix cancer |
| HSIL_HPV: HPV-infected high-grade squamous intraepithelial lesions |
| N_HPV: HPV-infected normal cervix |
| Colorectum (GSE201348) |  | FAP: Familial adenomatous polyposis |
| CRC: Colorectal cancer |
| Colorectum (HTA11) |  | AD: Adenomas |
| SER: Sessile serrated lesions |
| MSI-H: Microsatellite-high colorectal cancer |
| MSS: Microsatellite stable colorectal cancer |
| Esophagus | 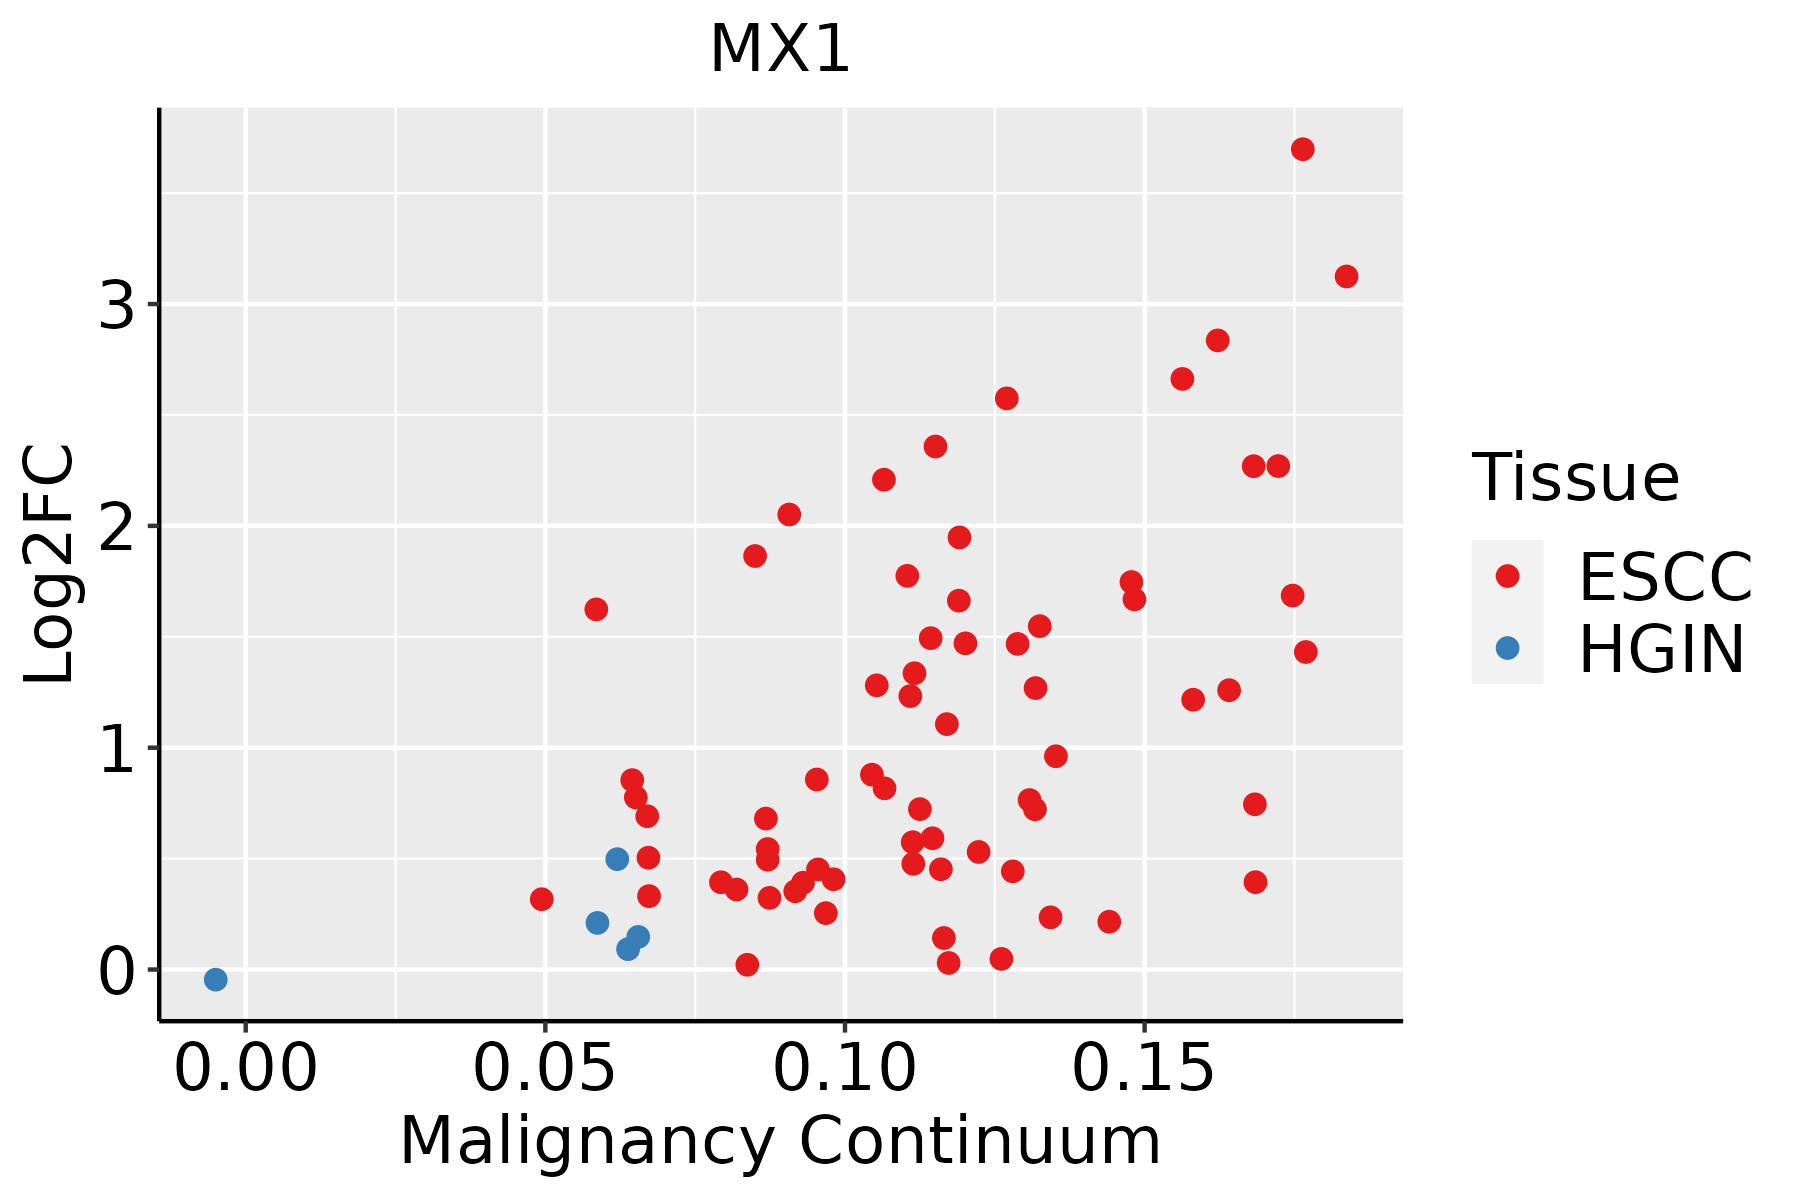 | ESCC: Esophageal squamous cell carcinoma |
| HGIN: High-grade intraepithelial neoplasias |
| LGIN: Low-grade intraepithelial neoplasias |
| Liver |  | HCC: Hepatocellular carcinoma |
| NAFLD: Non-alcoholic fatty liver disease |
| Oral Cavity |  | EOLP: Erosive Oral lichen planus |
| LP: leukoplakia |
| NEOLP: Non-erosive oral lichen planus |
| OSCC: Oral squamous cell carcinoma |
| Skin |  | AK: Actinic keratosis |
| cSCC: Cutaneous squamous cell carcinoma |
| SCCIS:squamous cell carcinoma in situ |
| Thyroid | 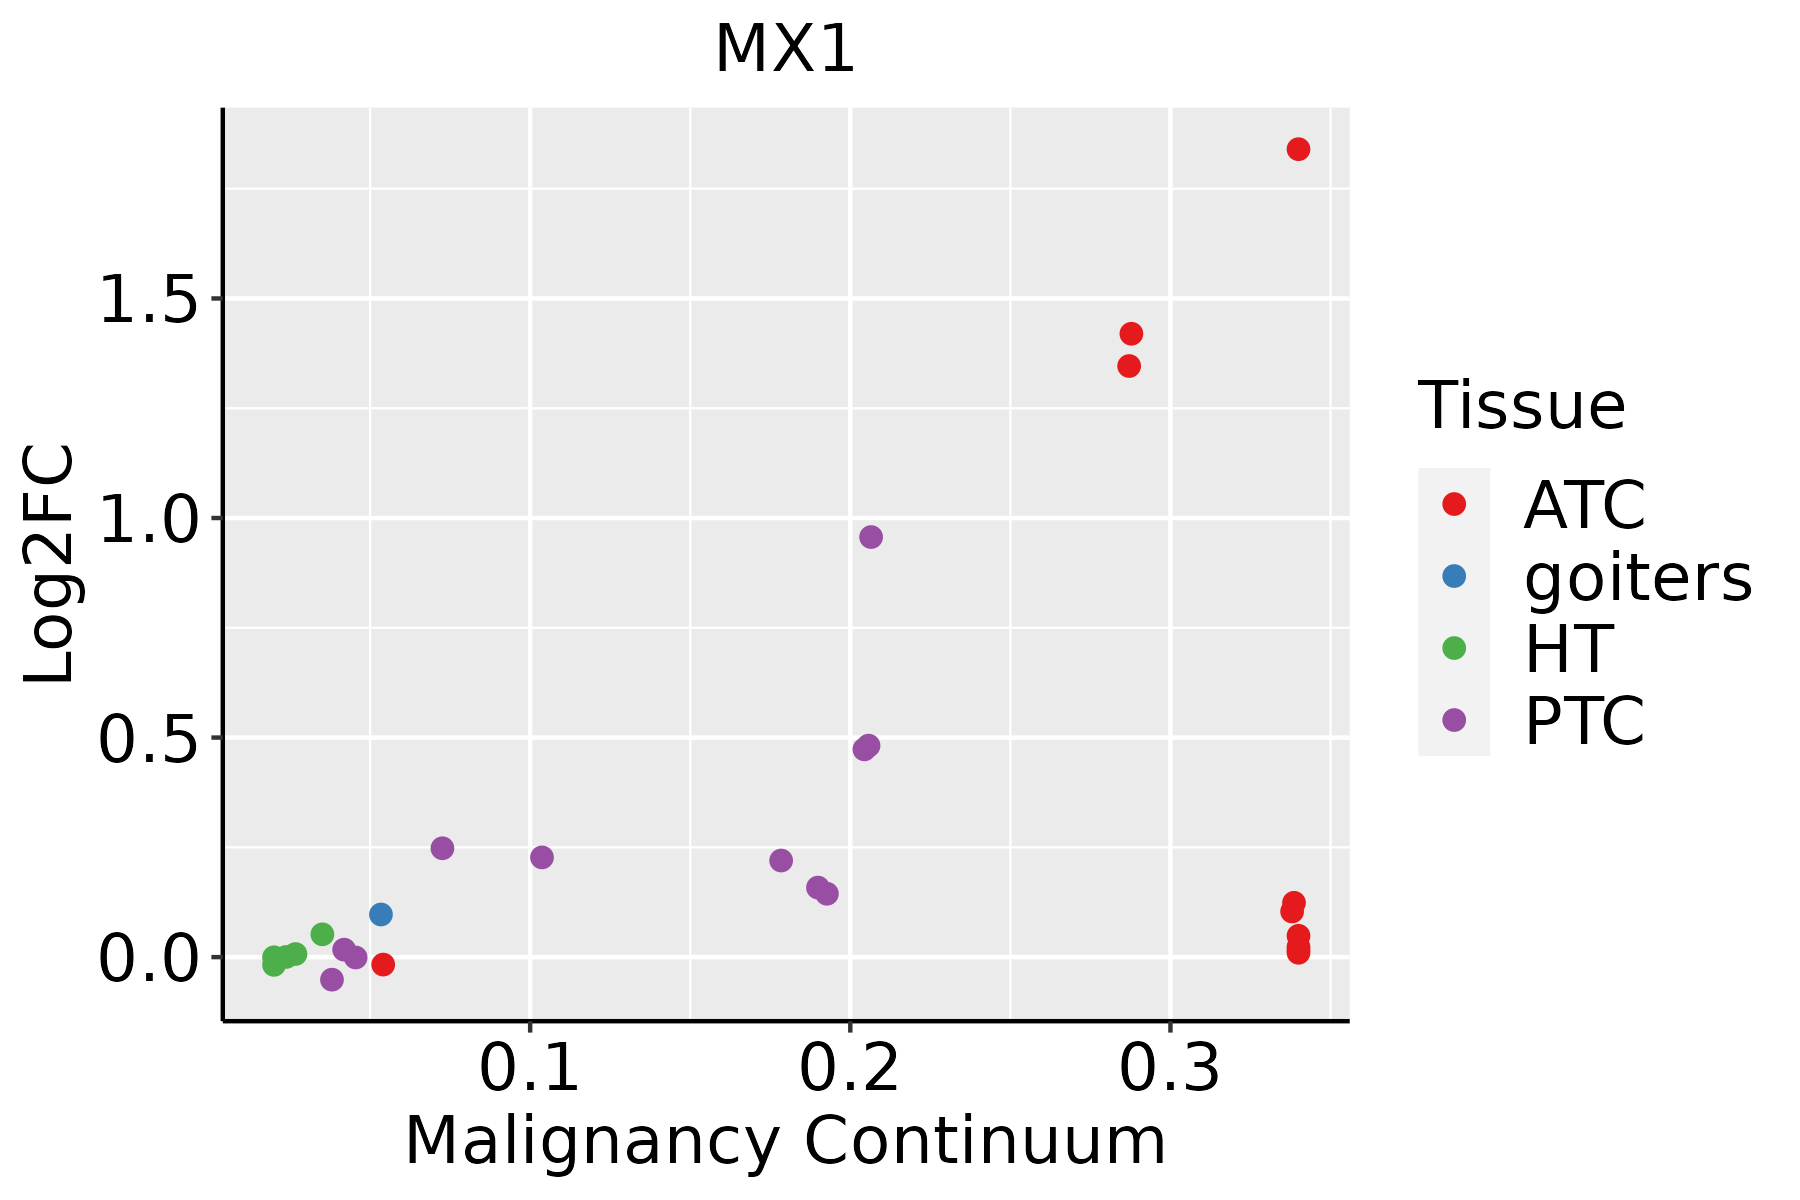 | ATC: Anaplastic thyroid cancer |
| HT: Hashimoto's thyroiditis |
| PTC: Papillary thyroid cancer |
| GO ID | Tissue | Disease Stage | Description | Gene Ratio | Bg Ratio | pvalue | p.adjust | Count |
| GO:001603214 | Breast | IDC | viral process | 75/1434 | 415/18723 | 1.98e-12 | 4.02e-10 | 75 |
| GO:001905814 | Breast | IDC | viral life cycle | 61/1434 | 317/18723 | 1.61e-11 | 2.77e-09 | 61 |
| GO:001907914 | Breast | IDC | viral genome replication | 32/1434 | 131/18723 | 2.82e-09 | 2.46e-07 | 32 |
| GO:005079214 | Breast | IDC | regulation of viral process | 36/1434 | 164/18723 | 6.55e-09 | 5.03e-07 | 36 |
| GO:190390014 | Breast | IDC | regulation of viral life cycle | 30/1434 | 148/18723 | 7.25e-07 | 3.35e-05 | 30 |
| GO:004506913 | Breast | IDC | regulation of viral genome replication | 20/1434 | 85/18723 | 4.77e-06 | 1.63e-04 | 20 |
| GO:00096157 | Breast | IDC | response to virus | 47/1434 | 367/18723 | 3.53e-04 | 5.16e-03 | 47 |
| GO:004852512 | Breast | IDC | negative regulation of viral process | 17/1434 | 92/18723 | 5.58e-04 | 7.10e-03 | 17 |
| GO:00450713 | Breast | IDC | negative regulation of viral genome replication | 11/1434 | 56/18723 | 3.08e-03 | 2.61e-02 | 11 |
| GO:001603224 | Breast | DCIS | viral process | 73/1390 | 415/18723 | 3.40e-12 | 6.88e-10 | 73 |
| GO:001905824 | Breast | DCIS | viral life cycle | 59/1390 | 317/18723 | 4.05e-11 | 5.74e-09 | 59 |
| GO:001907923 | Breast | DCIS | viral genome replication | 30/1390 | 131/18723 | 2.12e-08 | 1.45e-06 | 30 |
| GO:005079222 | Breast | DCIS | regulation of viral process | 34/1390 | 164/18723 | 3.58e-08 | 2.30e-06 | 34 |
| GO:190390022 | Breast | DCIS | regulation of viral life cycle | 28/1390 | 148/18723 | 3.79e-06 | 1.16e-04 | 28 |
| GO:004506923 | Breast | DCIS | regulation of viral genome replication | 18/1390 | 85/18723 | 4.23e-05 | 8.98e-04 | 18 |
| GO:000961512 | Breast | DCIS | response to virus | 45/1390 | 367/18723 | 6.16e-04 | 7.82e-03 | 45 |
| GO:004852521 | Breast | DCIS | negative regulation of viral process | 15/1390 | 92/18723 | 3.07e-03 | 2.61e-02 | 15 |
| GO:001603210 | Cervix | CC | viral process | 109/2311 | 415/18723 | 5.40e-15 | 6.46e-12 | 109 |
| GO:001905810 | Cervix | CC | viral life cycle | 87/2311 | 317/18723 | 2.20e-13 | 1.20e-10 | 87 |
| GO:001907910 | Cervix | CC | viral genome replication | 35/2311 | 131/18723 | 6.11e-06 | 1.49e-04 | 35 |
| Pathway ID | Tissue | Disease Stage | Description | Gene Ratio | Bg Ratio | pvalue | p.adjust | qvalue | Count |
| hsa0517124 | Breast | IDC | Coronavirus disease - COVID-19 | 86/867 | 232/8465 | 1.50e-28 | 9.72e-27 | 7.27e-27 | 86 |
| hsa0517134 | Breast | IDC | Coronavirus disease - COVID-19 | 86/867 | 232/8465 | 1.50e-28 | 9.72e-27 | 7.27e-27 | 86 |
| hsa0517144 | Breast | DCIS | Coronavirus disease - COVID-19 | 86/846 | 232/8465 | 2.42e-29 | 1.56e-27 | 1.15e-27 | 86 |
| hsa0517154 | Breast | DCIS | Coronavirus disease - COVID-19 | 86/846 | 232/8465 | 2.42e-29 | 1.56e-27 | 1.15e-27 | 86 |
| hsa0517120 | Cervix | CC | Coronavirus disease - COVID-19 | 111/1267 | 232/8465 | 1.82e-33 | 5.90e-31 | 3.49e-31 | 111 |
| hsa051657 | Cervix | CC | Human papillomavirus infection | 74/1267 | 331/8465 | 1.70e-04 | 1.02e-03 | 6.03e-04 | 74 |
| hsa0516414 | Cervix | CC | Influenza A | 43/1267 | 171/8465 | 3.03e-04 | 1.64e-03 | 9.68e-04 | 43 |
| hsa05171110 | Cervix | CC | Coronavirus disease - COVID-19 | 111/1267 | 232/8465 | 1.82e-33 | 5.90e-31 | 3.49e-31 | 111 |
| hsa0516512 | Cervix | CC | Human papillomavirus infection | 74/1267 | 331/8465 | 1.70e-04 | 1.02e-03 | 6.03e-04 | 74 |
| hsa0516415 | Cervix | CC | Influenza A | 43/1267 | 171/8465 | 3.03e-04 | 1.64e-03 | 9.68e-04 | 43 |
| hsa0517125 | Cervix | HSIL_HPV | Coronavirus disease - COVID-19 | 91/459 | 232/8465 | 2.14e-56 | 3.13e-54 | 2.53e-54 | 91 |
| hsa0516422 | Cervix | HSIL_HPV | Influenza A | 23/459 | 171/8465 | 4.65e-05 | 6.48e-04 | 5.24e-04 | 23 |
| hsa0517135 | Cervix | HSIL_HPV | Coronavirus disease - COVID-19 | 91/459 | 232/8465 | 2.14e-56 | 3.13e-54 | 2.53e-54 | 91 |
| hsa0516432 | Cervix | HSIL_HPV | Influenza A | 23/459 | 171/8465 | 4.65e-05 | 6.48e-04 | 5.24e-04 | 23 |
| hsa051714 | Colorectum | MSS | Coronavirus disease - COVID-19 | 108/1875 | 232/8465 | 6.50e-17 | 1.67e-15 | 1.03e-15 | 108 |
| hsa051602 | Colorectum | MSS | Hepatitis C | 52/1875 | 157/8465 | 9.29e-04 | 5.58e-03 | 3.42e-03 | 52 |
| hsa03250 | Colorectum | MSS | Viral life cycle - HIV-1 | 23/1875 | 63/8465 | 6.55e-03 | 2.64e-02 | 1.62e-02 | 23 |
| hsa051715 | Colorectum | MSS | Coronavirus disease - COVID-19 | 108/1875 | 232/8465 | 6.50e-17 | 1.67e-15 | 1.03e-15 | 108 |
| hsa051603 | Colorectum | MSS | Hepatitis C | 52/1875 | 157/8465 | 9.29e-04 | 5.58e-03 | 3.42e-03 | 52 |
| hsa032501 | Colorectum | MSS | Viral life cycle - HIV-1 | 23/1875 | 63/8465 | 6.55e-03 | 2.64e-02 | 1.62e-02 | 23 |
| Hugo Symbol | Variant Class | Variant Classification | dbSNP RS | HGVSc | HGVSp | HGVSp Short | SWISSPROT | BIOTYPE | SIFT | PolyPhen | Tumor Sample Barcode | Tissue | Histology | Sex | Age | Stage | Therapy Types | Drugs | Outcome |
| MX1 | SNV | Missense_Mutation | rs375569357 | c.401N>T | p.Ser134Leu | p.S134L | P20591 | protein_coding | tolerated(0.17) | benign(0.005) | TCGA-AN-A046-01 | Breast | breast invasive carcinoma | Female | >=65 | I/II | Unknown | Unknown | SD |
| MX1 | SNV | Missense_Mutation | novel | c.1502C>A | p.Thr501Asn | p.T501N | P20591 | protein_coding | deleterious(0.02) | benign(0.393) | TCGA-AN-A0FX-01 | Breast | breast invasive carcinoma | Female | <65 | I/II | Unknown | Unknown | SD |
| MX1 | SNV | Missense_Mutation | novel | c.1864N>C | p.Asp622His | p.D622H | P20591 | protein_coding | deleterious(0) | probably_damaging(0.965) | TCGA-B6-A0I1-01 | Breast | breast invasive carcinoma | Female | >=65 | I/II | Unknown | Unknown | PD |
| MX1 | SNV | Missense_Mutation | novel | c.1435A>G | p.Met479Val | p.M479V | P20591 | protein_coding | tolerated(0.1) | benign(0.156) | TCGA-BH-A0DO-01 | Breast | breast invasive carcinoma | Female | >=65 | I/II | Unknown | Unknown | SD |
| MX1 | SNV | Missense_Mutation | | c.262N>C | p.Glu88Gln | p.E88Q | P20591 | protein_coding | deleterious(0) | probably_damaging(1) | TCGA-C8-A12Z-01 | Breast | breast invasive carcinoma | Female | <65 | I/II | Chemotherapy | 5-fluorouracil | CR |
| MX1 | SNV | Missense_Mutation | novel | c.1722N>A | p.Met574Ile | p.M574I | P20591 | protein_coding | tolerated(0.97) | benign(0.003) | TCGA-HN-A2NL-01 | Breast | breast invasive carcinoma | Female | <65 | I/II | Chemotherapy | cyclophosphamide | SD |
| MX1 | insertion | In_Frame_Ins | novel | c.495_496insGACCTGGTGAATTGGACACTCTGGGGC | p.Glu165_Ile166insAspLeuValAsnTrpThrLeuTrpGly | p.E165_I166insDLVNWTLWG | P20591 | protein_coding | | | TCGA-A8-A09D-01 | Breast | breast invasive carcinoma | Female | <65 | I/II | Chemotherapy | doxorubicin | CR |
| MX1 | insertion | Frame_Shift_Ins | novel | c.190_191insC | p.Val64AlafsTer56 | p.V64Afs*56 | P20591 | protein_coding | | | TCGA-BH-A0AY-01 | Breast | breast invasive carcinoma | Female | <65 | I/II | Chemotherapy | | SD |
| MX1 | insertion | Frame_Shift_Ins | novel | c.191_192insACCTAGTGAGTGCCTCCATTTTGAGACATTAG | p.Glu65ProfsTer49 | p.E65Pfs*49 | P20591 | protein_coding | | | TCGA-BH-A0AY-01 | Breast | breast invasive carcinoma | Female | <65 | I/II | Chemotherapy | | SD |
| MX1 | SNV | Missense_Mutation | | c.700G>C | p.Glu234Gln | p.E234Q | P20591 | protein_coding | tolerated(0.07) | possibly_damaging(0.718) | TCGA-C5-A1BI-01 | Cervix | cervical & endocervical cancer | Female | <65 | III/IV | Chemotherapy | cisplatin | SD |


