
|
|||||
|
 | |
| |
| |
| |
| |
| |
|
Gene: MVD |
Gene summary for MVD |
| Gene information | Species | Human | Gene symbol | MVD | Gene ID | 4597 |
| Gene name | mevalonate diphosphate decarboxylase | |
| Gene Alias | FP17780 | |
| Cytomap | 16q24.2 | |
| Gene Type | protein-coding | GO ID | GO:0006066 | UniProtAcc | P53602 |
Top |
Malignant transformation analysis |
| Identification of the aberrant gene expression in precancerous and cancerous lesions by comparing the gene expression of stem-like cells in diseased tissues with normal stem cells |
| Entrez ID | Symbol | Replicates | Species | Organ | Tissue | Adj P-value | Log2FC | Malignancy |
| 4597 | MVD | LZE4T | Human | Esophagus | ESCC | 3.21e-07 | 1.43e-01 | 0.0811 |
| 4597 | MVD | LZE5T | Human | Esophagus | ESCC | 1.90e-02 | 2.21e-01 | 0.0514 |
| 4597 | MVD | LZE7T | Human | Esophagus | ESCC | 1.03e-04 | 4.76e-01 | 0.0667 |
| 4597 | MVD | LZE8T | Human | Esophagus | ESCC | 3.06e-06 | 9.64e-02 | 0.067 |
| 4597 | MVD | LZE20T | Human | Esophagus | ESCC | 2.98e-02 | 8.26e-02 | 0.0662 |
| 4597 | MVD | LZE22T | Human | Esophagus | ESCC | 1.55e-02 | 2.21e-01 | 0.068 |
| 4597 | MVD | LZE24T | Human | Esophagus | ESCC | 1.44e-14 | 2.64e-01 | 0.0596 |
| 4597 | MVD | LZE21T | Human | Esophagus | ESCC | 3.36e-06 | 3.06e-01 | 0.0655 |
| 4597 | MVD | P1T-E | Human | Esophagus | ESCC | 8.67e-11 | 3.72e-01 | 0.0875 |
| 4597 | MVD | P2T-E | Human | Esophagus | ESCC | 2.59e-10 | 1.39e-01 | 0.1177 |
| 4597 | MVD | P4T-E | Human | Esophagus | ESCC | 4.05e-22 | 5.75e-01 | 0.1323 |
| 4597 | MVD | P5T-E | Human | Esophagus | ESCC | 2.56e-24 | 5.50e-01 | 0.1327 |
| 4597 | MVD | P8T-E | Human | Esophagus | ESCC | 7.11e-13 | 2.00e-01 | 0.0889 |
| 4597 | MVD | P9T-E | Human | Esophagus | ESCC | 2.65e-10 | 1.56e-01 | 0.1131 |
| 4597 | MVD | P10T-E | Human | Esophagus | ESCC | 7.19e-32 | 8.29e-01 | 0.116 |
| 4597 | MVD | P11T-E | Human | Esophagus | ESCC | 2.12e-13 | 4.55e-01 | 0.1426 |
| 4597 | MVD | P12T-E | Human | Esophagus | ESCC | 1.46e-16 | 3.21e-01 | 0.1122 |
| 4597 | MVD | P15T-E | Human | Esophagus | ESCC | 8.79e-19 | 3.89e-01 | 0.1149 |
| 4597 | MVD | P16T-E | Human | Esophagus | ESCC | 7.54e-09 | 1.19e-01 | 0.1153 |
| 4597 | MVD | P17T-E | Human | Esophagus | ESCC | 1.55e-09 | 2.85e-01 | 0.1278 |
| Page: 1 2 3 4 5 |
| Tissue | Expression Dynamics | Abbreviation |
| Esophagus | 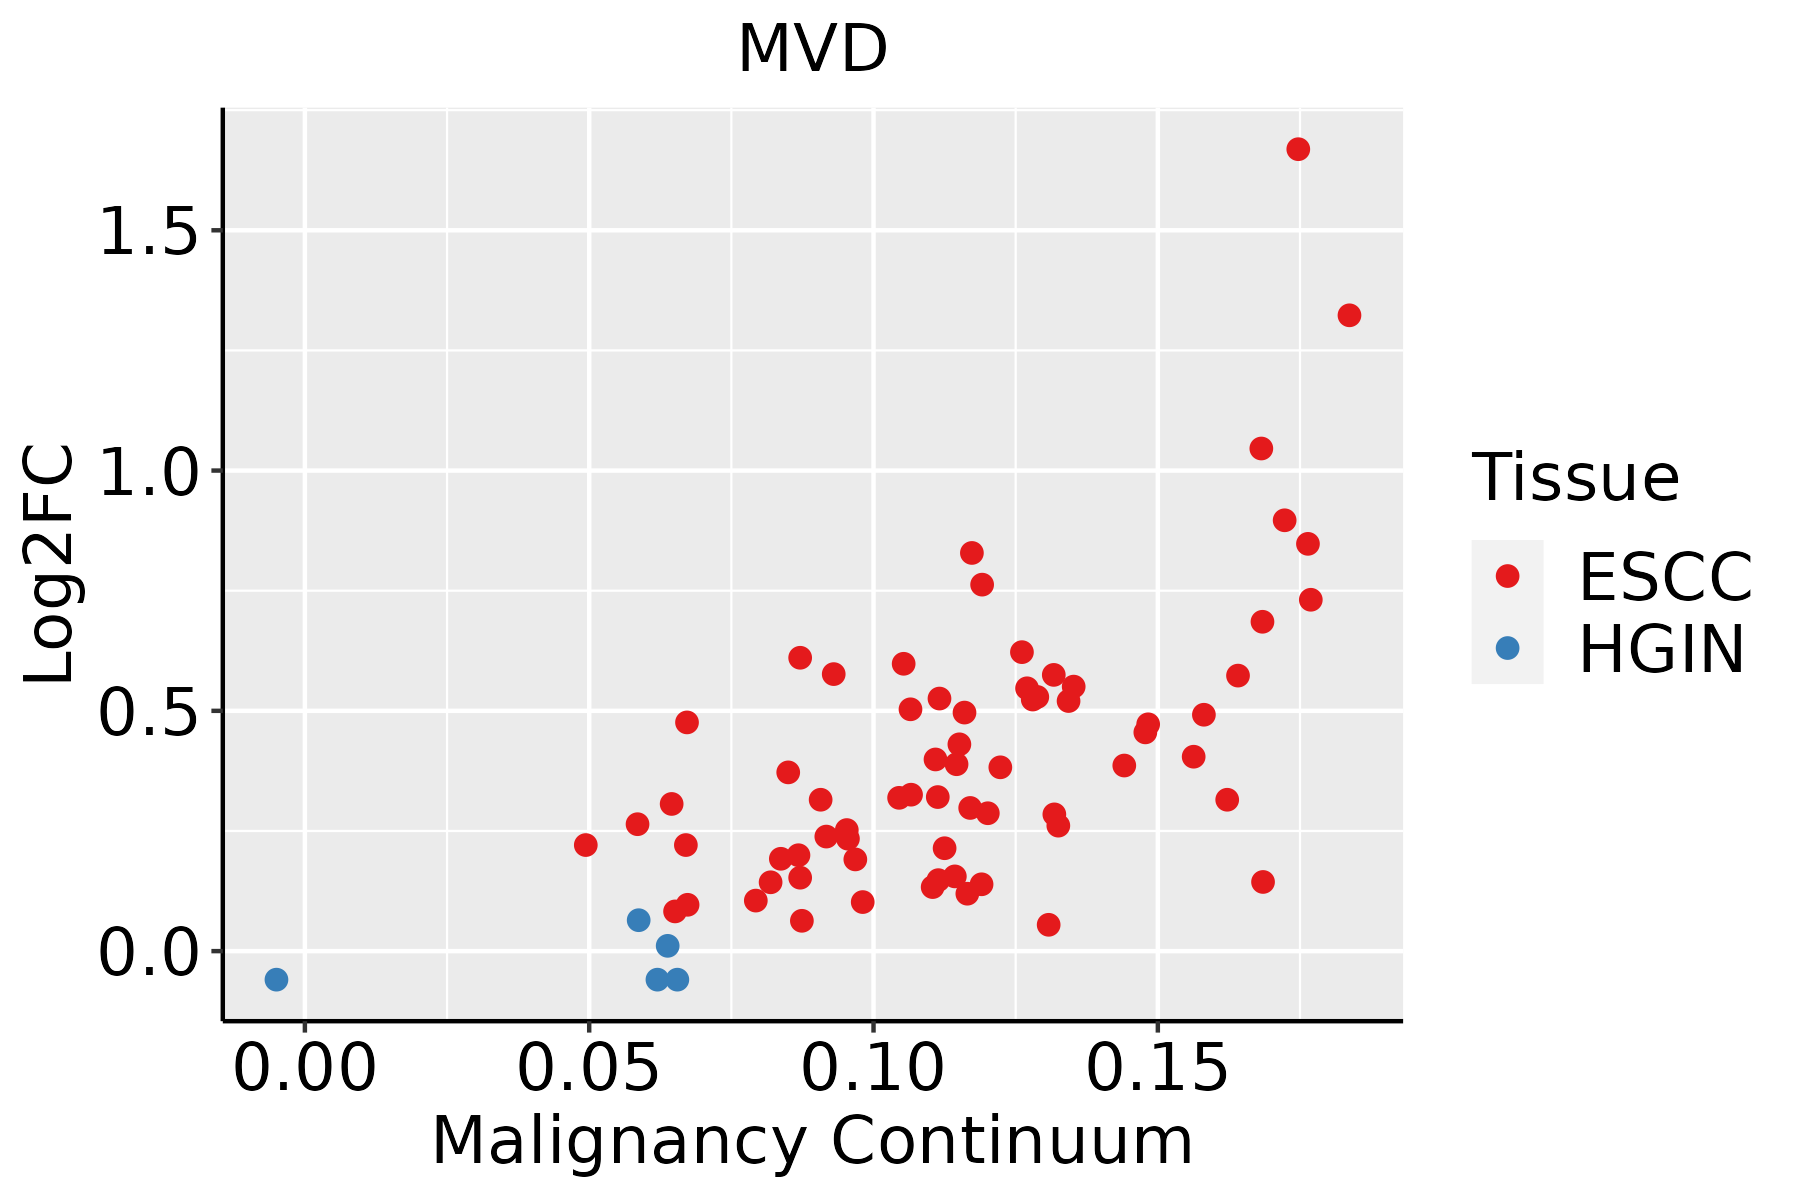 | ESCC: Esophageal squamous cell carcinoma |
| HGIN: High-grade intraepithelial neoplasias | ||
| LGIN: Low-grade intraepithelial neoplasias | ||
| Liver | 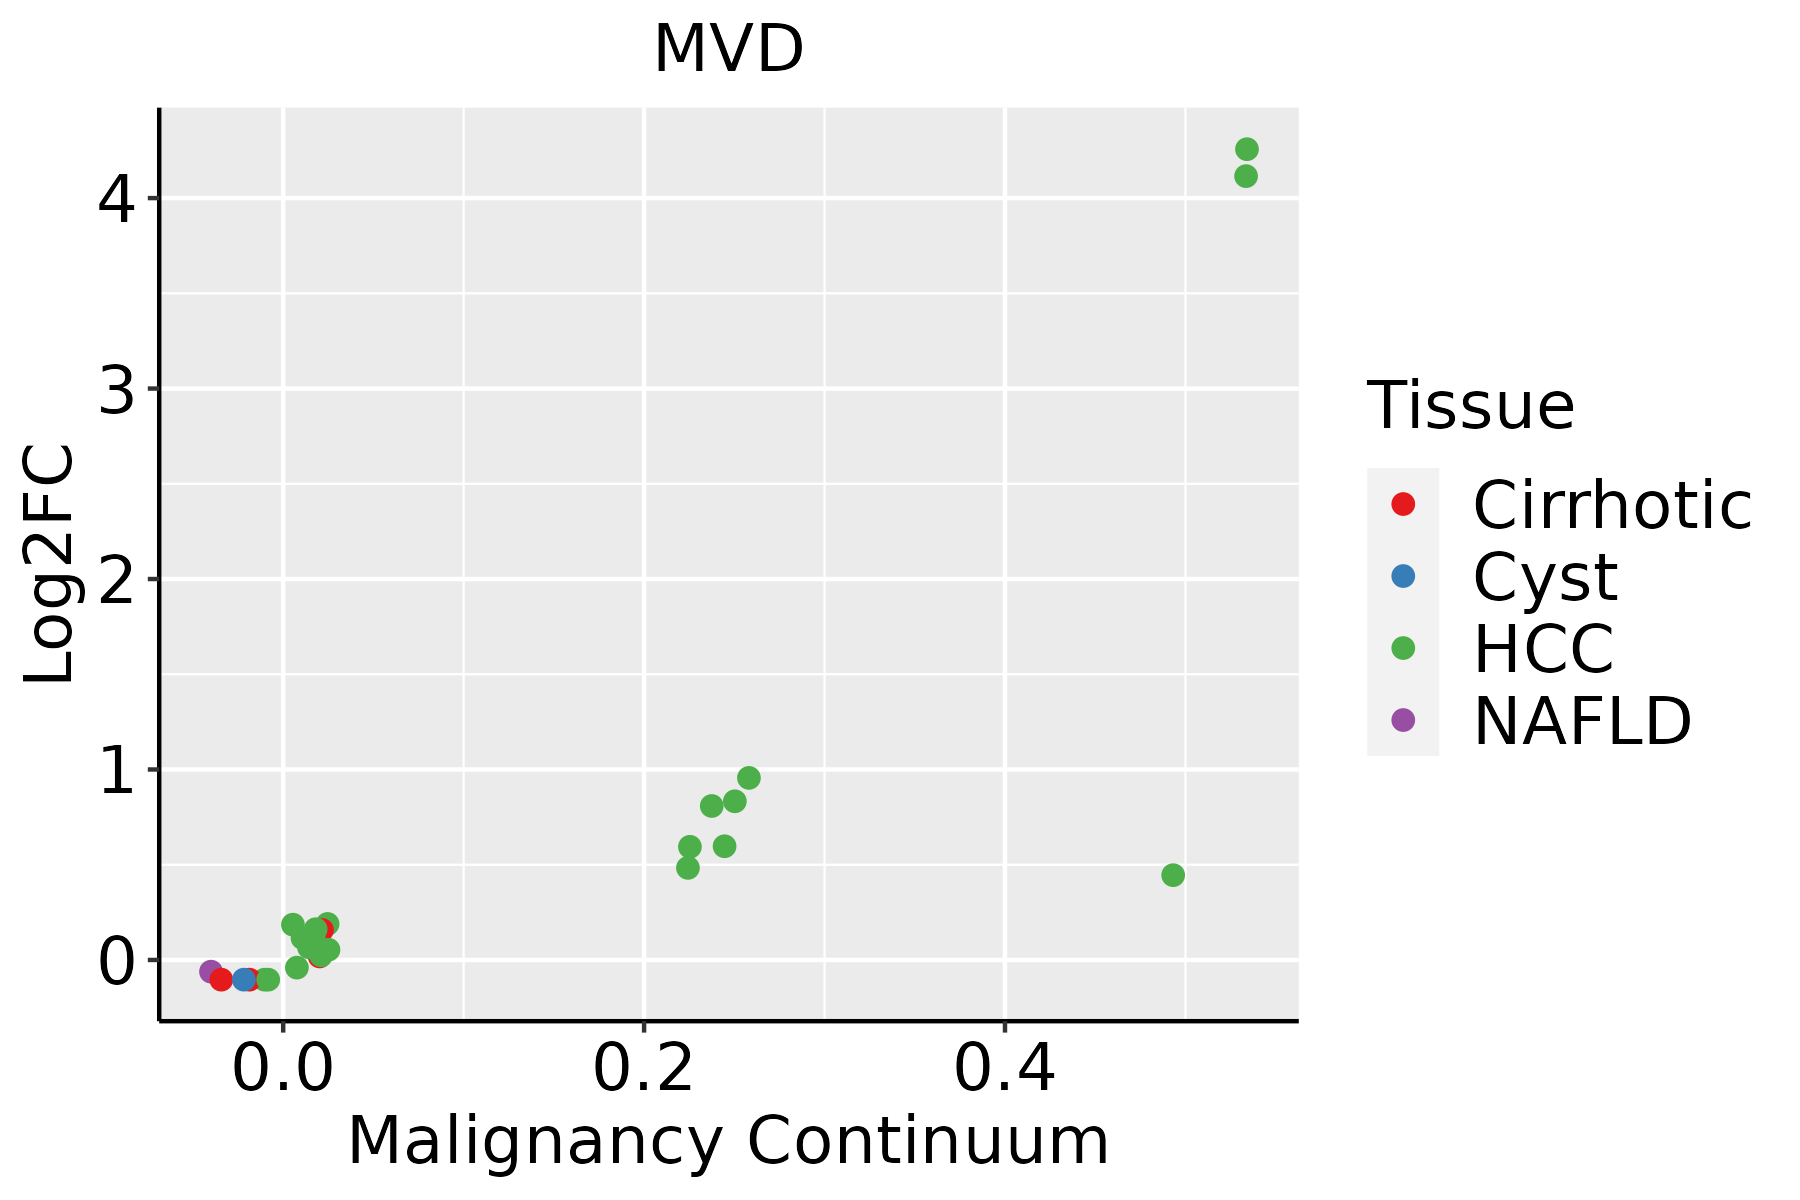 | HCC: Hepatocellular carcinoma |
| NAFLD: Non-alcoholic fatty liver disease | ||
| Oral Cavity | 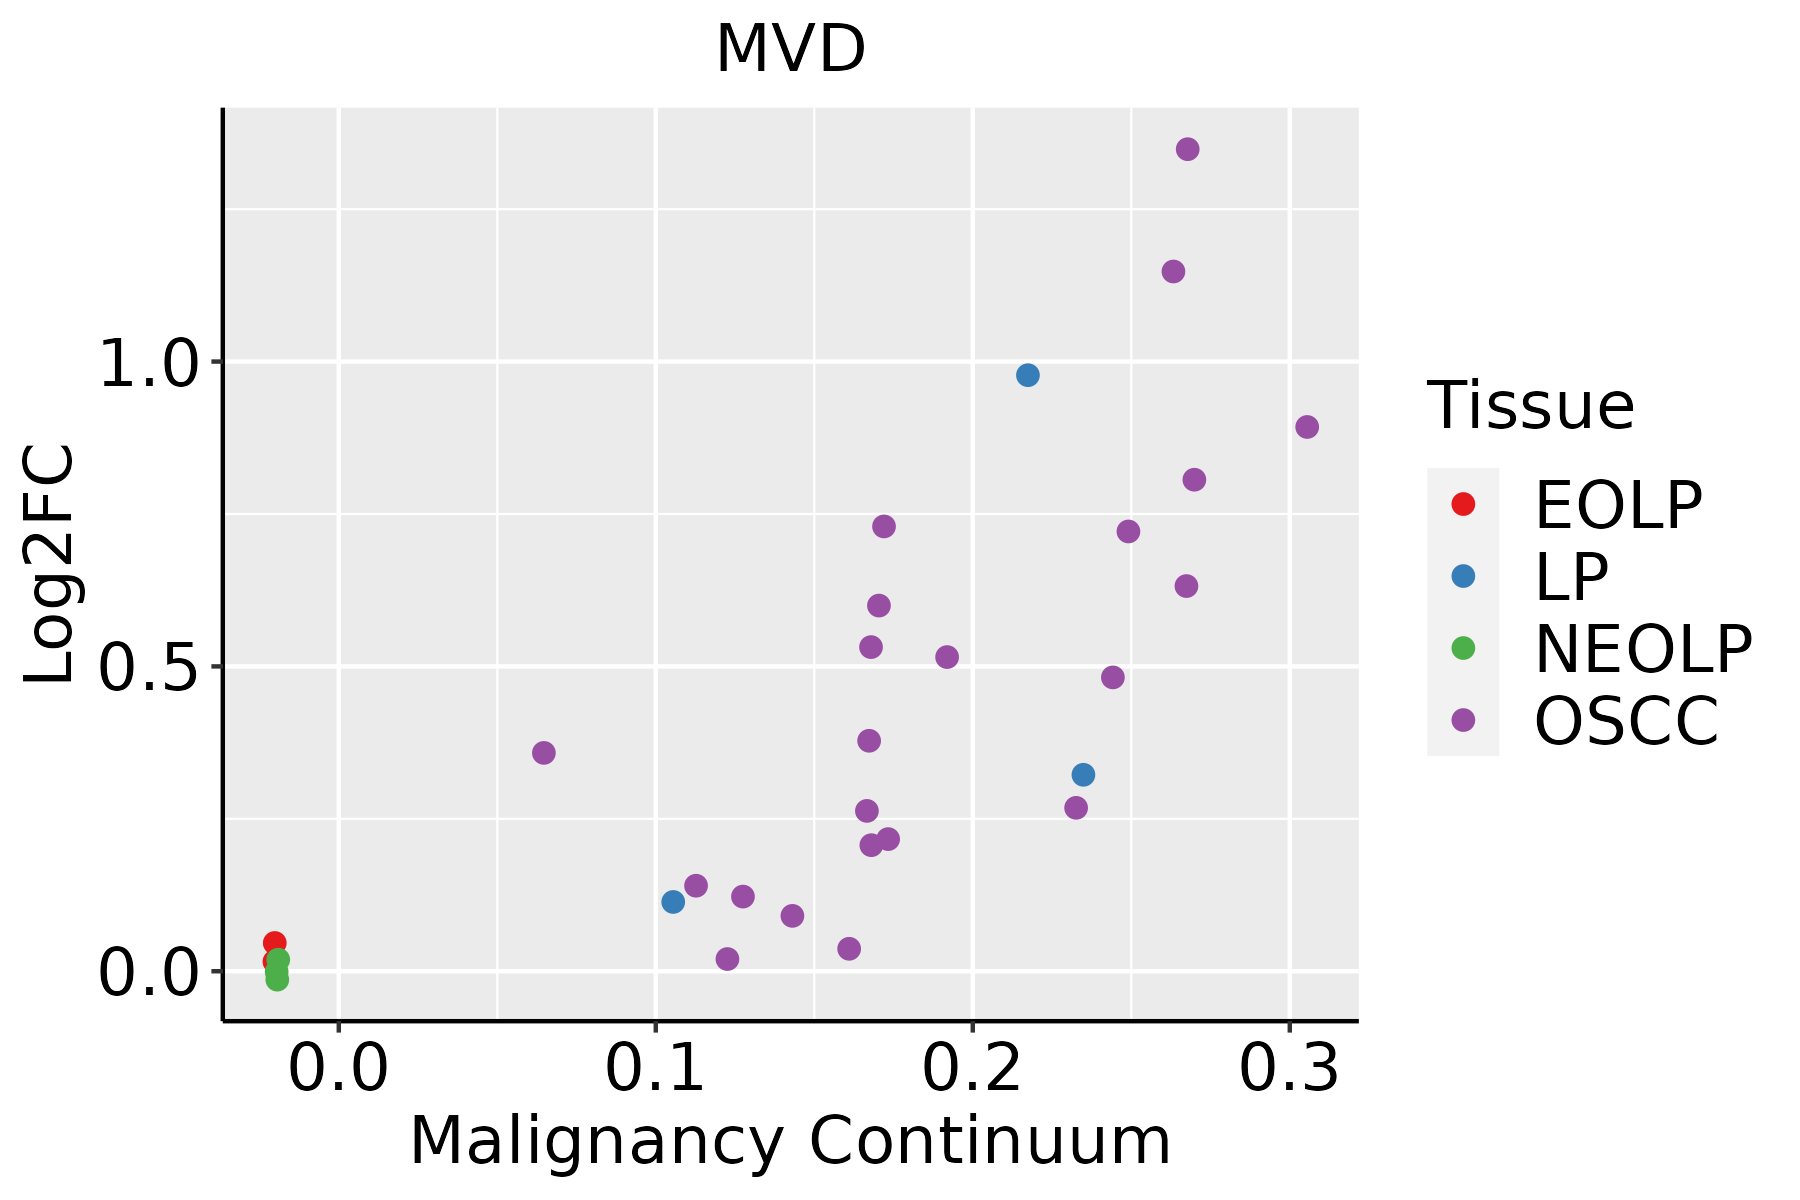 | EOLP: Erosive Oral lichen planus |
| LP: leukoplakia | ||
| NEOLP: Non-erosive oral lichen planus | ||
| OSCC: Oral squamous cell carcinoma | ||
| Skin | 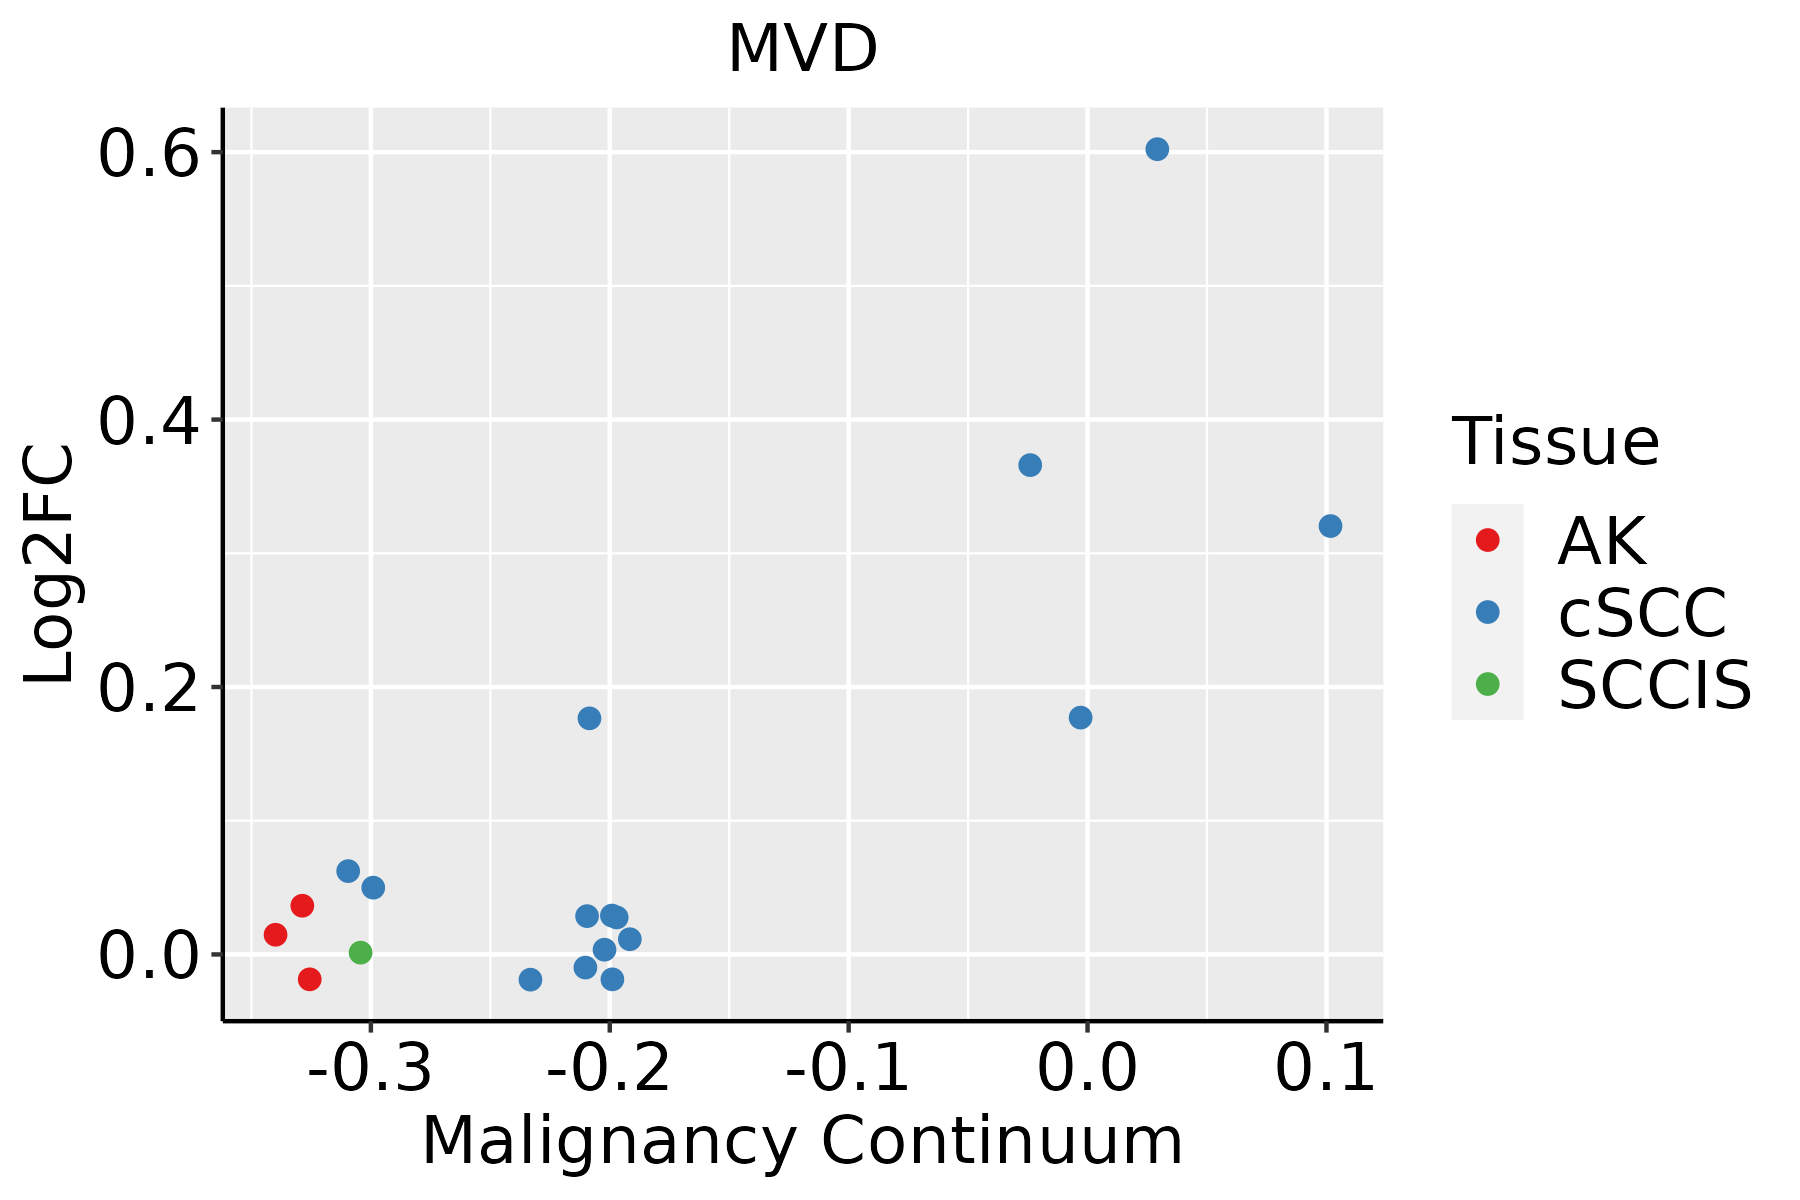 | AK: Actinic keratosis |
| cSCC: Cutaneous squamous cell carcinoma | ||
| SCCIS:squamous cell carcinoma in situ |
| ∗log2FC in expression of this searched gene in stem-like cells from each diseased tissue sample relative to stem-like cells in normal samples in each tissue plotted against the malignancy continuum. Samples are colored based on if they are from different disease stage. |
Top |
Malignant transformation related pathway analysis |
| Find out the enriched GO biological processes and KEGG pathways involved in transition from healthy to precancer to cancer |
| Tissue | Disease Stage | Enriched GO biological Processes |
| Colorectum | AD |  |
| Colorectum | SER |  |
| Colorectum | MSS |  |
| Colorectum | MSI-H |  |
| Colorectum | FAP |  |
| ∗Top 15 enriched GO BP terms are showed in the bar plot of each disease state in each tissue. Each row represents a significant GO biological process which is colored according to the -log10(p.adjust). |
| Page: 1 2 3 4 5 6 7 8 9 |
| GO ID | Tissue | Disease Stage | Description | Gene Ratio | Bg Ratio | pvalue | p.adjust | Count |
| GO:00086544 | Esophagus | ESCC | phospholipid biosynthetic process | 162/8552 | 253/18723 | 2.59e-09 | 5.73e-08 | 162 |
| GO:0006753110 | Esophagus | ESCC | nucleoside phosphate metabolic process | 288/8552 | 497/18723 | 1.80e-08 | 3.50e-07 | 288 |
| GO:0019693111 | Esophagus | ESCC | ribose phosphate metabolic process | 234/8552 | 396/18723 | 4.24e-08 | 7.76e-07 | 234 |
| GO:0009117111 | Esophagus | ESCC | nucleotide metabolic process | 282/8552 | 489/18723 | 4.70e-08 | 8.50e-07 | 282 |
| GO:00067906 | Esophagus | ESCC | sulfur compound metabolic process | 201/8552 | 339/18723 | 2.64e-07 | 3.94e-06 | 201 |
| GO:0009259111 | Esophagus | ESCC | ribonucleotide metabolic process | 224/8552 | 385/18723 | 4.41e-07 | 6.00e-06 | 224 |
| GO:0072521111 | Esophagus | ESCC | purine-containing compound metabolic process | 238/8552 | 416/18723 | 1.20e-06 | 1.49e-05 | 238 |
| GO:0009150111 | Esophagus | ESCC | purine ribonucleotide metabolic process | 213/8552 | 368/18723 | 1.40e-06 | 1.69e-05 | 213 |
| GO:0006163111 | Esophagus | ESCC | purine nucleotide metabolic process | 226/8552 | 396/18723 | 2.81e-06 | 3.21e-05 | 226 |
| GO:00066446 | Esophagus | ESCC | phospholipid metabolic process | 218/8552 | 383/18723 | 5.37e-06 | 5.59e-05 | 218 |
| GO:00060668 | Esophagus | ESCC | alcohol metabolic process | 202/8552 | 353/18723 | 7.32e-06 | 7.26e-05 | 202 |
| GO:00161263 | Esophagus | ESCC | sterol biosynthetic process | 46/8552 | 64/18723 | 1.91e-05 | 1.67e-04 | 46 |
| GO:00066953 | Esophagus | ESCC | cholesterol biosynthetic process | 41/8552 | 57/18723 | 5.25e-05 | 4.06e-04 | 41 |
| GO:19026533 | Esophagus | ESCC | secondary alcohol biosynthetic process | 41/8552 | 57/18723 | 5.25e-05 | 4.06e-04 | 41 |
| GO:19026524 | Esophagus | ESCC | secondary alcohol metabolic process | 87/8552 | 147/18723 | 6.58e-04 | 3.50e-03 | 87 |
| GO:00338655 | Esophagus | ESCC | nucleoside bisphosphate metabolic process | 77/8552 | 128/18723 | 6.71e-04 | 3.55e-03 | 77 |
| GO:00338755 | Esophagus | ESCC | ribonucleoside bisphosphate metabolic process | 77/8552 | 128/18723 | 6.71e-04 | 3.55e-03 | 77 |
| GO:00340325 | Esophagus | ESCC | purine nucleoside bisphosphate metabolic process | 77/8552 | 128/18723 | 6.71e-04 | 3.55e-03 | 77 |
| GO:00461653 | Esophagus | ESCC | alcohol biosynthetic process | 83/8552 | 140/18723 | 8.04e-04 | 4.16e-03 | 83 |
| GO:00082991 | Esophagus | ESCC | isoprenoid biosynthetic process | 21/8552 | 28/18723 | 1.57e-03 | 7.33e-03 | 21 |
| Page: 1 2 3 4 5 6 7 |
| Pathway ID | Tissue | Disease Stage | Description | Gene Ratio | Bg Ratio | pvalue | p.adjust | qvalue | Count |
| hsa009005 | Esophagus | ESCC | Terpenoid backbone biosynthesis | 20/4205 | 23/8465 | 2.14e-04 | 7.87e-04 | 4.03e-04 | 20 |
| hsa0090012 | Esophagus | ESCC | Terpenoid backbone biosynthesis | 20/4205 | 23/8465 | 2.14e-04 | 7.87e-04 | 4.03e-04 | 20 |
| hsa00900 | Liver | HCC | Terpenoid backbone biosynthesis | 17/4020 | 23/8465 | 9.26e-03 | 2.46e-02 | 1.37e-02 | 17 |
| hsa009001 | Liver | HCC | Terpenoid backbone biosynthesis | 17/4020 | 23/8465 | 9.26e-03 | 2.46e-02 | 1.37e-02 | 17 |
| hsa009004 | Oral cavity | OSCC | Terpenoid backbone biosynthesis | 19/3704 | 23/8465 | 1.55e-04 | 5.34e-04 | 2.72e-04 | 19 |
| hsa0090011 | Oral cavity | OSCC | Terpenoid backbone biosynthesis | 19/3704 | 23/8465 | 1.55e-04 | 5.34e-04 | 2.72e-04 | 19 |
| hsa009002 | Oral cavity | LP | Terpenoid backbone biosynthesis | 12/2418 | 23/8465 | 1.43e-02 | 4.59e-02 | 2.96e-02 | 12 |
| hsa009003 | Oral cavity | LP | Terpenoid backbone biosynthesis | 12/2418 | 23/8465 | 1.43e-02 | 4.59e-02 | 2.96e-02 | 12 |
| Page: 1 |
Top |
Cell-cell communication analysis |
| Identification of potential cell-cell interactions between two cell types and their ligand-receptor pairs for different disease states |
| Ligand | Receptor | LRpair | Pathway | Tissue | Disease Stage |
| Page: 1 |
Top |
Single-cell gene regulatory network inference analysis |
| Find out the significant the regulons (TFs) and the target genes of each regulon across cell types for different disease states |
| TF | Cell Type | Tissue | Disease Stage | Target Gene | RSS | Regulon Activity |
| ∗The dot plots of a searched regulon are shown for all cell subpopulations in each disease state of each tissue based on the regulon specific score inferred using pySCENIC and by calculating the average expression. |
| Page: 1 |
Top |
Somatic mutation of malignant transformation related genes |
| Annotation of somatic variants for genes involved in malignant transformation |
| Hugo Symbol | Variant Class | Variant Classification | dbSNP RS | HGVSc | HGVSp | HGVSp Short | SWISSPROT | BIOTYPE | SIFT | PolyPhen | Tumor Sample Barcode | Tissue | Histology | Sex | Age | Stage | Therapy Types | Drugs | Outcome |
| MVD | SNV | Missense_Mutation | novel | c.148A>C | p.Thr50Pro | p.T50P | P53602 | protein_coding | deleterious(0) | possibly_damaging(0.908) | TCGA-BH-A18G-01 | Breast | breast invasive carcinoma | Female | >=65 | I/II | Unknown | Unknown | SD |
| MVD | SNV | Missense_Mutation | rs756895566 | c.496G>A | p.Gly166Ser | p.G166S | P53602 | protein_coding | deleterious(0) | probably_damaging(1) | TCGA-2W-A8YY-01 | Cervix | cervical & endocervical cancer | Female | <65 | I/II | Chemotherapy | cisplatin | CR |
| MVD | SNV | Missense_Mutation | c.1186N>T | p.Pro396Ser | p.P396S | P53602 | protein_coding | deleterious(0) | probably_damaging(0.973) | TCGA-AA-3519-01 | Colorectum | colon adenocarcinoma | Male | <65 | III/IV | Unknown | Unknown | SD | |
| MVD | SNV | Missense_Mutation | novel | c.874N>G | p.Asn292Asp | p.N292D | P53602 | protein_coding | deleterious(0) | possibly_damaging(0.833) | TCGA-AA-A00N-01 | Colorectum | colon adenocarcinoma | Male | >=65 | I/II | Unknown | Unknown | PD |
| MVD | SNV | Missense_Mutation | c.697G>A | p.Val233Met | p.V233M | P53602 | protein_coding | deleterious(0) | probably_damaging(0.924) | TCGA-CK-4951-01 | Colorectum | colon adenocarcinoma | Female | >=65 | I/II | Unknown | Unknown | PD | |
| MVD | SNV | Missense_Mutation | c.433G>C | p.Glu145Gln | p.E145Q | P53602 | protein_coding | tolerated(0.16) | benign(0.026) | TCGA-CK-4951-01 | Colorectum | colon adenocarcinoma | Female | >=65 | I/II | Unknown | Unknown | PD | |
| MVD | SNV | Missense_Mutation | c.805G>A | p.Asp269Asn | p.D269N | P53602 | protein_coding | deleterious(0) | probably_damaging(0.981) | TCGA-CM-4743-01 | Colorectum | colon adenocarcinoma | Male | >=65 | I/II | Chemotherapy | capecitabine | SD | |
| MVD | SNV | Missense_Mutation | rs780694192 | c.733C>T | p.Arg245Trp | p.R245W | P53602 | protein_coding | deleterious(0.05) | benign(0.342) | TCGA-D5-6930-01 | Colorectum | colon adenocarcinoma | Male | >=65 | I/II | Unknown | Unknown | SD |
| MVD | SNV | Missense_Mutation | c.1199N>T | p.Ala400Val | p.A400V | P53602 | protein_coding | deleterious(0) | benign(0) | TCGA-G4-6320-01 | Colorectum | colon adenocarcinoma | Male | >=65 | III/IV | Chemotherapy | oxaliplatin | SD | |
| MVD | SNV | Missense_Mutation | rs769065449 | c.1159G>A | p.Ala387Thr | p.A387T | P53602 | protein_coding | tolerated(0.53) | benign(0) | TCGA-A5-A0VQ-01 | Endometrium | uterine corpus endometrioid carcinoma | Female | <65 | I/II | Chemotherapy | carboplatin | SD |
| Page: 1 2 3 |
Top |
Related drugs of malignant transformation related genes |
| Identification of chemicals and drugs interact with genes involved in malignant transfromation |
| (DGIdb 4.0) |
| Entrez ID | Symbol | Category | Interaction Types | Drug Claim Name | Drug Name | PMIDs |
| 4597 | MVD | DRUGGABLE GENOME, ENZYME | inhibitor | 135649848 | ||
| 4597 | MVD | DRUGGABLE GENOME, ENZYME | inhibitor | 249565674 | ||
| 4597 | MVD | DRUGGABLE GENOME, ENZYME | inhibitor | 135650812 | ||
| 4597 | MVD | DRUGGABLE GENOME, ENZYME | inhibitor | 135650193 | ||
| 4597 | MVD | DRUGGABLE GENOME, ENZYME | inhibitor | 249565676 |
| Page: 1 |

Copyright 2023-Present -The University of Texas Health Science Center at Houston |