
|
|||||
|
 | |
| |
| |
| |
| |
| |
|
Gene: MUM1 |
Gene summary for MUM1 |
| Gene information | Species | Human | Gene symbol | MUM1 | Gene ID | 84939 |
| Gene name | PWWP domain containing 3A, DNA repair factor | |
| Gene Alias | EXPAND1 | |
| Cytomap | 19p13.3 | |
| Gene Type | protein-coding | GO ID | GO:0006139 | UniProtAcc | J3KNX4 |
Top |
Malignant transformation analysis |
| Identification of the aberrant gene expression in precancerous and cancerous lesions by comparing the gene expression of stem-like cells in diseased tissues with normal stem cells |
| Entrez ID | Symbol | Replicates | Species | Organ | Tissue | Adj P-value | Log2FC | Malignancy |
| 84939 | MUM1 | P1T-E | Human | Esophagus | ESCC | 3.48e-15 | 5.96e-01 | 0.0875 |
| 84939 | MUM1 | P2T-E | Human | Esophagus | ESCC | 1.29e-17 | 3.56e-01 | 0.1177 |
| 84939 | MUM1 | P4T-E | Human | Esophagus | ESCC | 2.90e-24 | 4.93e-01 | 0.1323 |
| 84939 | MUM1 | P5T-E | Human | Esophagus | ESCC | 1.13e-11 | 1.39e-01 | 0.1327 |
| 84939 | MUM1 | P8T-E | Human | Esophagus | ESCC | 4.66e-13 | 2.35e-01 | 0.0889 |
| 84939 | MUM1 | P9T-E | Human | Esophagus | ESCC | 3.53e-17 | 3.73e-01 | 0.1131 |
| 84939 | MUM1 | P10T-E | Human | Esophagus | ESCC | 9.64e-30 | 5.69e-01 | 0.116 |
| 84939 | MUM1 | P11T-E | Human | Esophagus | ESCC | 4.35e-12 | 5.04e-01 | 0.1426 |
| 84939 | MUM1 | P12T-E | Human | Esophagus | ESCC | 4.82e-30 | 5.42e-01 | 0.1122 |
| 84939 | MUM1 | P15T-E | Human | Esophagus | ESCC | 1.68e-27 | 4.07e-01 | 0.1149 |
| 84939 | MUM1 | P16T-E | Human | Esophagus | ESCC | 3.41e-28 | 4.08e-01 | 0.1153 |
| 84939 | MUM1 | P17T-E | Human | Esophagus | ESCC | 1.22e-09 | 3.83e-01 | 0.1278 |
| 84939 | MUM1 | P20T-E | Human | Esophagus | ESCC | 2.00e-23 | 4.22e-01 | 0.1124 |
| 84939 | MUM1 | P21T-E | Human | Esophagus | ESCC | 8.20e-19 | 2.93e-01 | 0.1617 |
| 84939 | MUM1 | P22T-E | Human | Esophagus | ESCC | 2.38e-24 | 4.26e-01 | 0.1236 |
| 84939 | MUM1 | P23T-E | Human | Esophagus | ESCC | 2.70e-29 | 6.42e-01 | 0.108 |
| 84939 | MUM1 | P24T-E | Human | Esophagus | ESCC | 1.49e-14 | 2.45e-01 | 0.1287 |
| 84939 | MUM1 | P26T-E | Human | Esophagus | ESCC | 1.43e-24 | 4.61e-01 | 0.1276 |
| 84939 | MUM1 | P27T-E | Human | Esophagus | ESCC | 5.61e-27 | 4.42e-01 | 0.1055 |
| 84939 | MUM1 | P28T-E | Human | Esophagus | ESCC | 8.88e-31 | 5.95e-01 | 0.1149 |
| Page: 1 2 3 4 5 6 |
| Tissue | Expression Dynamics | Abbreviation |
| Esophagus |  | ESCC: Esophageal squamous cell carcinoma |
| HGIN: High-grade intraepithelial neoplasias | ||
| LGIN: Low-grade intraepithelial neoplasias | ||
| Liver | 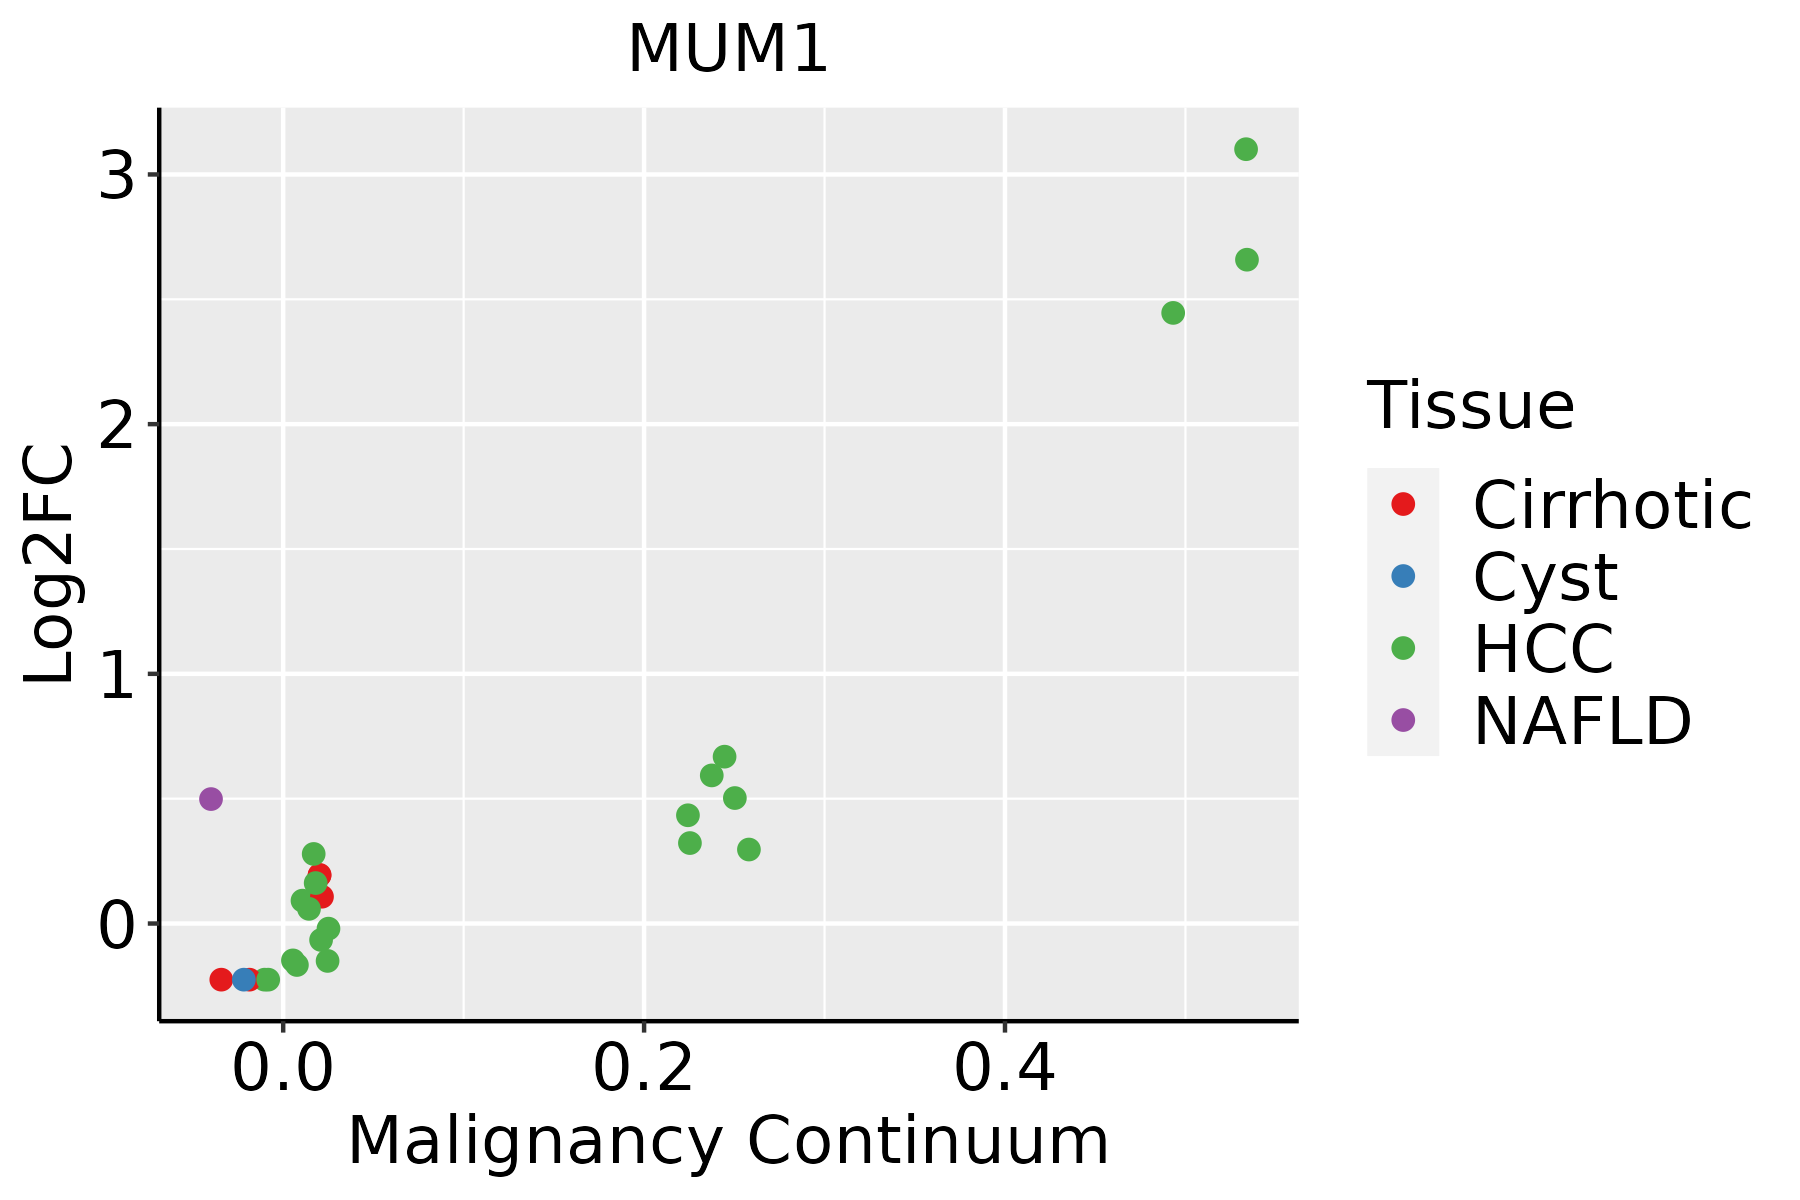 | HCC: Hepatocellular carcinoma |
| NAFLD: Non-alcoholic fatty liver disease | ||
| Oral Cavity | 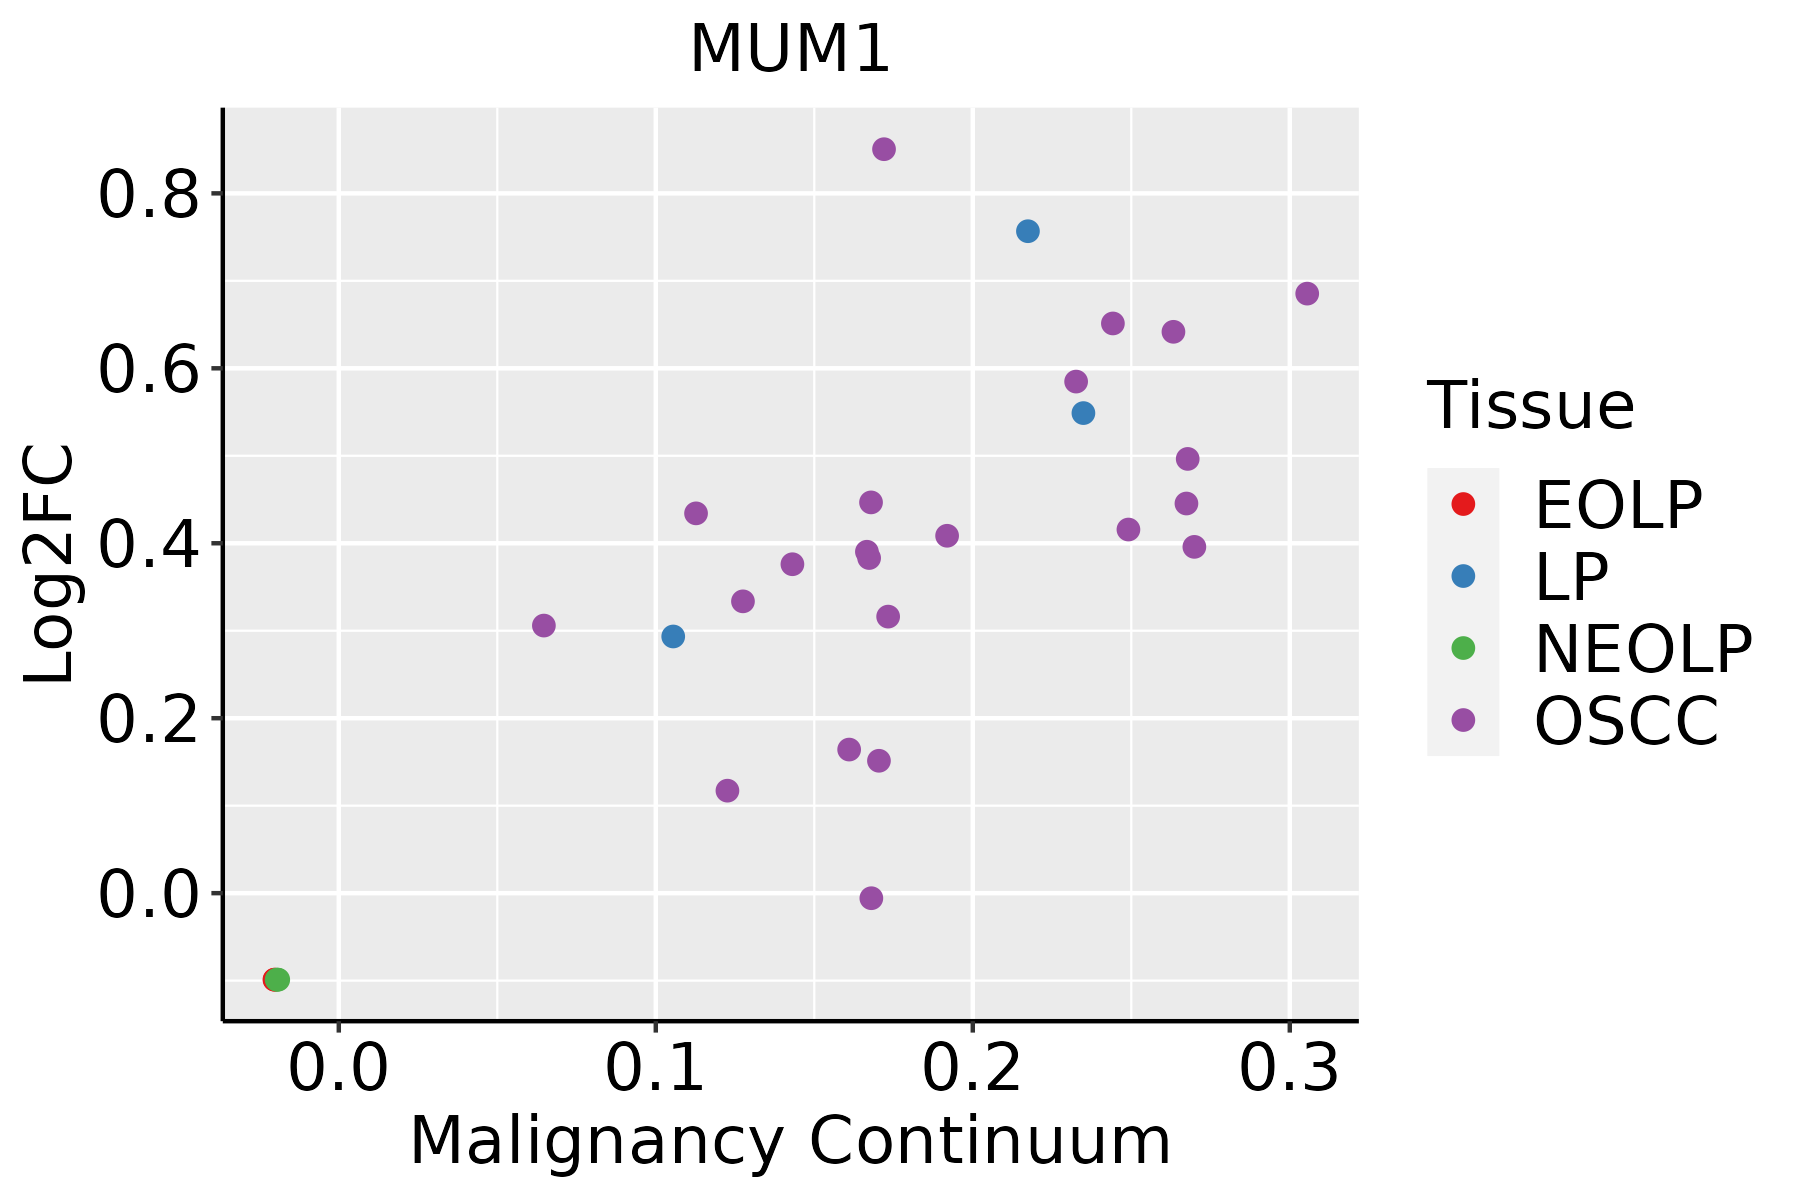 | EOLP: Erosive Oral lichen planus |
| LP: leukoplakia | ||
| NEOLP: Non-erosive oral lichen planus | ||
| OSCC: Oral squamous cell carcinoma | ||
| Prostate | 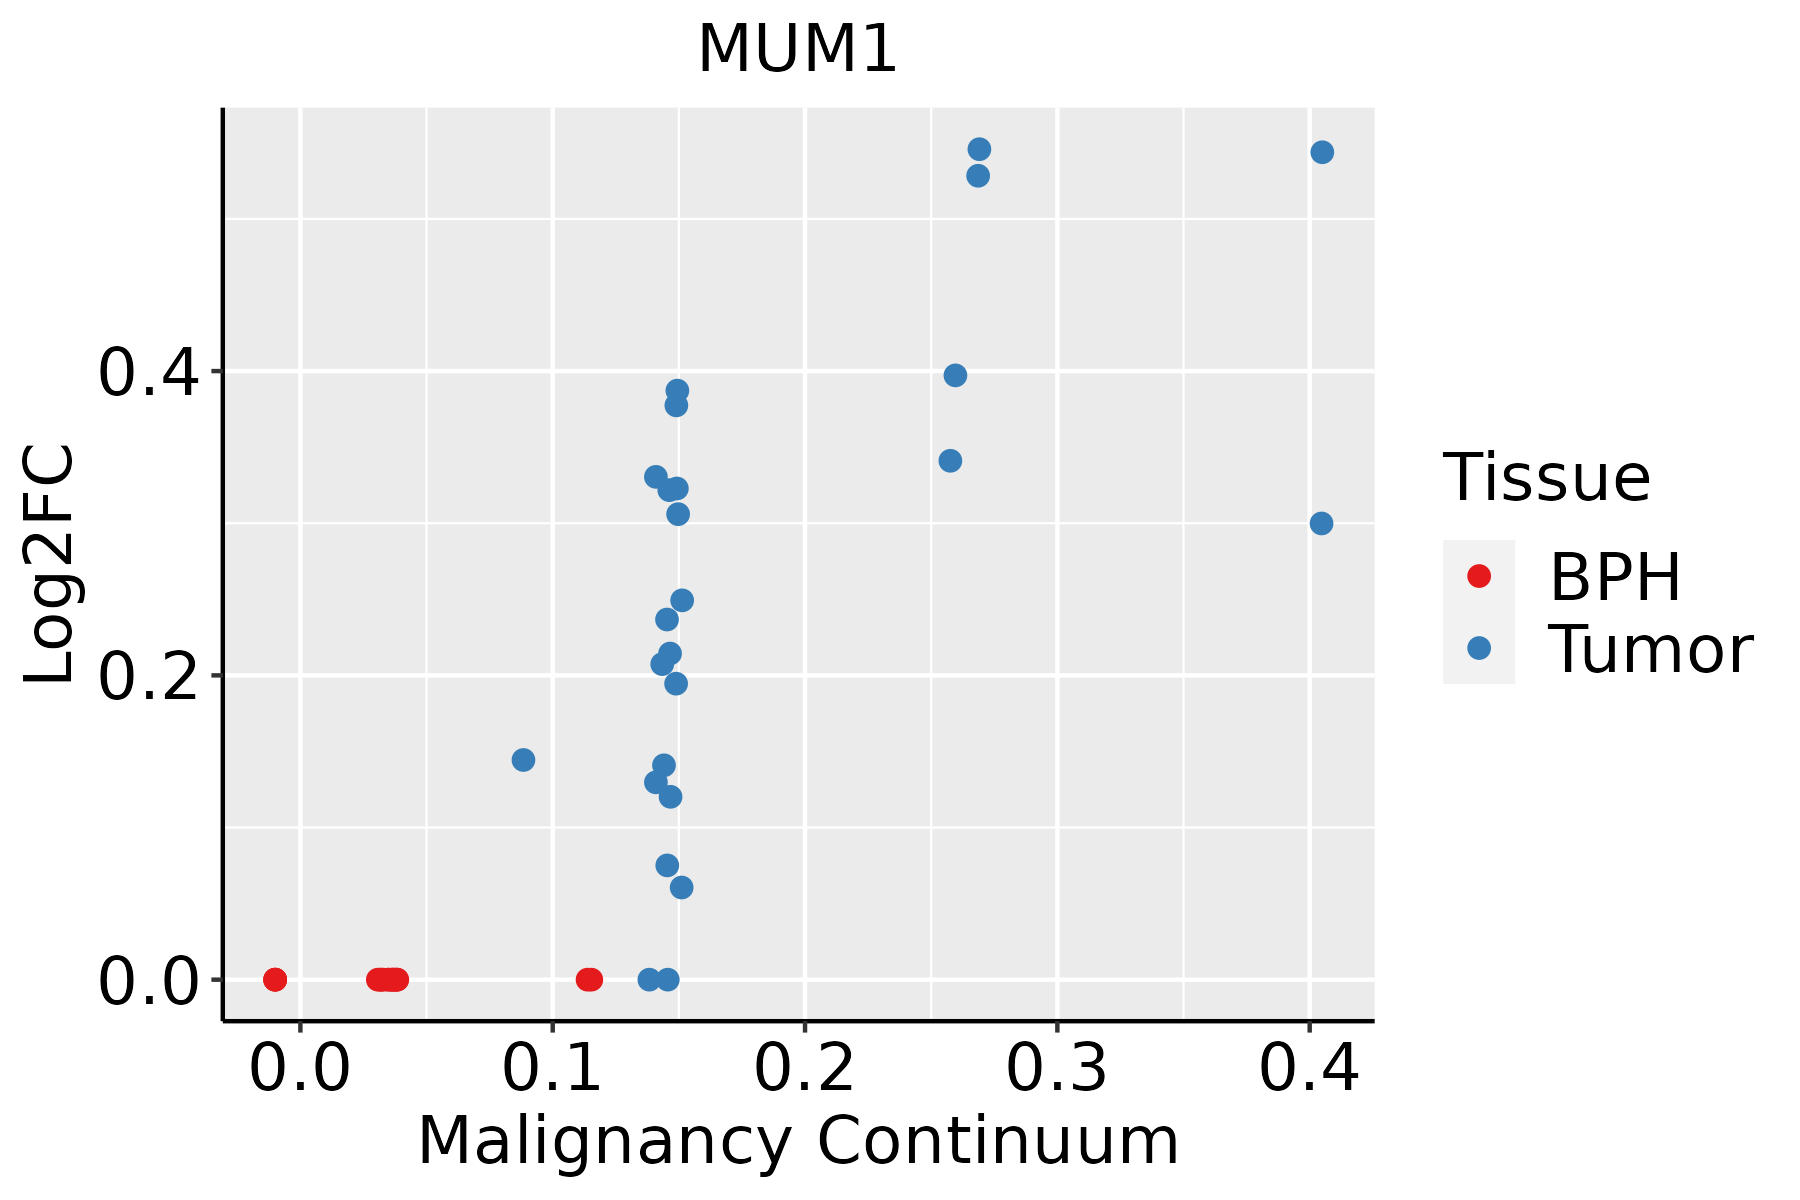 | BPH: Benign Prostatic Hyperplasia |
| Skin | 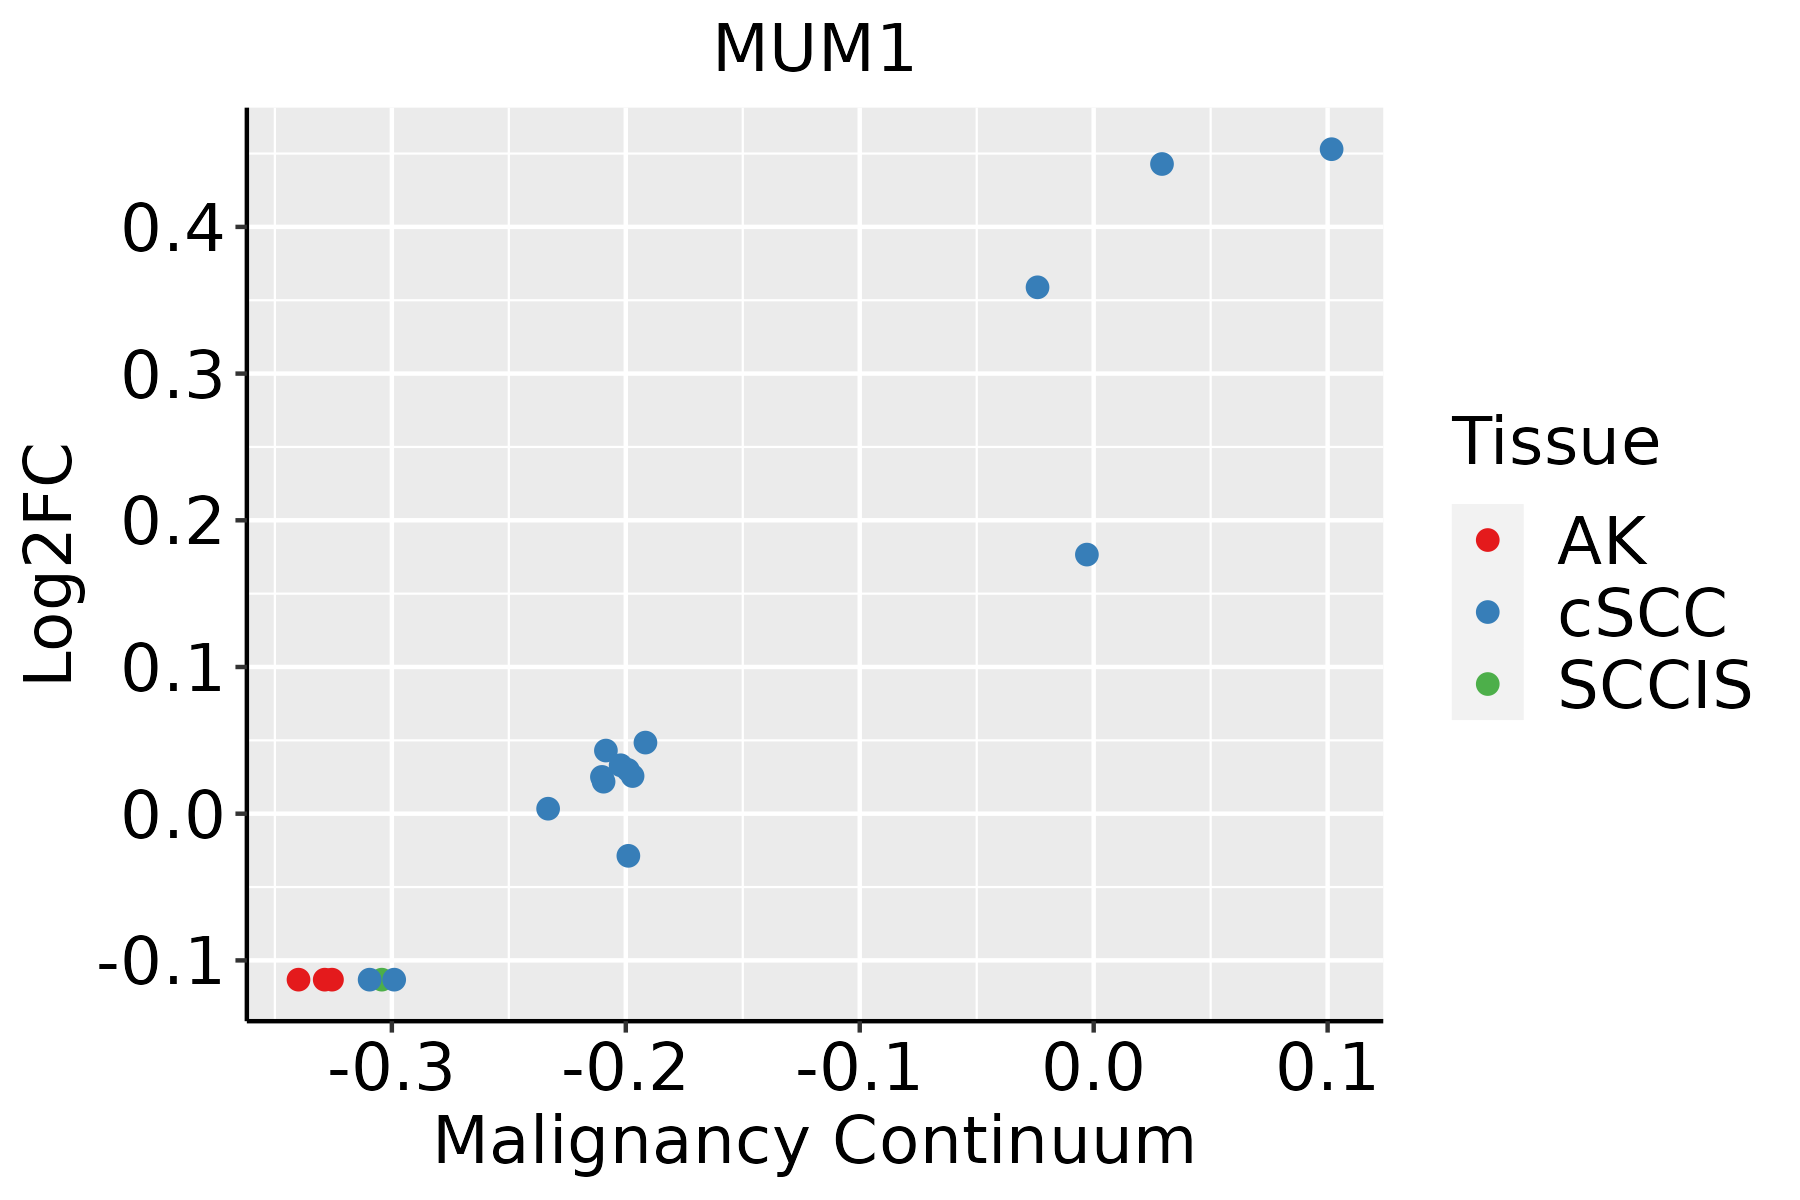 | AK: Actinic keratosis |
| cSCC: Cutaneous squamous cell carcinoma | ||
| SCCIS:squamous cell carcinoma in situ | ||
| Thyroid | 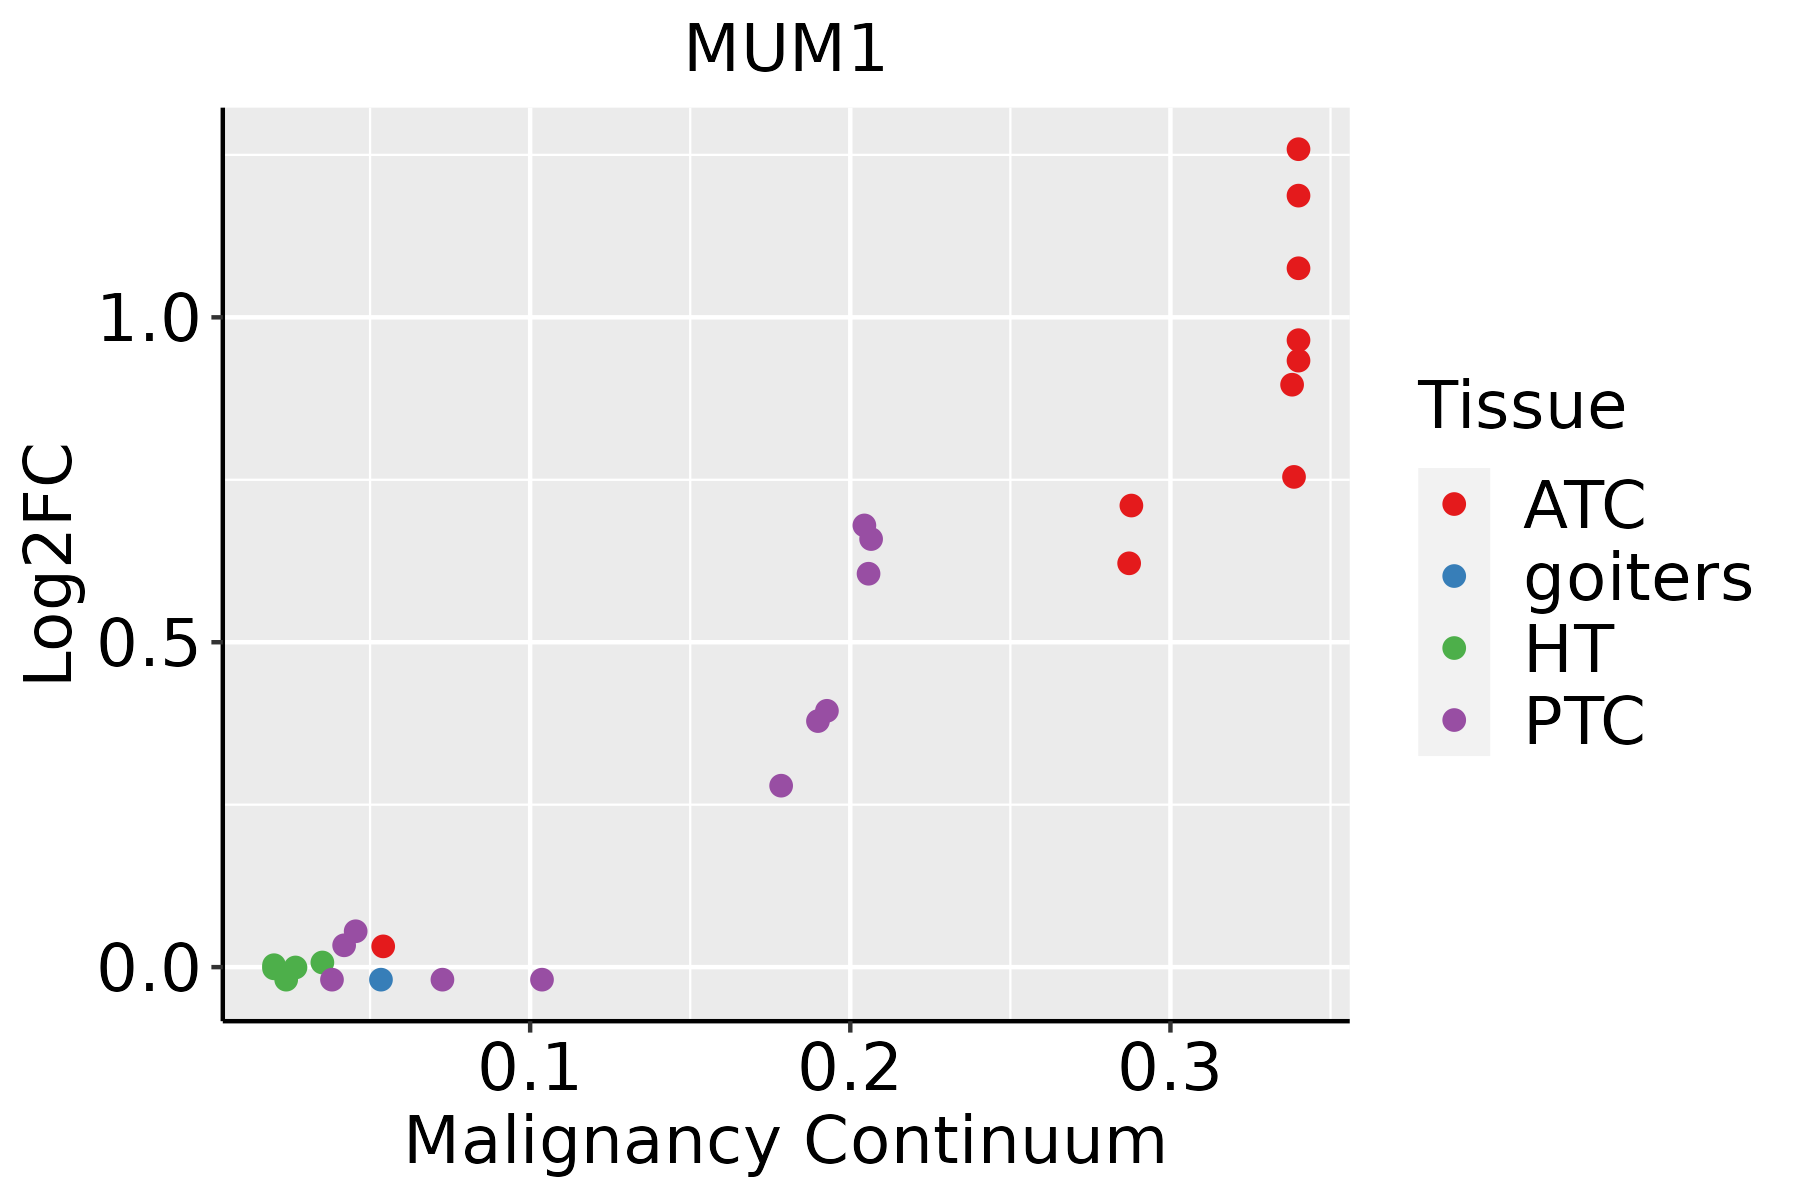 | ATC: Anaplastic thyroid cancer |
| HT: Hashimoto's thyroiditis | ||
| PTC: Papillary thyroid cancer |
| ∗log2FC in expression of this searched gene in stem-like cells from each diseased tissue sample relative to stem-like cells in normal samples in each tissue plotted against the malignancy continuum. Samples are colored based on if they are from different disease stage. |
Top |
Malignant transformation related pathway analysis |
| Find out the enriched GO biological processes and KEGG pathways involved in transition from healthy to precancer to cancer |
| Tissue | Disease Stage | Enriched GO biological Processes |
| Colorectum | AD |  |
| Colorectum | SER |  |
| Colorectum | MSS |  |
| Colorectum | MSI-H |  |
| Colorectum | FAP |  |
| ∗Top 15 enriched GO BP terms are showed in the bar plot of each disease state in each tissue. Each row represents a significant GO biological process which is colored according to the -log10(p.adjust). |
| Page: 1 2 3 4 5 6 7 8 9 |
| GO ID | Tissue | Disease Stage | Description | Gene Ratio | Bg Ratio | pvalue | p.adjust | Count |
| Page: 1 |
| Pathway ID | Tissue | Disease Stage | Description | Gene Ratio | Bg Ratio | pvalue | p.adjust | qvalue | Count |
| Page: 1 |
Top |
Cell-cell communication analysis |
| Identification of potential cell-cell interactions between two cell types and their ligand-receptor pairs for different disease states |
| Ligand | Receptor | LRpair | Pathway | Tissue | Disease Stage |
| Page: 1 |
Top |
Single-cell gene regulatory network inference analysis |
| Find out the significant the regulons (TFs) and the target genes of each regulon across cell types for different disease states |
| TF | Cell Type | Tissue | Disease Stage | Target Gene | RSS | Regulon Activity |
| ∗The dot plots of a searched regulon are shown for all cell subpopulations in each disease state of each tissue based on the regulon specific score inferred using pySCENIC and by calculating the average expression. |
| Page: 1 |
Top |
Somatic mutation of malignant transformation related genes |
| Annotation of somatic variants for genes involved in malignant transformation |
| Hugo Symbol | Variant Class | Variant Classification | dbSNP RS | HGVSc | HGVSp | HGVSp Short | SWISSPROT | BIOTYPE | SIFT | PolyPhen | Tumor Sample Barcode | Tissue | Histology | Sex | Age | Stage | Therapy Types | Drugs | Outcome |
| MUM1 | SNV | Missense_Mutation | novel | c.862N>A | p.Glu288Lys | p.E288K | protein_coding | tolerated(0.3) | benign(0.108) | TCGA-AC-A8OS-01 | Breast | breast invasive carcinoma | Female | >=65 | I/II | Unknown | Unknown | SD | |
| MUM1 | SNV | Missense_Mutation | novel | c.278N>A | p.Arg93His | p.R93H | protein_coding | deleterious(0) | probably_damaging(1) | TCGA-AN-A046-01 | Breast | breast invasive carcinoma | Female | >=65 | I/II | Unknown | Unknown | SD | |
| MUM1 | SNV | Missense_Mutation | c.137T>C | p.Leu46Pro | p.L46P | protein_coding | deleterious(0) | probably_damaging(0.997) | TCGA-AN-A04D-01 | Breast | breast invasive carcinoma | Female | <65 | I/II | Unknown | Unknown | SD | ||
| MUM1 | SNV | Missense_Mutation | rs147961437 | c.232G>A | p.Val78Ile | p.V78I | protein_coding | tolerated(0.17) | benign(0.105) | TCGA-AN-A0FW-01 | Breast | breast invasive carcinoma | Female | >=65 | III/IV | Unknown | Unknown | SD | |
| MUM1 | SNV | Missense_Mutation | c.1115N>G | p.Glu372Gly | p.E372G | protein_coding | tolerated(0.19) | benign(0) | TCGA-E9-A24A-01 | Breast | breast invasive carcinoma | Female | >=65 | I/II | Hormone Therapy | tamoxiphen | SD | ||
| MUM1 | SNV | Missense_Mutation | c.1378N>T | p.Leu460Phe | p.L460F | protein_coding | tolerated(0.41) | probably_damaging(0.976) | TCGA-EW-A1J5-01 | Breast | breast invasive carcinoma | Female | <65 | I/II | Chemotherapy | adriamycin | SD | ||
| MUM1 | insertion | In_Frame_Ins | novel | c.432_433insCAGAATTTGCCCCTAGAACCACTCCTATTC | p.Val144_Leu145insGlnAsnLeuProLeuGluProLeuLeuPhe | p.V144_L145insQNLPLEPLLF | protein_coding | TCGA-A8-A06U-01 | Breast | breast invasive carcinoma | Female | >=65 | I/II | Unknown | Unknown | SD | |||
| MUM1 | deletion | Frame_Shift_Del | novel | c.1102delN | p.Lys368SerfsTer45 | p.K368Sfs*45 | protein_coding | TCGA-D8-A27V-01 | Breast | breast invasive carcinoma | Female | <65 | I/II | Hormone Therapy | tamoxiphen | SD | |||
| MUM1 | SNV | Missense_Mutation | rs773907661 | c.308N>T | p.Ser103Leu | p.S103L | protein_coding | tolerated(0.07) | benign(0.001) | TCGA-C5-A1BK-01 | Cervix | cervical & endocervical cancer | Female | <65 | I/II | Unknown | Unknown | SD | |
| MUM1 | SNV | Missense_Mutation | c.707N>T | p.Ser236Leu | p.S236L | protein_coding | tolerated(0.16) | benign(0.14) | TCGA-C5-A1BK-01 | Cervix | cervical & endocervical cancer | Female | <65 | I/II | Unknown | Unknown | SD |
| Page: 1 2 3 4 5 6 |
Top |
Related drugs of malignant transformation related genes |
| Identification of chemicals and drugs interact with genes involved in malignant transfromation |
| (DGIdb 4.0) |
| Entrez ID | Symbol | Category | Interaction Types | Drug Claim Name | Drug Name | PMIDs |
| Page: 1 |

Copyright 2023-Present -The University of Texas Health Science Center at Houston |