
|
|||||
|
 | |
| |
| |
| |
| |
| |
|
Gene: MUC6 |
Gene summary for MUC6 |
| Gene information | Species | Human | Gene symbol | MUC6 | Gene ID | 4588 |
| Gene name | mucin 6, oligomeric mucus/gel-forming | |
| Gene Alias | MUC-6 | |
| Cytomap | 11p15.5 | |
| Gene Type | protein-coding | GO ID | GO:0001894 | UniProtAcc | Q6W4X9 |
Top |
Malignant transformation analysis |
| Identification of the aberrant gene expression in precancerous and cancerous lesions by comparing the gene expression of stem-like cells in diseased tissues with normal stem cells |
| Entrez ID | Symbol | Replicates | Species | Organ | Tissue | Adj P-value | Log2FC | Malignancy |
| 4588 | MUC6 | Pat01-B | Human | Stomach | GC | 3.44e-04 | -4.48e-01 | 0.5754 |
| 4588 | MUC6 | Pat02-B | Human | Stomach | GC | 5.94e-25 | 5.94e-01 | 0.0368 |
| 4588 | MUC6 | Pat04-B | Human | Stomach | GC | 4.74e-04 | -2.17e-01 | -0.1483 |
| 4588 | MUC6 | Pat05-B | Human | Stomach | GC | 9.30e-06 | -5.78e-02 | -0.0353 |
| 4588 | MUC6 | Pat06-B | Human | Stomach | GC | 1.07e-08 | 4.91e-02 | -0.1961 |
| 4588 | MUC6 | Pat15-B | Human | Stomach | GC | 1.26e-09 | 6.87e-01 | -0.0778 |
| 4588 | MUC6 | Pat16-B | Human | Stomach | GC | 2.44e-02 | -2.63e-01 | 0.1918 |
| 4588 | MUC6 | Pat17-B | Human | Stomach | GC | 2.16e-06 | -4.83e-01 | 0.3109 |
| 4588 | MUC6 | Pat18-B | Human | Stomach | GC | 1.27e-10 | 5.35e-01 | -0.0432 |
| 4588 | MUC6 | Pat19-B | Human | Stomach | GC | 6.86e-08 | 1.47e-01 | 0.0826 |
| 4588 | MUC6 | Pat22-B | Human | Stomach | GC | 1.05e-08 | -8.74e-02 | -0.1042 |
| 4588 | MUC6 | Pat24-B | Human | Stomach | GC | 4.82e-05 | -5.43e-02 | -0.1184 |
| 4588 | MUC6 | Pat25-A | Human | Stomach | CAG with IM | 1.44e-08 | 2.82e-01 | -0.1648 |
| 4588 | MUC6 | Pat26-A | Human | Stomach | CSG | 1.49e-25 | -7.75e-02 | -0.2402 |
| 4588 | MUC6 | CAG_2 | Human | Stomach | CAG | 2.14e-05 | 5.17e-01 | -0.2831 |
| 4588 | MUC6 | CAG_3 | Human | Stomach | CAG | 4.75e-11 | 6.43e-01 | -0.2766 |
| 4588 | MUC6 | SIM_2 | Human | Stomach | SIM | 1.55e-04 | -1.29e-02 | 0.3139 |
| 4588 | MUC6 | SIM_4 | Human | Stomach | SIM | 1.62e-06 | -5.27e-01 | 0.2664 |
| 4588 | MUC6 | EGC | Human | Stomach | GC | 7.07e-06 | -4.93e-01 | 0.1683 |
| 4588 | MUC6 | Pt1_Superficial | Human | Stomach | GC | 2.73e-05 | -5.60e-01 | 0.1036 |
| Page: 1 |
| Tissue | Expression Dynamics | Abbreviation |
| GC | 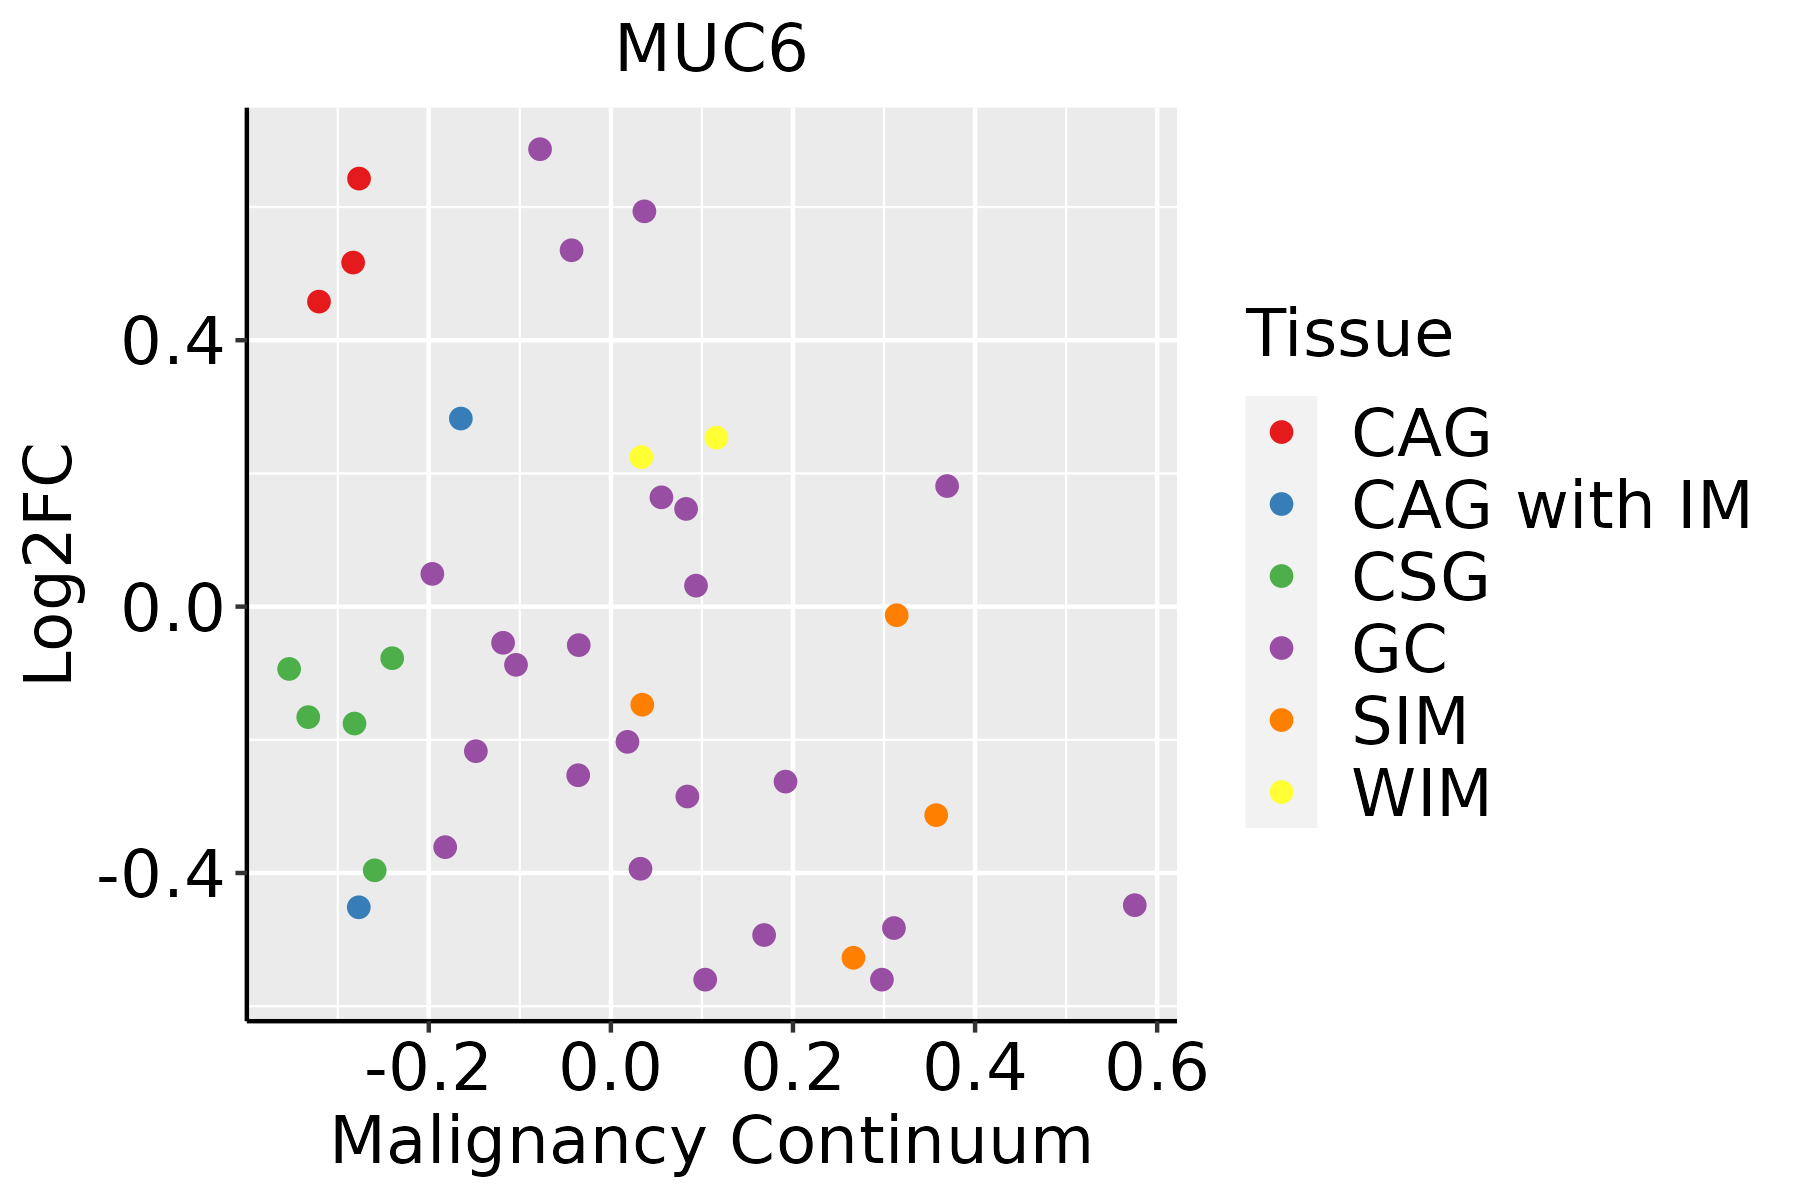 | CAG: Chronic atrophic gastritis |
| CAG with IM: Chronic atrophic gastritis with intestinal metaplasia | ||
| CSG: Chronic superficial gastritis | ||
| GC: Gastric cancer | ||
| SIM: Severe intestinal metaplasia | ||
| WIM: Wild intestinal metaplasia |
| ∗log2FC in expression of this searched gene in stem-like cells from each diseased tissue sample relative to stem-like cells in normal samples in each tissue plotted against the malignancy continuum. Samples are colored based on if they are from different disease stage. |
Top |
Malignant transformation related pathway analysis |
| Find out the enriched GO biological processes and KEGG pathways involved in transition from healthy to precancer to cancer |
| Tissue | Disease Stage | Enriched GO biological Processes |
| Colorectum | AD |  |
| Colorectum | SER |  |
| Colorectum | MSS |  |
| Colorectum | MSI-H |  |
| Colorectum | FAP |  |
| ∗Top 15 enriched GO BP terms are showed in the bar plot of each disease state in each tissue. Each row represents a significant GO biological process which is colored according to the -log10(p.adjust). |
| Page: 1 2 3 4 5 6 7 8 9 |
| GO ID | Tissue | Disease Stage | Description | Gene Ratio | Bg Ratio | pvalue | p.adjust | Count |
| GO:0007586 | Stomach | GC | digestion | 38/1159 | 137/18723 | 1.80e-15 | 1.22e-12 | 38 |
| GO:00226006 | Stomach | GC | digestive system process | 30/1159 | 104/18723 | 5.40e-13 | 2.10e-10 | 30 |
| GO:00018946 | Stomach | GC | tissue homeostasis | 43/1159 | 268/18723 | 8.25e-09 | 8.22e-07 | 43 |
| GO:00602496 | Stomach | GC | anatomical structure homeostasis | 47/1159 | 314/18723 | 1.62e-08 | 1.40e-06 | 47 |
| GO:00302776 | Stomach | GC | maintenance of gastrointestinal epithelium | 9/1159 | 22/18723 | 3.09e-06 | 1.27e-04 | 9 |
| GO:00106696 | Stomach | GC | epithelial structure maintenance | 10/1159 | 30/18723 | 7.63e-06 | 2.77e-04 | 10 |
| GO:00075861 | Stomach | CAG with IM | digestion | 29/1050 | 137/18723 | 4.42e-10 | 6.93e-08 | 29 |
| GO:000189411 | Stomach | CAG with IM | tissue homeostasis | 42/1050 | 268/18723 | 1.40e-09 | 1.74e-07 | 42 |
| GO:006024911 | Stomach | CAG with IM | anatomical structure homeostasis | 46/1050 | 314/18723 | 2.18e-09 | 2.64e-07 | 46 |
| GO:002260011 | Stomach | CAG with IM | digestive system process | 22/1050 | 104/18723 | 5.62e-08 | 4.16e-06 | 22 |
| GO:003027711 | Stomach | CAG with IM | maintenance of gastrointestinal epithelium | 9/1050 | 22/18723 | 1.36e-06 | 6.46e-05 | 9 |
| GO:00106691 | Stomach | CAG with IM | epithelial structure maintenance | 10/1050 | 30/18723 | 3.16e-06 | 1.28e-04 | 10 |
| GO:000189421 | Stomach | CSG | tissue homeostasis | 40/1034 | 268/18723 | 9.33e-09 | 8.66e-07 | 40 |
| GO:006024921 | Stomach | CSG | anatomical structure homeostasis | 44/1034 | 314/18723 | 1.22e-08 | 1.06e-06 | 44 |
| GO:00075862 | Stomach | CSG | digestion | 25/1034 | 137/18723 | 1.15e-07 | 8.25e-06 | 25 |
| GO:003027721 | Stomach | CSG | maintenance of gastrointestinal epithelium | 8/1034 | 22/18723 | 1.34e-05 | 4.42e-04 | 8 |
| GO:002260021 | Stomach | CSG | digestive system process | 18/1034 | 104/18723 | 1.44e-05 | 4.63e-04 | 18 |
| GO:00106692 | Stomach | CSG | epithelial structure maintenance | 9/1034 | 30/18723 | 2.30e-05 | 6.73e-04 | 9 |
| GO:000189431 | Stomach | CAG | tissue homeostasis | 25/552 | 268/18723 | 4.14e-07 | 3.13e-05 | 25 |
| GO:00075863 | Stomach | CAG | digestion | 17/552 | 137/18723 | 6.00e-07 | 4.32e-05 | 17 |
| Page: 1 2 |
| Pathway ID | Tissue | Disease Stage | Description | Gene Ratio | Bg Ratio | pvalue | p.adjust | qvalue | Count |
| Page: 1 |
Top |
Cell-cell communication analysis |
| Identification of potential cell-cell interactions between two cell types and their ligand-receptor pairs for different disease states |
| Ligand | Receptor | LRpair | Pathway | Tissue | Disease Stage |
| Page: 1 |
Top |
Single-cell gene regulatory network inference analysis |
| Find out the significant the regulons (TFs) and the target genes of each regulon across cell types for different disease states |
| TF | Cell Type | Tissue | Disease Stage | Target Gene | RSS | Regulon Activity |
| ∗The dot plots of a searched regulon are shown for all cell subpopulations in each disease state of each tissue based on the regulon specific score inferred using pySCENIC and by calculating the average expression. |
| Page: 1 |
Top |
Somatic mutation of malignant transformation related genes |
| Annotation of somatic variants for genes involved in malignant transformation |
| Hugo Symbol | Variant Class | Variant Classification | dbSNP RS | HGVSc | HGVSp | HGVSp Short | SWISSPROT | BIOTYPE | SIFT | PolyPhen | Tumor Sample Barcode | Tissue | Histology | Sex | Age | Stage | Therapy Types | Drugs | Outcome |
| MUC6 | SNV | Missense_Mutation | novel | c.436N>G | p.Leu146Val | p.L146V | Q6W4X9 | protein_coding | deleterious(0.05) | possibly_damaging(0.86) | TCGA-A2-A3Y0-01 | Breast | breast invasive carcinoma | Female | <65 | I/II | Chemotherapy | adriamycin | CR |
| MUC6 | SNV | Missense_Mutation | rs200980330 | c.1000N>G | p.Cys334Gly | p.C334G | Q6W4X9 | protein_coding | deleterious(0) | probably_damaging(0.999) | TCGA-AC-A3W7-01 | Breast | breast invasive carcinoma | Female | >=65 | I/II | Hormone Therapy | femara | SD |
| MUC6 | SNV | Missense_Mutation | novel | c.6445C>T | p.His2149Tyr | p.H2149Y | Q6W4X9 | protein_coding | deleterious_low_confidence(0.05) | benign(0.052) | TCGA-AC-A6IX-01 | Breast | breast invasive carcinoma | Female | <65 | III/IV | Unknown | Unknown | SD |
| MUC6 | SNV | Missense_Mutation | c.6440N>A | p.Ser2147Tyr | p.S2147Y | Q6W4X9 | protein_coding | deleterious_low_confidence(0) | benign(0.078) | TCGA-BH-A0BP-01 | Breast | breast invasive carcinoma | Female | >=65 | I/II | Unknown | Unknown | SD | |
| MUC6 | SNV | Missense_Mutation | c.6395N>T | p.Ser2132Phe | p.S2132F | Q6W4X9 | protein_coding | deleterious_low_confidence(0.04) | benign(0.003) | TCGA-E2-A1LB-01 | Breast | breast invasive carcinoma | Female | <65 | I/II | Chemotherapy | cytoxan | SD | |
| MUC6 | SNV | Missense_Mutation | novel | c.3422N>T | p.Gly1141Val | p.G1141V | Q6W4X9 | protein_coding | deleterious(0.03) | benign(0.031) | TCGA-HN-A2NL-01 | Breast | breast invasive carcinoma | Female | <65 | I/II | Chemotherapy | cyclophosphamide | SD |
| MUC6 | SNV | Missense_Mutation | novel | c.641N>A | p.Thr214Asn | p.T214N | Q6W4X9 | protein_coding | deleterious(0.05) | benign(0.007) | TCGA-V7-A7HQ-01 | Breast | breast invasive carcinoma | Female | >=65 | III/IV | Hormone Therapy | letrozole | CR |
| MUC6 | deletion | Frame_Shift_Del | c.3937_3938delNN | p.Ala1313GlnfsTer83 | p.A1313Qfs*83 | Q6W4X9 | protein_coding | TCGA-BH-A0RX-01 | Breast | breast invasive carcinoma | Female | <65 | I/II | Chemotherapy | fluorouracil | SD | |||
| MUC6 | deletion | Frame_Shift_Del | novel | c.6284delN | p.Pro2095LeufsTer20 | p.P2095Lfs*20 | Q6W4X9 | protein_coding | TCGA-D8-A27V-01 | Breast | breast invasive carcinoma | Female | <65 | I/II | Hormone Therapy | tamoxiphen | SD | ||
| MUC6 | deletion | Frame_Shift_Del | novel | c.4499delC | p.Pro1500HisfsTer3 | p.P1500Hfs*3 | Q6W4X9 | protein_coding | TCGA-EW-A2FV-01 | Breast | breast invasive carcinoma | Female | <65 | III/IV | Chemotherapy | docetaxel | SD |
| Page: 1 2 3 4 5 6 7 8 9 10 11 12 13 14 15 16 17 18 19 20 21 |
Top |
Related drugs of malignant transformation related genes |
| Identification of chemicals and drugs interact with genes involved in malignant transfromation |
| (DGIdb 4.0) |
| Entrez ID | Symbol | Category | Interaction Types | Drug Claim Name | Drug Name | PMIDs |
| Page: 1 |

Copyright 2023-Present -The University of Texas Health Science Center at Houston |