
|
|||||
|
 | |
| |
| |
| |
| |
| |
|
Gene: MUC5B |
Gene summary for MUC5B |
| Gene information | Species | Human | Gene symbol | MUC5B | Gene ID | 727897 |
| Gene name | mucin 5B, oligomeric mucus/gel-forming | |
| Gene Alias | MG1 | |
| Cytomap | 11p15.5 | |
| Gene Type | protein-coding | GO ID | GO:0005575 | UniProtAcc | Q9HC84 |
Top |
Malignant transformation analysis |
| Identification of the aberrant gene expression in precancerous and cancerous lesions by comparing the gene expression of stem-like cells in diseased tissues with normal stem cells |
| Entrez ID | Symbol | Replicates | Species | Organ | Tissue | Adj P-value | Log2FC | Malignancy |
| 727897 | MUC5B | CA_HPV_1 | Human | Cervix | CC | 1.81e-35 | -9.75e-01 | 0.0264 |
| 727897 | MUC5B | CA_HPV_2 | Human | Cervix | CC | 2.07e-26 | -9.50e-01 | 0.0391 |
| 727897 | MUC5B | CA_HPV_3 | Human | Cervix | CC | 2.34e-23 | -9.25e-01 | 0.0414 |
| 727897 | MUC5B | HSIL_HPV_1 | Human | Cervix | HSIL_HPV | 3.87e-06 | -5.97e-01 | 0.0116 |
| 727897 | MUC5B | HSIL_HPV_2 | Human | Cervix | HSIL_HPV | 3.52e-05 | -1.91e-01 | 0.0208 |
| 727897 | MUC5B | N_HPV_1 | Human | Cervix | N_HPV | 2.88e-09 | -6.64e-01 | 0.0079 |
| 727897 | MUC5B | N_HPV_2 | Human | Cervix | N_HPV | 1.75e-08 | -6.64e-01 | -0.0131 |
| 727897 | MUC5B | CCI_1 | Human | Cervix | CC | 4.44e-10 | -9.75e-01 | 0.528 |
| 727897 | MUC5B | CCI_2 | Human | Cervix | CC | 3.15e-09 | -9.75e-01 | 0.5249 |
| 727897 | MUC5B | CCI_3 | Human | Cervix | CC | 1.68e-13 | -9.75e-01 | 0.516 |
| 727897 | MUC5B | CCII_1 | Human | Cervix | CC | 1.00e-18 | -9.75e-01 | 0.3249 |
| 727897 | MUC5B | Tumor | Human | Cervix | CC | 7.90e-34 | -9.75e-01 | 0.1241 |
| 727897 | MUC5B | sample1 | Human | Cervix | CC | 1.18e-15 | -9.75e-01 | 0.0959 |
| 727897 | MUC5B | sample3 | Human | Cervix | CC | 2.01e-33 | -9.75e-01 | 0.1387 |
| 727897 | MUC5B | H2 | Human | Cervix | HSIL_HPV | 2.62e-38 | 9.26e-01 | 0.0632 |
| 727897 | MUC5B | L1 | Human | Cervix | CC | 1.55e-20 | -9.75e-01 | 0.0802 |
| 727897 | MUC5B | T1 | Human | Cervix | CC | 6.11e-31 | -9.69e-01 | 0.0918 |
| 727897 | MUC5B | T3 | Human | Cervix | CC | 4.67e-35 | -9.75e-01 | 0.1389 |
| 727897 | MUC5B | HTA11_3410_2000001011 | Human | Colorectum | AD | 2.69e-09 | -5.26e-01 | 0.0155 |
| 727897 | MUC5B | HTA11_1938_2000001011 | Human | Colorectum | AD | 5.86e-06 | -6.05e-01 | -0.0811 |
| Page: 1 2 3 4 |
| Tissue | Expression Dynamics | Abbreviation |
| Cervix | 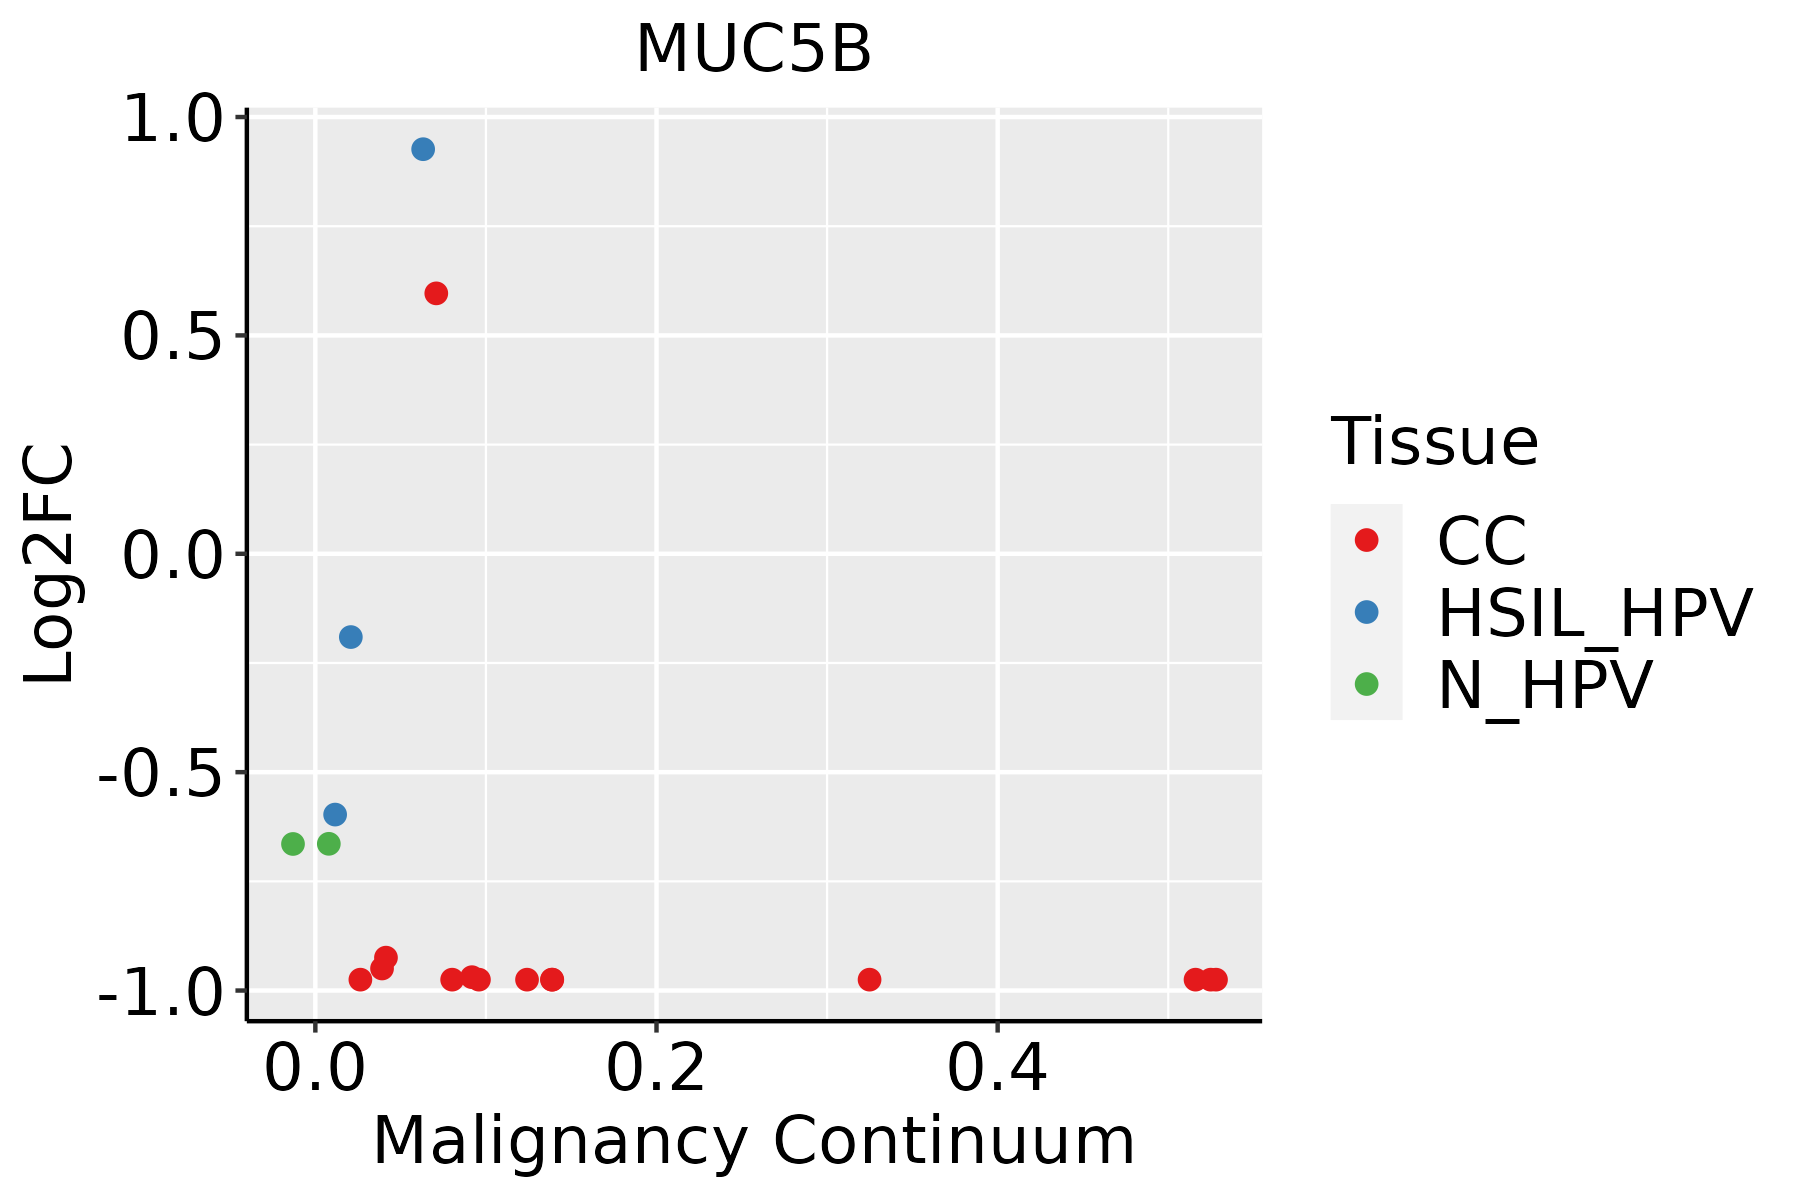 | CC: Cervix cancer |
| HSIL_HPV: HPV-infected high-grade squamous intraepithelial lesions | ||
| N_HPV: HPV-infected normal cervix | ||
| Colorectum (GSE201348) |  | FAP: Familial adenomatous polyposis |
| CRC: Colorectal cancer | ||
| Colorectum (HTA11) |  | AD: Adenomas |
| SER: Sessile serrated lesions | ||
| MSI-H: Microsatellite-high colorectal cancer | ||
| MSS: Microsatellite stable colorectal cancer | ||
| Endometrium |  | AEH: Atypical endometrial hyperplasia |
| EEC: Endometrioid Cancer | ||
| Liver |  | HCC: Hepatocellular carcinoma |
| NAFLD: Non-alcoholic fatty liver disease | ||
| Lung |  | AAH: Atypical adenomatous hyperplasia |
| AIS: Adenocarcinoma in situ | ||
| IAC: Invasive lung adenocarcinoma | ||
| MIA: Minimally invasive adenocarcinoma | ||
| Oral Cavity | 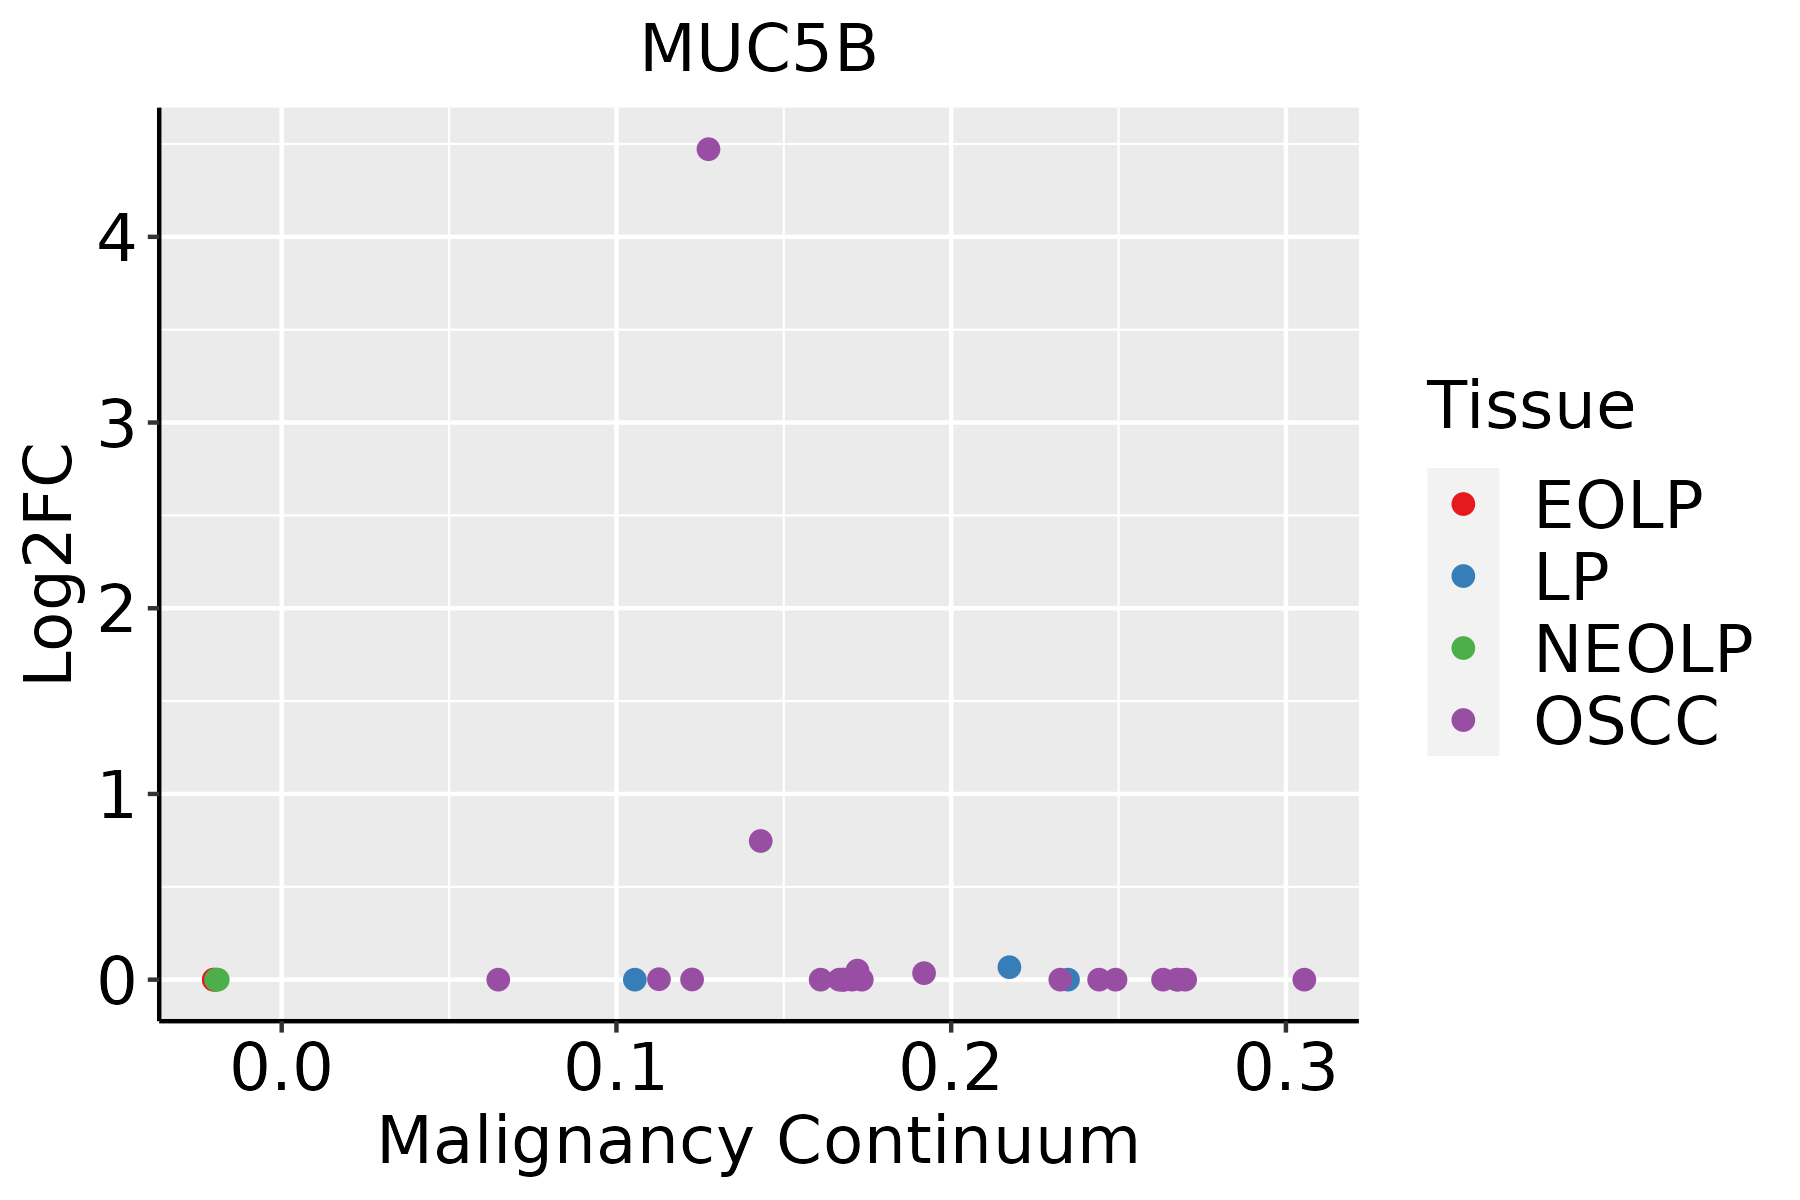 | EOLP: Erosive Oral lichen planus |
| LP: leukoplakia | ||
| NEOLP: Non-erosive oral lichen planus | ||
| OSCC: Oral squamous cell carcinoma |
| ∗log2FC in expression of this searched gene in stem-like cells from each diseased tissue sample relative to stem-like cells in normal samples in each tissue plotted against the malignancy continuum. Samples are colored based on if they are from different disease stage. |
Top |
Malignant transformation related pathway analysis |
| Find out the enriched GO biological processes and KEGG pathways involved in transition from healthy to precancer to cancer |
| Tissue | Disease Stage | Enriched GO biological Processes |
| Colorectum | AD |  |
| Colorectum | SER |  |
| Colorectum | MSS |  |
| Colorectum | MSI-H |  |
| Colorectum | FAP |  |
| ∗Top 15 enriched GO BP terms are showed in the bar plot of each disease state in each tissue. Each row represents a significant GO biological process which is colored according to the -log10(p.adjust). |
| Page: 1 2 3 4 5 6 7 8 9 |
| GO ID | Tissue | Disease Stage | Description | Gene Ratio | Bg Ratio | pvalue | p.adjust | Count |
| Page: 1 |
| Pathway ID | Tissue | Disease Stage | Description | Gene Ratio | Bg Ratio | pvalue | p.adjust | qvalue | Count |
| hsa0465718 | Cervix | CC | IL-17 signaling pathway | 31/1267 | 94/8465 | 8.71e-06 | 7.43e-05 | 4.39e-05 | 31 |
| hsa0465719 | Cervix | CC | IL-17 signaling pathway | 31/1267 | 94/8465 | 8.71e-06 | 7.43e-05 | 4.39e-05 | 31 |
| hsa0465722 | Cervix | HSIL_HPV | IL-17 signaling pathway | 15/459 | 94/8465 | 1.45e-04 | 1.74e-03 | 1.40e-03 | 15 |
| hsa0465732 | Cervix | HSIL_HPV | IL-17 signaling pathway | 15/459 | 94/8465 | 1.45e-04 | 1.74e-03 | 1.40e-03 | 15 |
| hsa0465742 | Cervix | N_HPV | IL-17 signaling pathway | 16/349 | 94/8465 | 1.20e-06 | 1.64e-05 | 1.28e-05 | 16 |
| hsa0465752 | Cervix | N_HPV | IL-17 signaling pathway | 16/349 | 94/8465 | 1.20e-06 | 1.64e-05 | 1.28e-05 | 16 |
| hsa04970 | Colorectum | FAP | Salivary secretion | 24/1404 | 93/8465 | 1.52e-02 | 4.99e-02 | 3.03e-02 | 24 |
| hsa049701 | Colorectum | FAP | Salivary secretion | 24/1404 | 93/8465 | 1.52e-02 | 4.99e-02 | 3.03e-02 | 24 |
| hsa049702 | Colorectum | CRC | Salivary secretion | 22/1091 | 93/8465 | 3.03e-03 | 1.91e-02 | 1.29e-02 | 22 |
| hsa049703 | Colorectum | CRC | Salivary secretion | 22/1091 | 93/8465 | 3.03e-03 | 1.91e-02 | 1.29e-02 | 22 |
| hsa0465720 | Endometrium | EEC | IL-17 signaling pathway | 23/1237 | 94/8465 | 7.61e-03 | 3.63e-02 | 2.71e-02 | 23 |
| hsa04657110 | Endometrium | EEC | IL-17 signaling pathway | 23/1237 | 94/8465 | 7.61e-03 | 3.63e-02 | 2.71e-02 | 23 |
| Page: 1 |
Top |
Cell-cell communication analysis |
| Identification of potential cell-cell interactions between two cell types and their ligand-receptor pairs for different disease states |
| Ligand | Receptor | LRpair | Pathway | Tissue | Disease Stage |
| Page: 1 |
Top |
Single-cell gene regulatory network inference analysis |
| Find out the significant the regulons (TFs) and the target genes of each regulon across cell types for different disease states |
| TF | Cell Type | Tissue | Disease Stage | Target Gene | RSS | Regulon Activity |
| ∗The dot plots of a searched regulon are shown for all cell subpopulations in each disease state of each tissue based on the regulon specific score inferred using pySCENIC and by calculating the average expression. |
| Page: 1 |
Top |
Somatic mutation of malignant transformation related genes |
| Annotation of somatic variants for genes involved in malignant transformation |
| Hugo Symbol | Variant Class | Variant Classification | dbSNP RS | HGVSc | HGVSp | HGVSp Short | SWISSPROT | BIOTYPE | SIFT | PolyPhen | Tumor Sample Barcode | Tissue | Histology | Sex | Age | Stage | Therapy Types | Drugs | Outcome |
| MUC5B | SNV | Missense_Mutation | c.6115N>T | p.Pro2039Ser | p.P2039S | Q9HC84 | protein_coding | tolerated(0.59) | benign(0.006) | TCGA-A1-A0SN-01 | Breast | breast invasive carcinoma | Female | <65 | I/II | Chemotherapy | ac | SD | |
| MUC5B | SNV | Missense_Mutation | novel | c.4519N>G | p.Cys1507Gly | p.C1507G | Q9HC84 | protein_coding | deleterious(0) | probably_damaging(0.989) | TCGA-A1-A0SO-01 | Breast | breast invasive carcinoma | Female | >=65 | I/II | Chemotherapy | SD | |
| MUC5B | SNV | Missense_Mutation | novel | c.2488N>T | p.His830Tyr | p.H830Y | Q9HC84 | protein_coding | deleterious(0) | possibly_damaging(0.728) | TCGA-A7-A56D-01 | Breast | breast invasive carcinoma | Female | >=65 | I/II | Hormone Therapy | arimidex | SD |
| MUC5B | SNV | Missense_Mutation | c.6863N>T | p.Pro2288Leu | p.P2288L | Q9HC84 | protein_coding | tolerated(0.23) | benign(0.09) | TCGA-A8-A07O-01 | Breast | breast invasive carcinoma | Female | <65 | I/II | Chemotherapy | CR | ||
| MUC5B | SNV | Missense_Mutation | c.13022N>T | p.Thr4341Ile | p.T4341I | Q9HC84 | protein_coding | deleterious(0.02) | benign(0.031) | TCGA-A8-A09D-01 | Breast | breast invasive carcinoma | Female | <65 | I/II | Chemotherapy | doxorubicin | CR | |
| MUC5B | SNV | Missense_Mutation | c.7852N>A | p.Ala2618Thr | p.A2618T | Q9HC84 | protein_coding | tolerated(0.4) | benign(0.003) | TCGA-A8-A09Z-01 | Breast | breast invasive carcinoma | Female | >=65 | I/II | Unknown | Unknown | SD | |
| MUC5B | SNV | Missense_Mutation | novel | c.10463C>G | p.Ser3488Cys | p.S3488C | Q9HC84 | protein_coding | deleterious(0.03) | possibly_damaging(0.712) | TCGA-AC-A5XS-01 | Breast | breast invasive carcinoma | Female | >=65 | I/II | Hormone Therapy | femara | SD |
| MUC5B | SNV | Missense_Mutation | rs374072351 | c.4427N>T | p.Ser1476Leu | p.S1476L | Q9HC84 | protein_coding | deleterious(0.01) | benign(0.085) | TCGA-AN-A046-01 | Breast | breast invasive carcinoma | Female | >=65 | I/II | Unknown | Unknown | SD |
| MUC5B | SNV | Missense_Mutation | c.8552N>G | p.Ser2851Trp | p.S2851W | Q9HC84 | protein_coding | deleterious(0) | possibly_damaging(0.751) | TCGA-AO-A0JA-01 | Breast | breast invasive carcinoma | Female | <65 | III/IV | Hormone Therapy | leuprolide | SD | |
| MUC5B | SNV | Missense_Mutation | rs371254219 | c.5357N>T | p.Pro1786Leu | p.P1786L | Q9HC84 | protein_coding | deleterious(0.01) | benign(0.347) | TCGA-AO-A128-01 | Breast | breast invasive carcinoma | Female | <65 | I/II | Chemotherapy | doxorubicin | SD |
| Page: 1 2 3 4 5 6 7 8 9 10 11 12 13 14 15 16 17 18 19 20 21 22 23 24 25 26 27 28 29 30 31 32 33 34 35 36 37 38 39 40 41 42 43 44 45 46 47 48 49 50 51 52 53 54 55 56 57 58 59 60 61 62 63 64 |
Top |
Related drugs of malignant transformation related genes |
| Identification of chemicals and drugs interact with genes involved in malignant transfromation |
| (DGIdb 4.0) |
| Entrez ID | Symbol | Category | Interaction Types | Drug Claim Name | Drug Name | PMIDs |
| Page: 1 |

Copyright 2023-Present -The University of Texas Health Science Center at Houston |