
|
|||||
|
 | |
| |
| |
| |
| |
| |
|
Gene: MUC4 |
Gene summary for MUC4 |
| Gene information | Species | Human | Gene symbol | MUC4 | Gene ID | 4585 |
| Gene name | mucin 4, cell surface associated | |
| Gene Alias | ASGP | |
| Cytomap | 3q29 | |
| Gene Type | protein-coding | GO ID | GO:0001894 | UniProtAcc | A0A0G2JS65 |
Top |
Malignant transformation analysis |
| Identification of the aberrant gene expression in precancerous and cancerous lesions by comparing the gene expression of stem-like cells in diseased tissues with normal stem cells |
| Entrez ID | Symbol | Replicates | Species | Organ | Tissue | Adj P-value | Log2FC | Malignancy |
| 4585 | MUC4 | CA_HPV_1 | Human | Cervix | CC | 2.47e-13 | -4.35e-01 | 0.0264 |
| 4585 | MUC4 | CA_HPV_2 | Human | Cervix | CC | 1.01e-04 | 3.87e-01 | 0.0391 |
| 4585 | MUC4 | CA_HPV_3 | Human | Cervix | CC | 2.67e-04 | -3.53e-01 | 0.0414 |
| 4585 | MUC4 | HSIL_HPV_1 | Human | Cervix | HSIL_HPV | 2.89e-06 | -3.66e-01 | 0.0116 |
| 4585 | MUC4 | N_HPV_1 | Human | Cervix | N_HPV | 7.88e-11 | -4.46e-01 | 0.0079 |
| 4585 | MUC4 | N_HPV_2 | Human | Cervix | N_HPV | 2.68e-06 | -3.35e-01 | -0.0131 |
| 4585 | MUC4 | CCI_1 | Human | Cervix | CC | 8.65e-11 | 2.05e+00 | 0.528 |
| 4585 | MUC4 | CCI_3 | Human | Cervix | CC | 6.04e-15 | 1.74e+00 | 0.516 |
| 4585 | MUC4 | CCII_1 | Human | Cervix | CC | 1.41e-07 | 6.28e-01 | 0.3249 |
| 4585 | MUC4 | Tumor | Human | Cervix | CC | 2.34e-19 | 5.37e-01 | 0.1241 |
| 4585 | MUC4 | sample3 | Human | Cervix | CC | 5.32e-52 | 8.62e-01 | 0.1387 |
| 4585 | MUC4 | H2 | Human | Cervix | HSIL_HPV | 5.42e-13 | 5.57e-01 | 0.0632 |
| 4585 | MUC4 | T1 | Human | Cervix | CC | 5.89e-17 | 6.36e-01 | 0.0918 |
| 4585 | MUC4 | T3 | Human | Cervix | CC | 8.21e-52 | 8.26e-01 | 0.1389 |
| 4585 | MUC4 | HTA11_3410_2000001011 | Human | Colorectum | AD | 3.66e-16 | -6.22e-01 | 0.0155 |
| 4585 | MUC4 | HTA11_347_2000001011 | Human | Colorectum | AD | 1.97e-10 | 5.97e-01 | -0.1954 |
| 4585 | MUC4 | HTA11_411_2000001011 | Human | Colorectum | SER | 1.02e-03 | 6.25e-01 | -0.2602 |
| 4585 | MUC4 | HTA11_83_2000001011 | Human | Colorectum | SER | 2.69e-05 | 5.39e-01 | -0.1526 |
| 4585 | MUC4 | HTA11_696_2000001011 | Human | Colorectum | AD | 1.30e-03 | 7.83e-01 | -0.1464 |
| 4585 | MUC4 | HTA11_866_2000001011 | Human | Colorectum | AD | 2.76e-08 | 7.11e-01 | -0.1001 |
| Page: 1 2 3 4 5 6 7 |
| Tissue | Expression Dynamics | Abbreviation |
| Cervix | 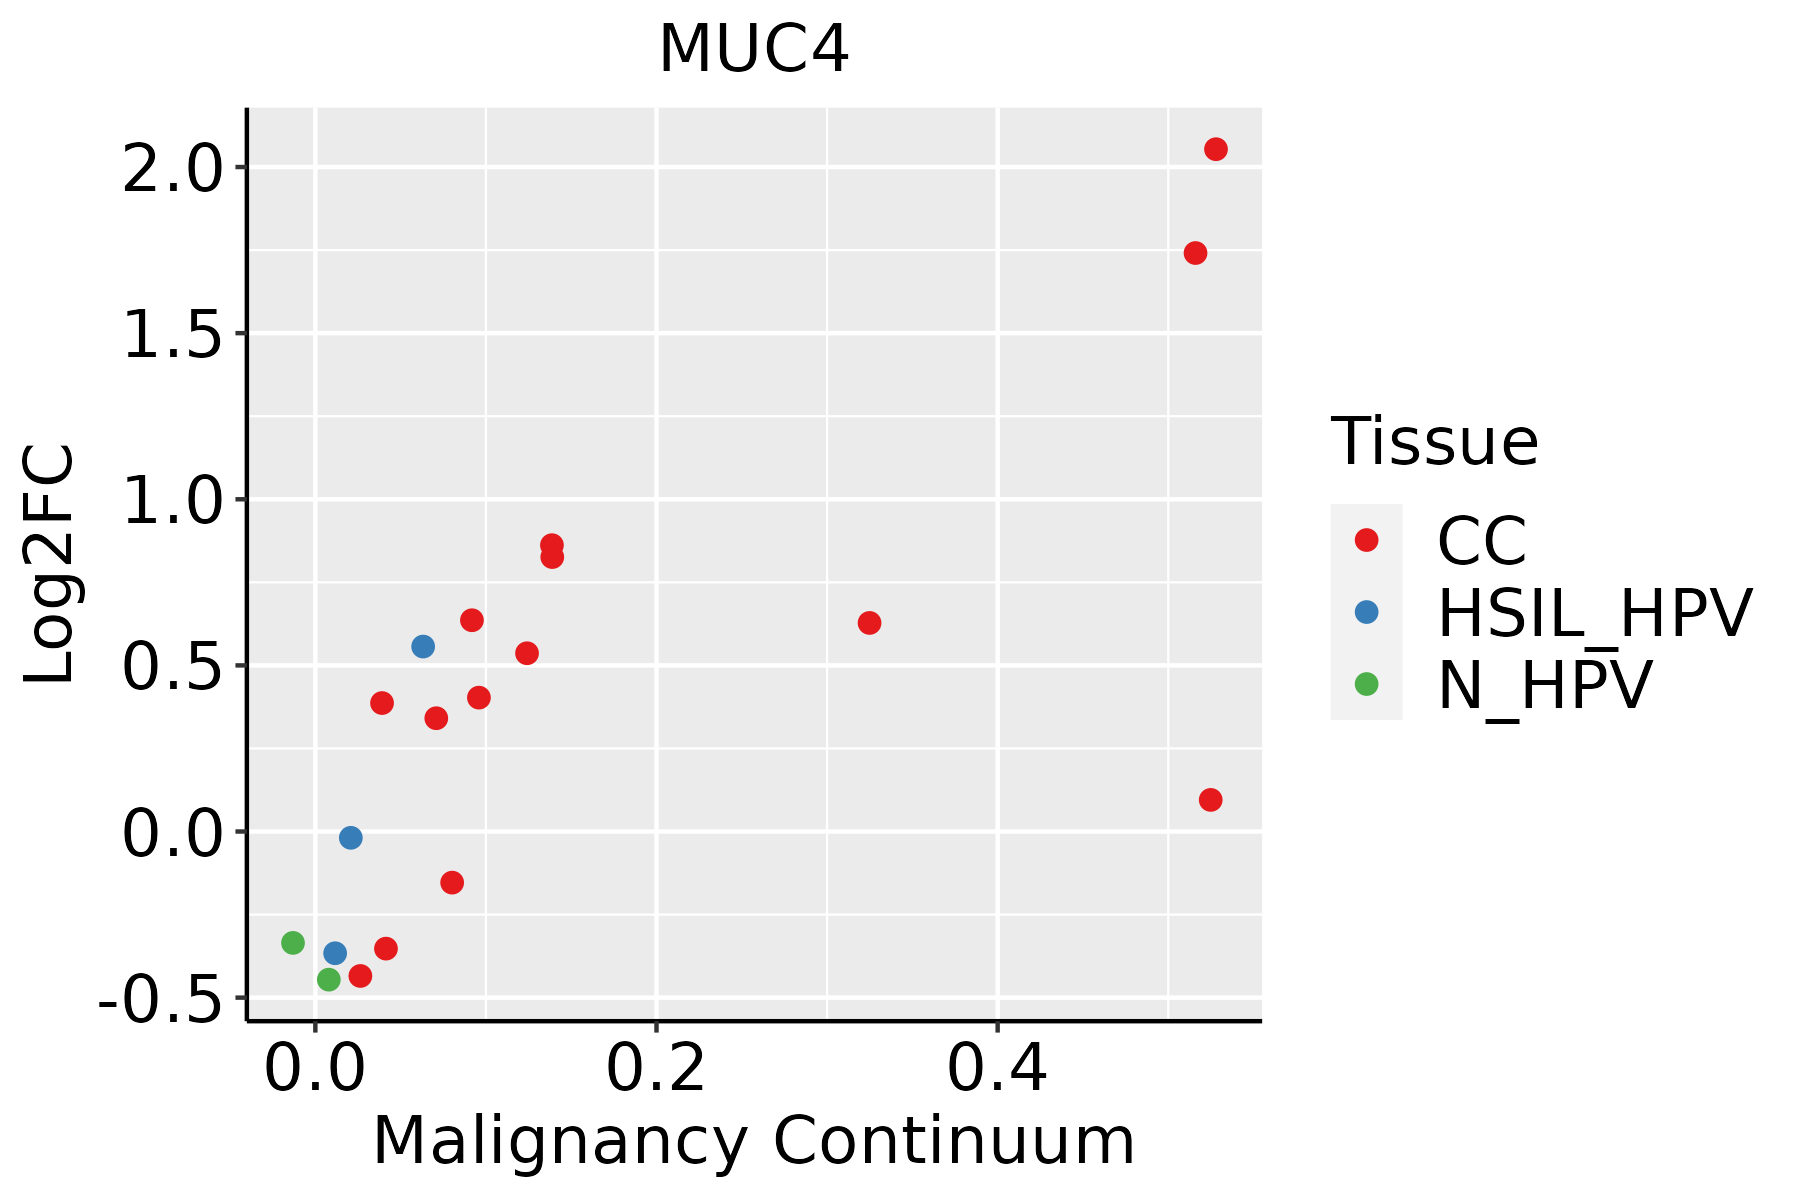 | CC: Cervix cancer |
| HSIL_HPV: HPV-infected high-grade squamous intraepithelial lesions | ||
| N_HPV: HPV-infected normal cervix | ||
| Colorectum (GSE201348) |  | FAP: Familial adenomatous polyposis |
| CRC: Colorectal cancer | ||
| Colorectum (HTA11) |  | AD: Adenomas |
| SER: Sessile serrated lesions | ||
| MSI-H: Microsatellite-high colorectal cancer | ||
| MSS: Microsatellite stable colorectal cancer | ||
| Endometrium | 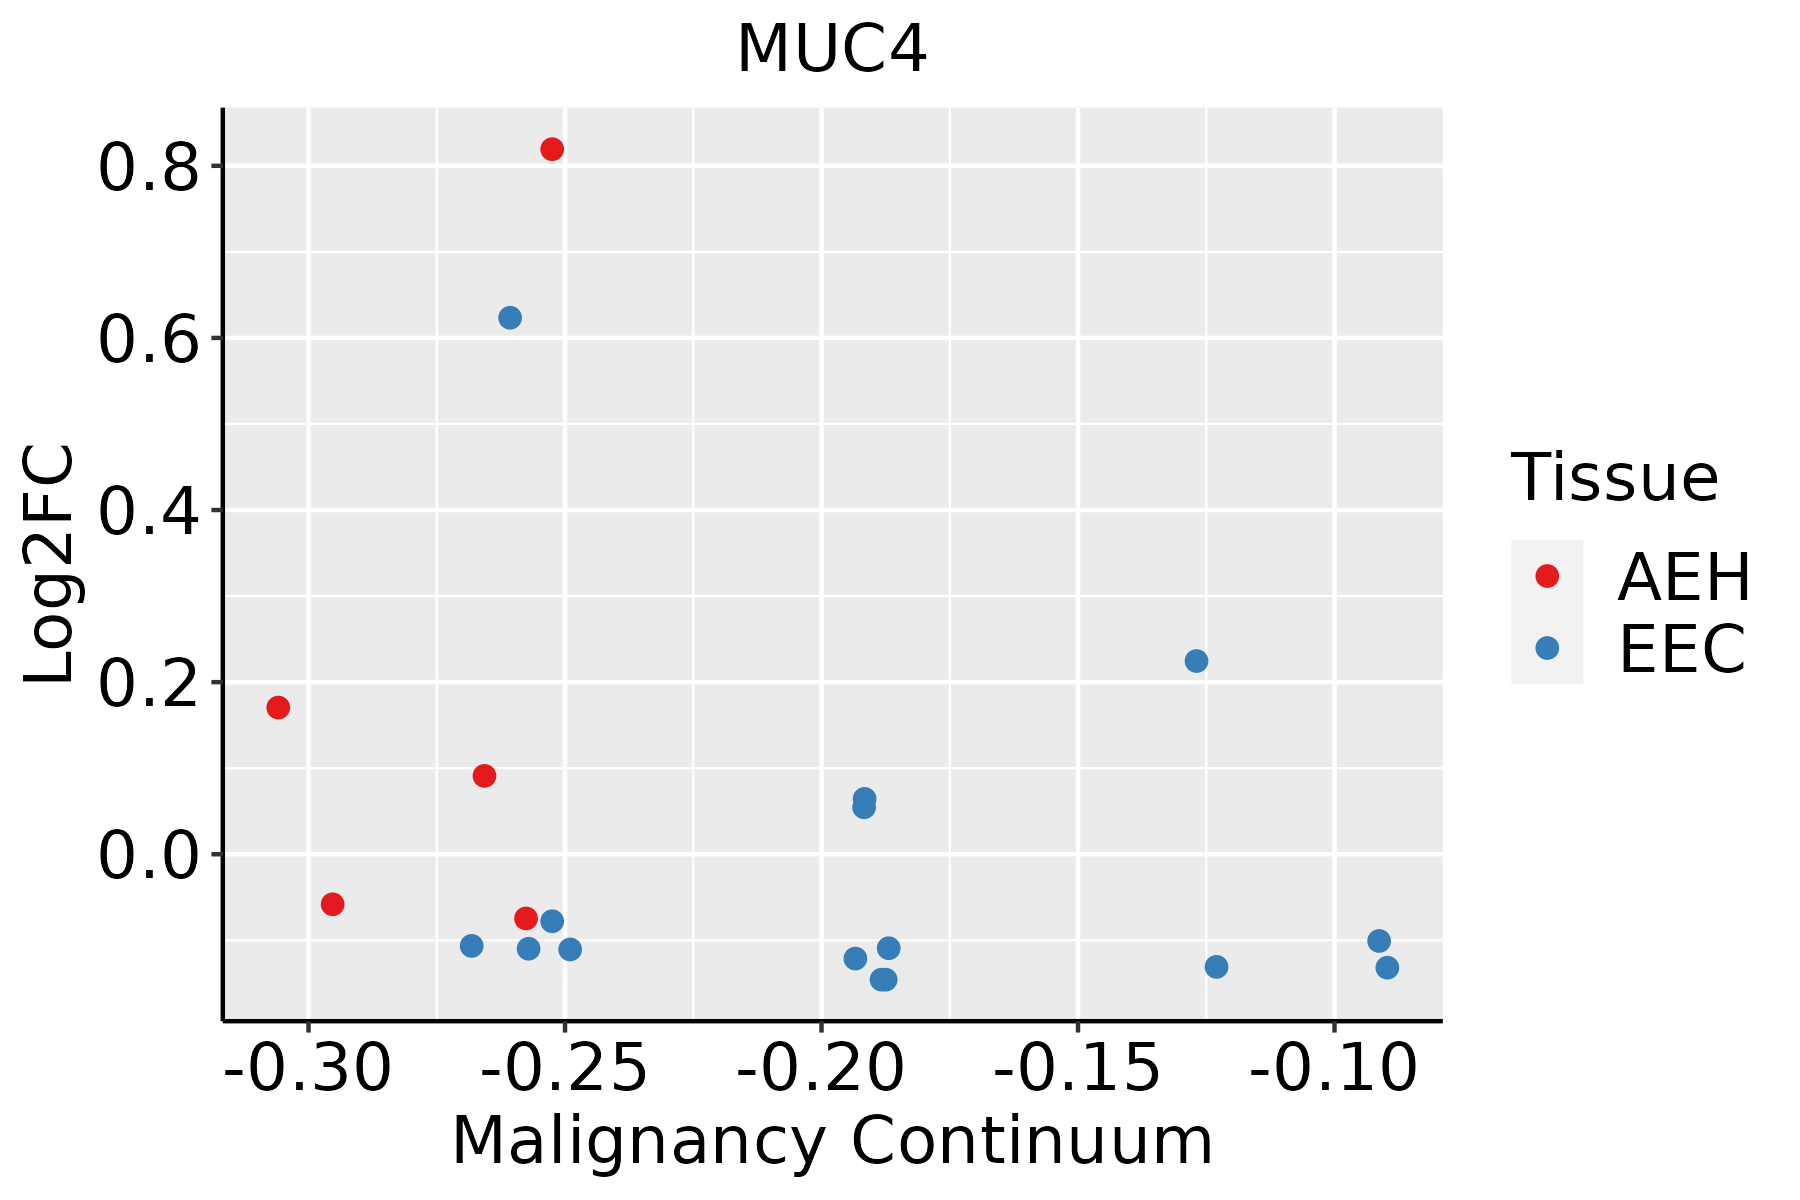 | AEH: Atypical endometrial hyperplasia |
| EEC: Endometrioid Cancer | ||
| Esophagus | 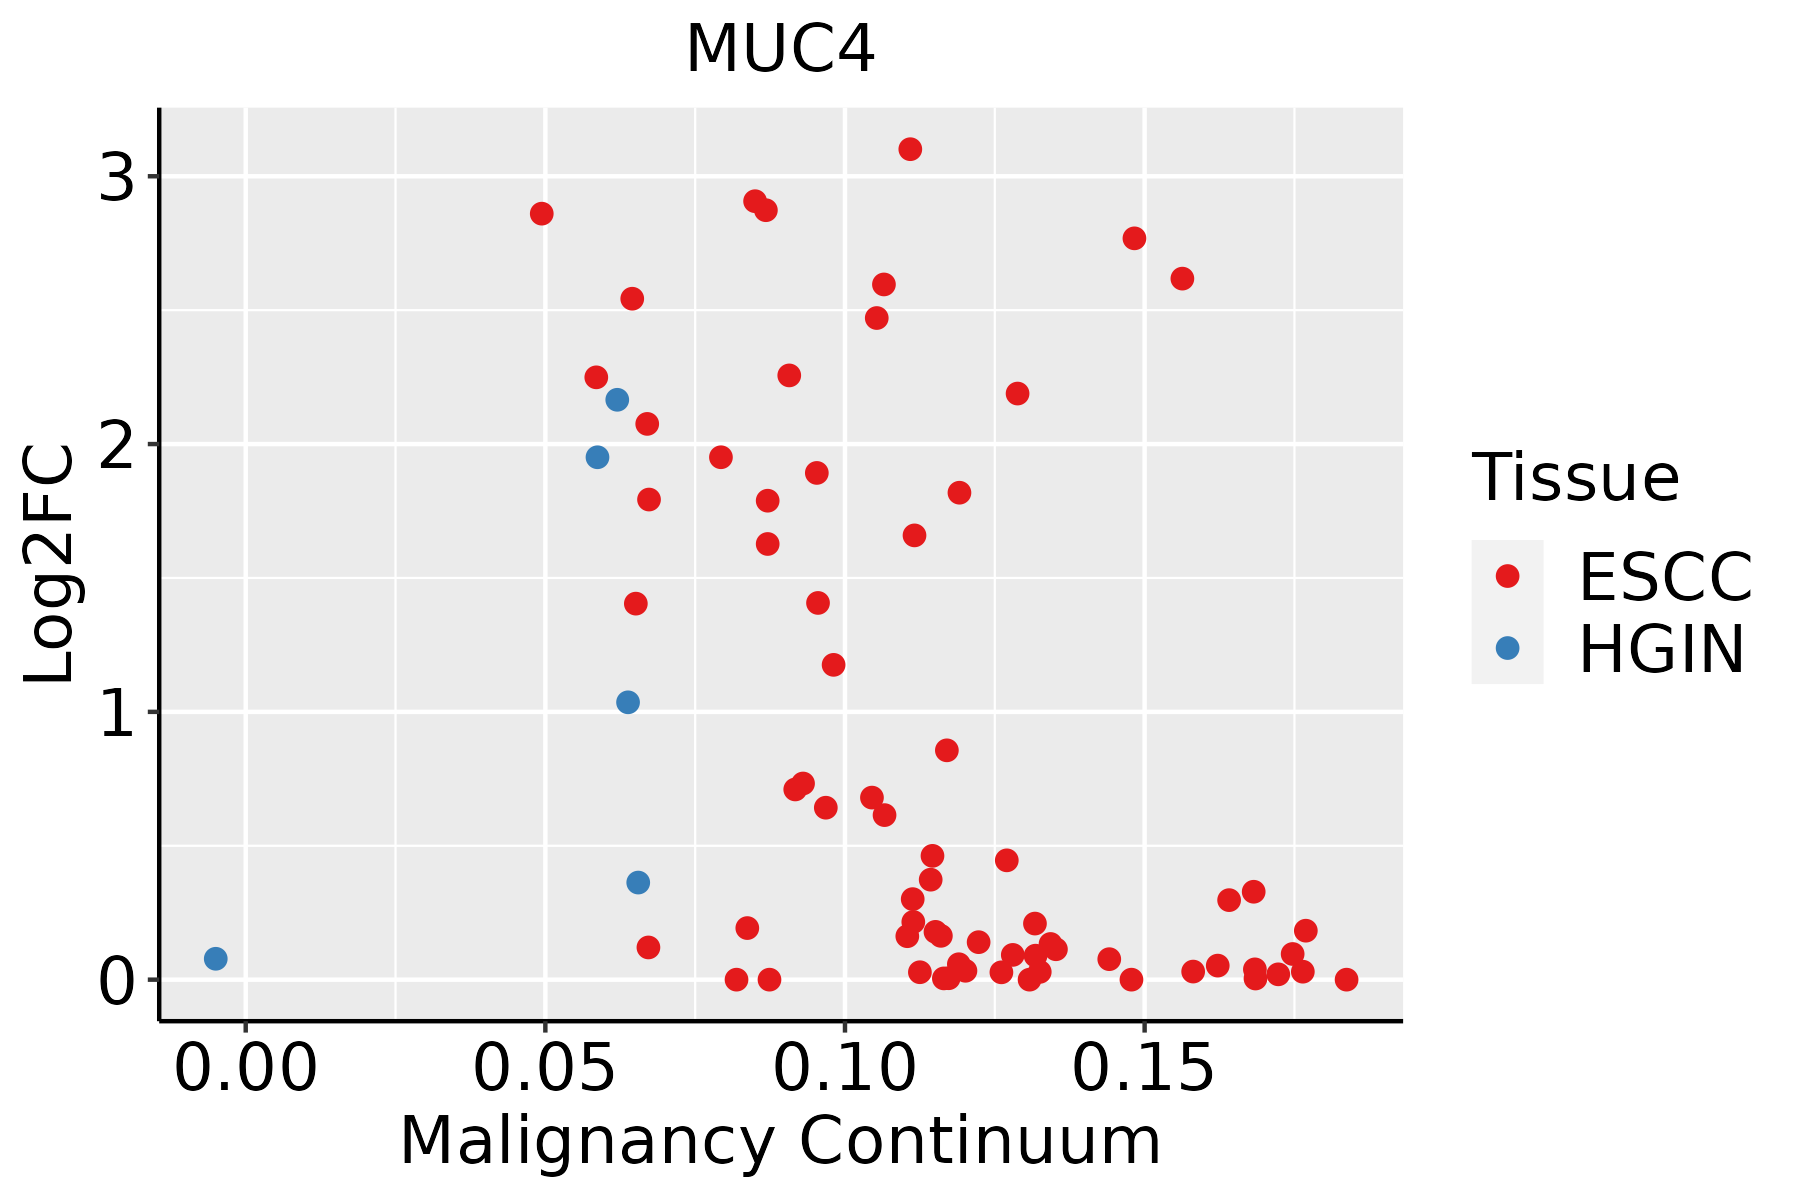 | ESCC: Esophageal squamous cell carcinoma |
| HGIN: High-grade intraepithelial neoplasias | ||
| LGIN: Low-grade intraepithelial neoplasias | ||
| GC | 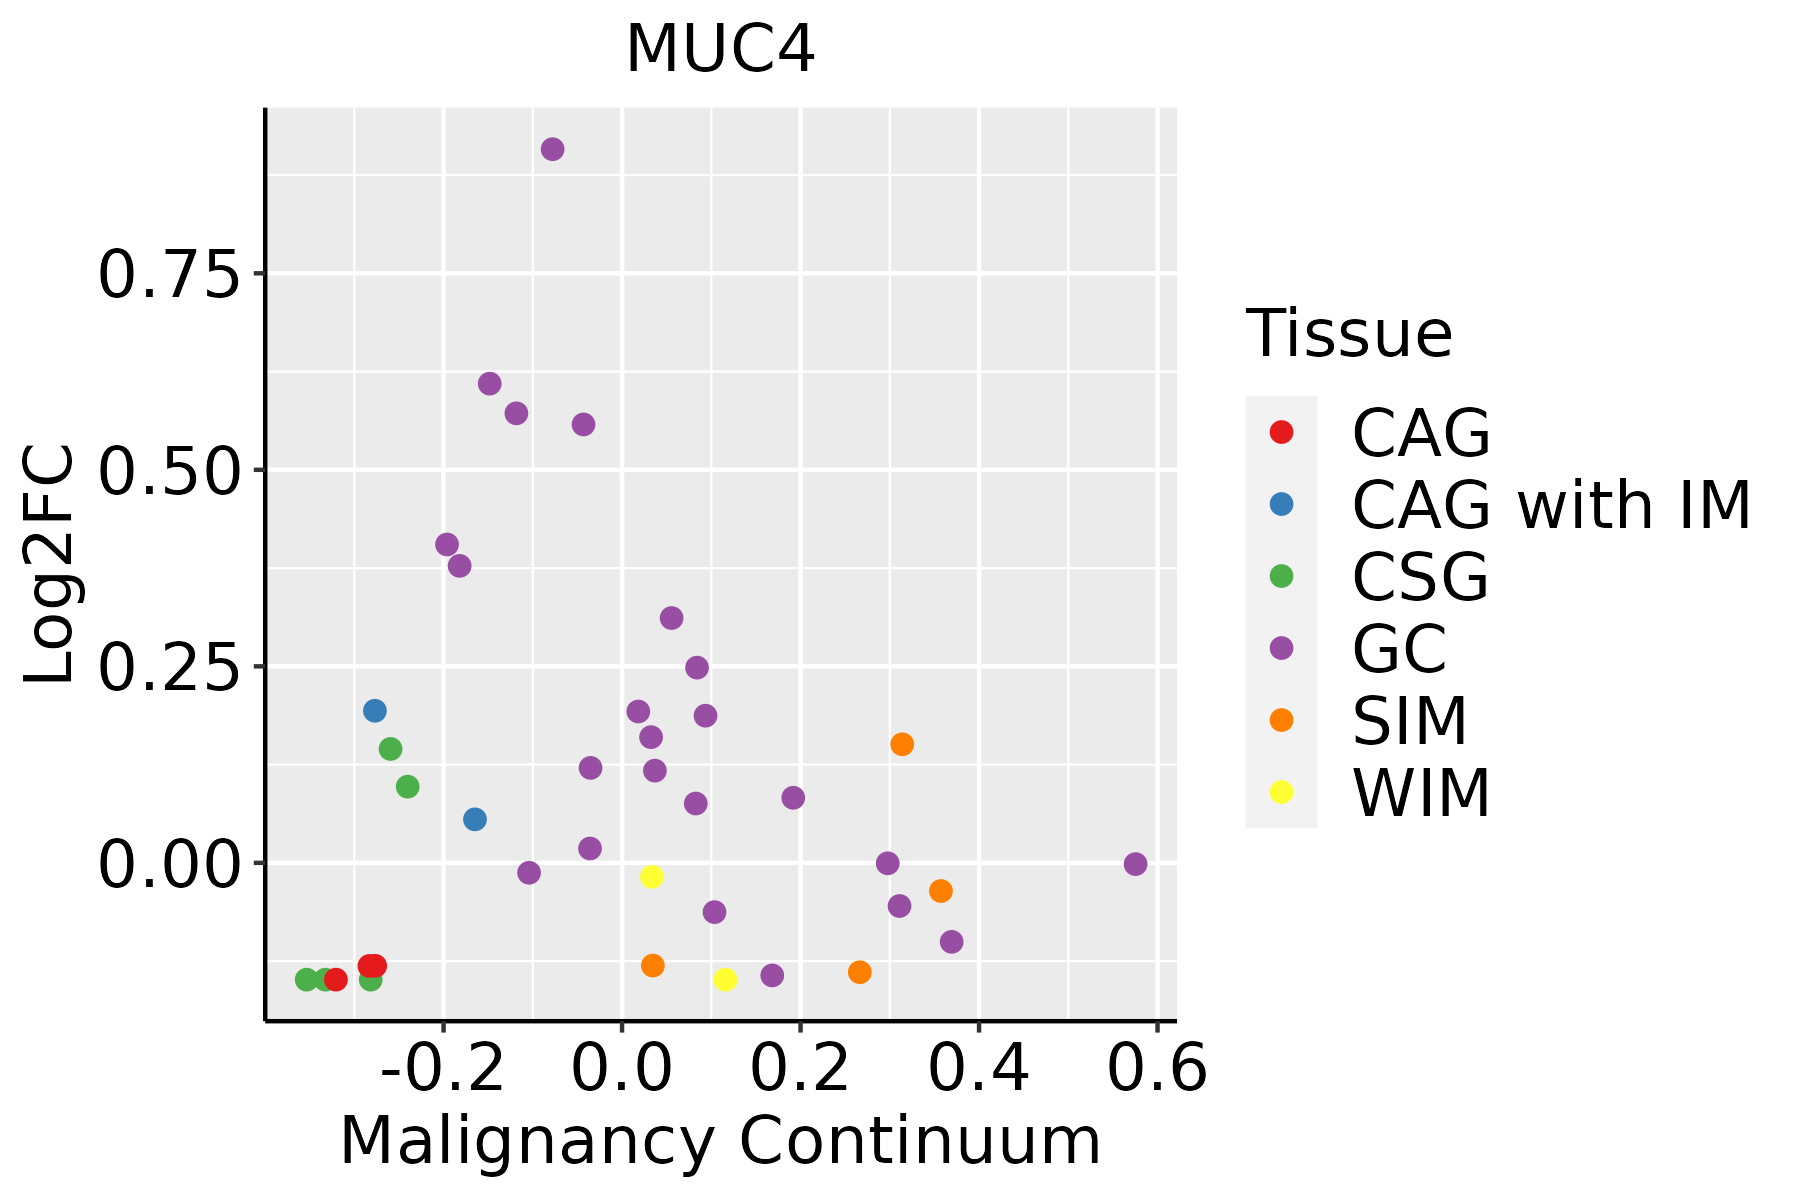 | CAG: Chronic atrophic gastritis |
| CAG with IM: Chronic atrophic gastritis with intestinal metaplasia | ||
| CSG: Chronic superficial gastritis | ||
| GC: Gastric cancer | ||
| SIM: Severe intestinal metaplasia | ||
| WIM: Wild intestinal metaplasia | ||
| Lung | 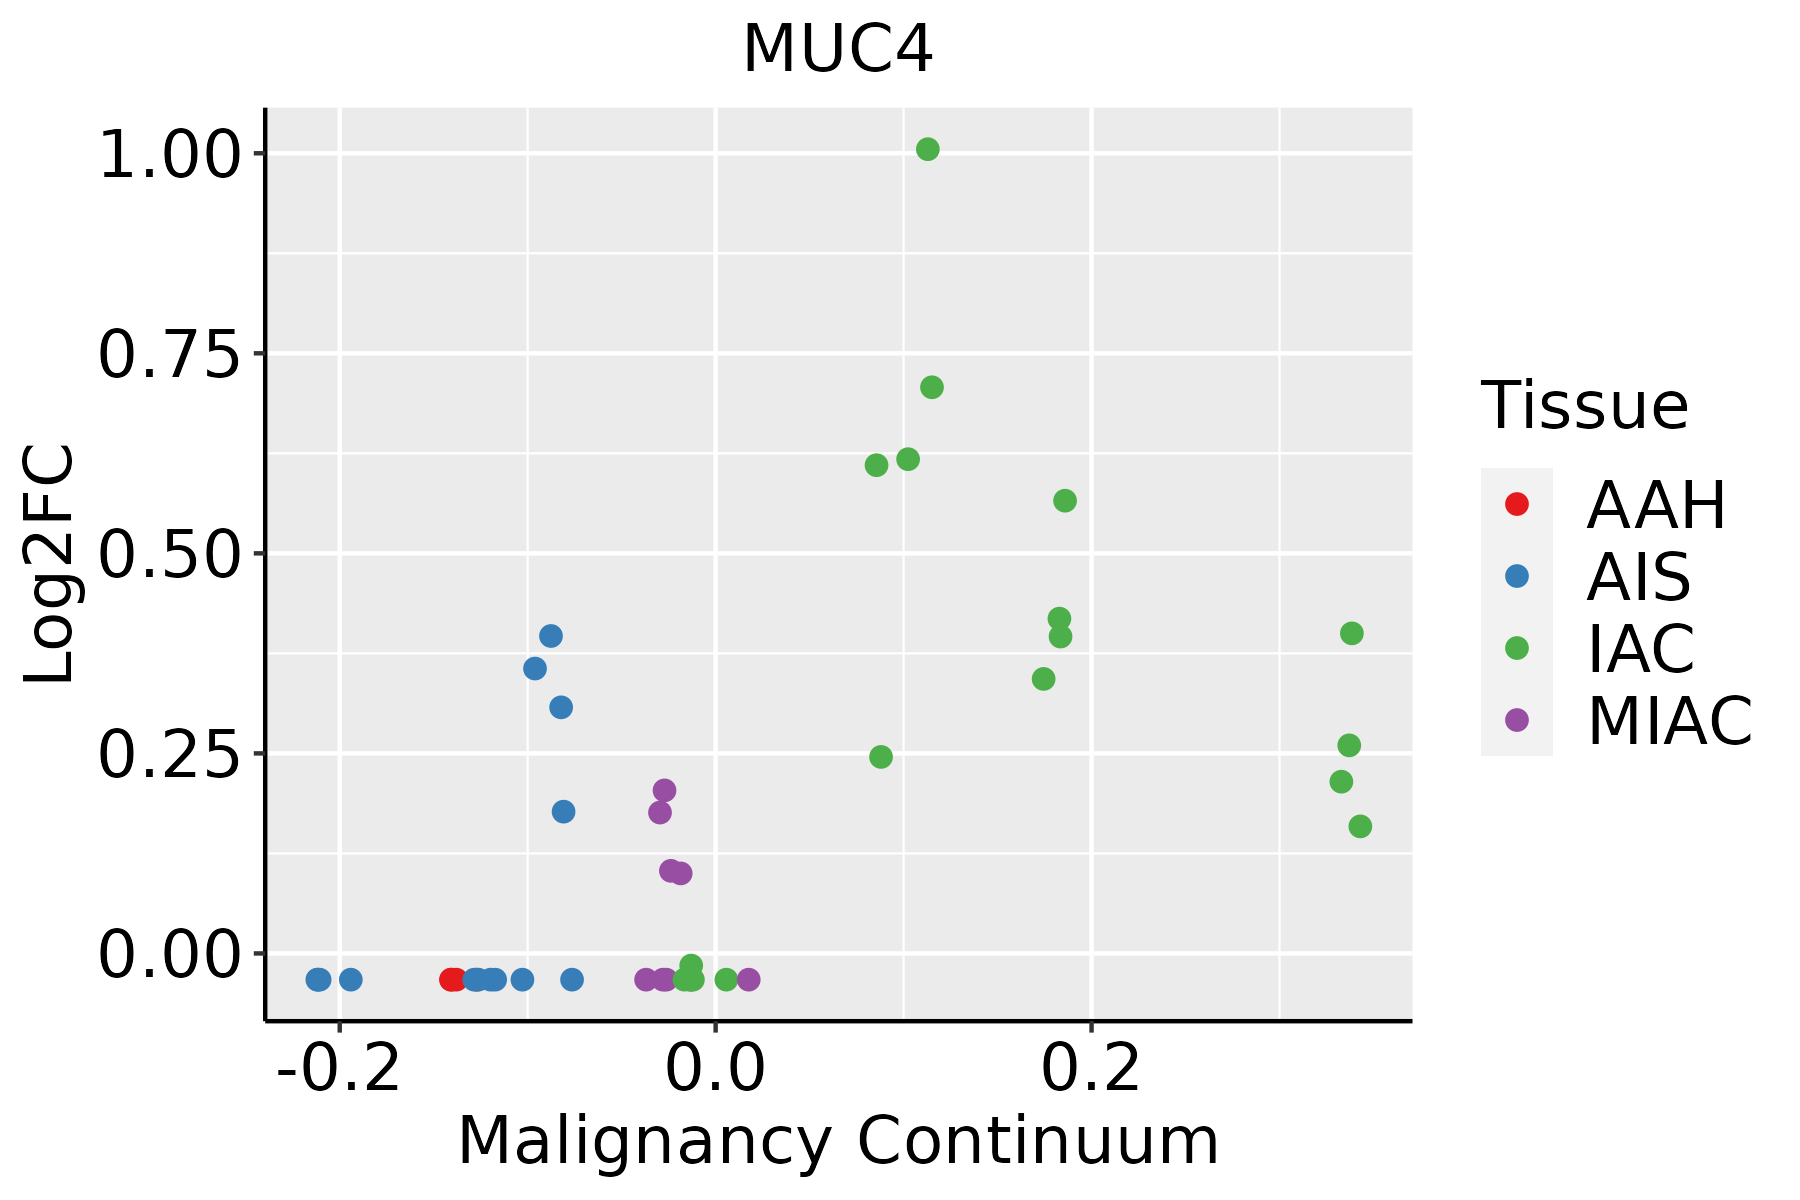 | AAH: Atypical adenomatous hyperplasia |
| AIS: Adenocarcinoma in situ | ||
| IAC: Invasive lung adenocarcinoma | ||
| MIA: Minimally invasive adenocarcinoma | ||
| Oral Cavity | 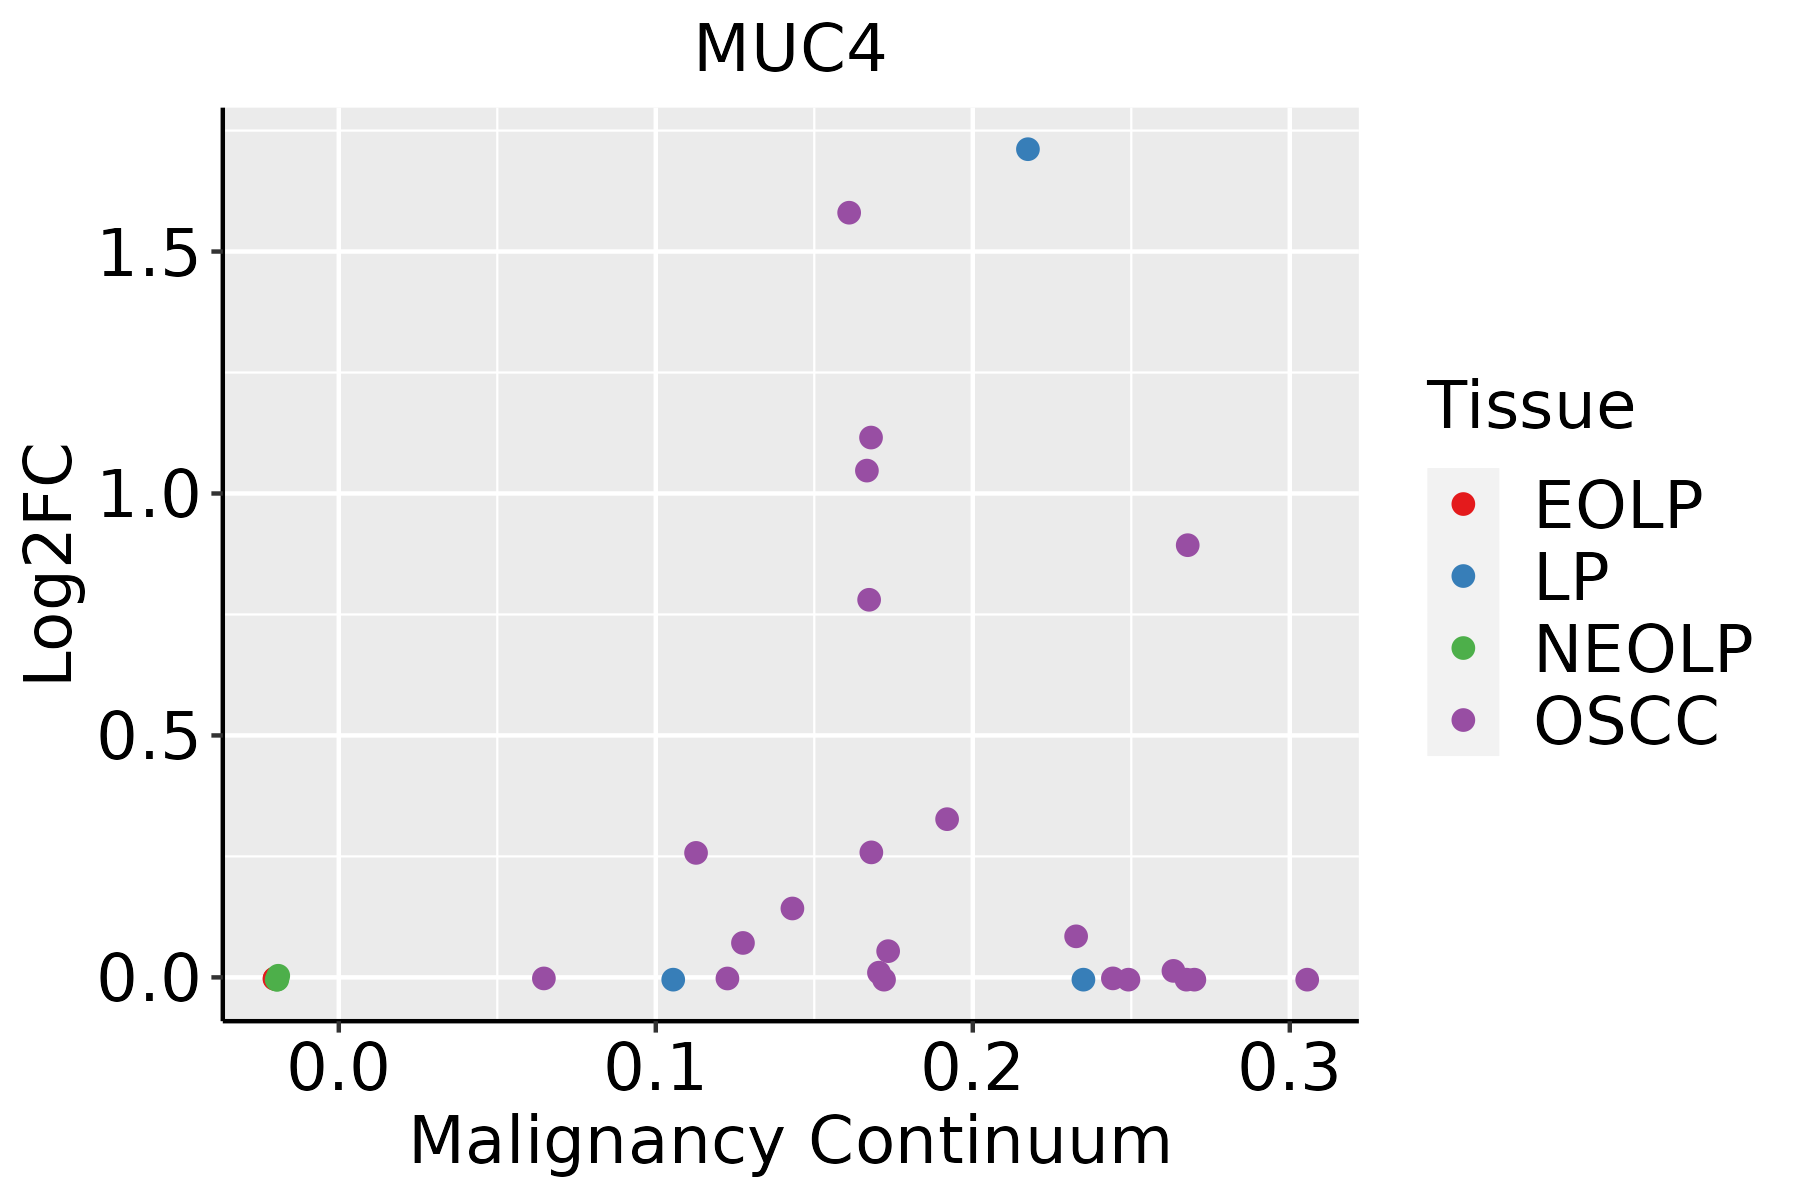 | EOLP: Erosive Oral lichen planus |
| LP: leukoplakia | ||
| NEOLP: Non-erosive oral lichen planus | ||
| OSCC: Oral squamous cell carcinoma |
| ∗log2FC in expression of this searched gene in stem-like cells from each diseased tissue sample relative to stem-like cells in normal samples in each tissue plotted against the malignancy continuum. Samples are colored based on if they are from different disease stage. |
Top |
Malignant transformation related pathway analysis |
| Find out the enriched GO biological processes and KEGG pathways involved in transition from healthy to precancer to cancer |
| Tissue | Disease Stage | Enriched GO biological Processes |
| Colorectum | AD |  |
| Colorectum | SER |  |
| Colorectum | MSS |  |
| Colorectum | MSI-H |  |
| Colorectum | FAP |  |
| ∗Top 15 enriched GO BP terms are showed in the bar plot of each disease state in each tissue. Each row represents a significant GO biological process which is colored according to the -log10(p.adjust). |
| Page: 1 2 3 4 5 6 7 8 9 |
| GO ID | Tissue | Disease Stage | Description | Gene Ratio | Bg Ratio | pvalue | p.adjust | Count |
| GO:00315898 | Cervix | CC | cell-substrate adhesion | 96/2311 | 363/18723 | 1.48e-13 | 8.85e-11 | 96 |
| GO:00071608 | Cervix | CC | cell-matrix adhesion | 60/2311 | 233/18723 | 1.58e-08 | 1.23e-06 | 60 |
| GO:00018949 | Cervix | CC | tissue homeostasis | 57/2311 | 268/18723 | 2.43e-05 | 4.21e-04 | 57 |
| GO:00602498 | Cervix | CC | anatomical structure homeostasis | 63/2311 | 314/18723 | 6.03e-05 | 8.68e-04 | 63 |
| GO:000189414 | Cervix | HSIL_HPV | tissue homeostasis | 25/737 | 268/18723 | 6.17e-05 | 1.46e-03 | 25 |
| GO:003158914 | Cervix | HSIL_HPV | cell-substrate adhesion | 30/737 | 363/18723 | 1.12e-04 | 2.34e-03 | 30 |
| GO:006024913 | Cervix | HSIL_HPV | anatomical structure homeostasis | 25/737 | 314/18723 | 7.04e-04 | 9.40e-03 | 25 |
| GO:000189424 | Cervix | N_HPV | tissue homeostasis | 23/534 | 268/18723 | 2.86e-06 | 1.24e-04 | 23 |
| GO:006024923 | Cervix | N_HPV | anatomical structure homeostasis | 24/534 | 314/18723 | 1.27e-05 | 4.17e-04 | 24 |
| GO:003158924 | Cervix | N_HPV | cell-substrate adhesion | 23/534 | 363/18723 | 3.24e-04 | 4.84e-03 | 23 |
| GO:000716013 | Cervix | N_HPV | cell-matrix adhesion | 14/534 | 233/18723 | 7.21e-03 | 4.74e-02 | 14 |
| GO:0031589 | Colorectum | AD | cell-substrate adhesion | 116/3918 | 363/18723 | 4.68e-07 | 1.76e-05 | 116 |
| GO:0007160 | Colorectum | AD | cell-matrix adhesion | 75/3918 | 233/18723 | 3.56e-05 | 6.45e-04 | 75 |
| GO:0060249 | Colorectum | AD | anatomical structure homeostasis | 94/3918 | 314/18723 | 9.37e-05 | 1.42e-03 | 94 |
| GO:0001894 | Colorectum | AD | tissue homeostasis | 81/3918 | 268/18723 | 1.96e-04 | 2.62e-03 | 81 |
| GO:0030277 | Colorectum | AD | maintenance of gastrointestinal epithelium | 10/3918 | 22/18723 | 8.52e-03 | 4.97e-02 | 10 |
| GO:00315891 | Colorectum | SER | cell-substrate adhesion | 86/2897 | 363/18723 | 2.36e-05 | 6.64e-04 | 86 |
| GO:00018941 | Colorectum | SER | tissue homeostasis | 66/2897 | 268/18723 | 5.87e-05 | 1.37e-03 | 66 |
| GO:00602491 | Colorectum | SER | anatomical structure homeostasis | 74/2897 | 314/18723 | 1.01e-04 | 2.13e-03 | 74 |
| GO:0022600 | Colorectum | SER | digestive system process | 29/2897 | 104/18723 | 8.57e-04 | 1.05e-02 | 29 |
| Page: 1 2 3 4 |
| Pathway ID | Tissue | Disease Stage | Description | Gene Ratio | Bg Ratio | pvalue | p.adjust | qvalue | Count |
| Page: 1 |
Top |
Cell-cell communication analysis |
| Identification of potential cell-cell interactions between two cell types and their ligand-receptor pairs for different disease states |
| Ligand | Receptor | LRpair | Pathway | Tissue | Disease Stage |
| Page: 1 |
Top |
Single-cell gene regulatory network inference analysis |
| Find out the significant the regulons (TFs) and the target genes of each regulon across cell types for different disease states |
| TF | Cell Type | Tissue | Disease Stage | Target Gene | RSS | Regulon Activity |
| ∗The dot plots of a searched regulon are shown for all cell subpopulations in each disease state of each tissue based on the regulon specific score inferred using pySCENIC and by calculating the average expression. |
| Page: 1 |
Top |
Somatic mutation of malignant transformation related genes |
| Annotation of somatic variants for genes involved in malignant transformation |
| Hugo Symbol | Variant Class | Variant Classification | dbSNP RS | HGVSc | HGVSp | HGVSp Short | SWISSPROT | BIOTYPE | SIFT | PolyPhen | Tumor Sample Barcode | Tissue | Histology | Sex | Age | Stage | Therapy Types | Drugs | Outcome |
| MUC4 | SNV | Missense_Mutation | novel | c.7444N>G | p.Leu2482Val | p.L2482V | protein_coding | tolerated_low_confidence(0.53) | benign(0.374) | TCGA-3C-AALI-01 | Breast | breast invasive carcinoma | Female | <65 | I/II | Unspecific | Poly E | Complete Response | |
| MUC4 | SNV | Missense_Mutation | c.12574N>T | p.Pro4192Ser | p.P4192S | protein_coding | tolerated_low_confidence(0.22) | benign(0.071) | TCGA-A1-A0SI-01 | Breast | breast invasive carcinoma | Female | <65 | I/II | Unknown | Unknown | SD | ||
| MUC4 | SNV | Missense_Mutation | c.404N>T | p.Ser135Leu | p.S135L | protein_coding | deleterious_low_confidence(0.01) | benign(0.316) | TCGA-A2-A0CX-01 | Breast | breast invasive carcinoma | Female | <65 | I/II | Chemotherapy | adriamycin | SD | ||
| MUC4 | SNV | Missense_Mutation | c.14413N>T | p.Asp4805Tyr | p.D4805Y | protein_coding | deleterious_low_confidence(0.03) | probably_damaging(0.996) | TCGA-A2-A0EN-01 | Breast | breast invasive carcinoma | Female | >=65 | I/II | Hormone Therapy | tamoxiphen | SD | ||
| MUC4 | SNV | Missense_Mutation | novel | c.8440N>A | p.Ala2814Thr | p.A2814T | protein_coding | tolerated_low_confidence(0.73) | benign(0.003) | TCGA-A2-A0SW-01 | Breast | breast invasive carcinoma | Female | >=65 | III/IV | Hormone Therapy | arimidex | PD | |
| MUC4 | SNV | Missense_Mutation | novel | c.4949N>C | p.His1650Pro | p.H1650P | protein_coding | tolerated_low_confidence(0.82) | benign(0.234) | TCGA-A2-A0SW-01 | Breast | breast invasive carcinoma | Female | >=65 | III/IV | Hormone Therapy | arimidex | PD | |
| MUC4 | SNV | Missense_Mutation | rs199531700 | c.9349N>G | p.His3117Asp | p.H3117D | protein_coding | tolerated_low_confidence(0.55) | benign(0.234) | TCGA-A2-A0T2-01 | Breast | breast invasive carcinoma | Female | >=65 | III/IV | Chemotherapy | xeloda | PD | |
| MUC4 | SNV | Missense_Mutation | c.2387N>A | p.Arg796Gln | p.R796Q | protein_coding | tolerated_low_confidence(0.2) | benign(0.234) | TCGA-A2-A0YG-01 | Breast | breast invasive carcinoma | Female | <65 | III/IV | Chemotherapy | cytoxan | SD | ||
| MUC4 | SNV | Missense_Mutation | novel | c.3548C>T | p.Thr1183Met | p.T1183M | protein_coding | deleterious_low_confidence(0) | possibly_damaging(0.811) | TCGA-A2-A1G1-01 | Breast | breast invasive carcinoma | Female | >=65 | I/II | Unknown | Unknown | SD | |
| MUC4 | SNV | Missense_Mutation | novel | c.8254N>T | p.Pro2752Ser | p.P2752S | protein_coding | deleterious_low_confidence(0.04) | possibly_damaging(0.65) | TCGA-A2-A25B-01 | Breast | breast invasive carcinoma | Female | <65 | I/II | Chemotherapy | taxotere | PD |
| Page: 1 2 3 4 5 6 7 8 9 10 11 12 13 14 15 16 17 18 19 20 21 22 23 24 25 26 27 28 29 30 31 32 33 34 35 36 37 38 39 40 41 42 43 44 45 46 47 48 49 50 51 52 |
Top |
Related drugs of malignant transformation related genes |
| Identification of chemicals and drugs interact with genes involved in malignant transfromation |
| (DGIdb 4.0) |
| Entrez ID | Symbol | Category | Interaction Types | Drug Claim Name | Drug Name | PMIDs |
| Page: 1 |

Copyright 2023-Present -The University of Texas Health Science Center at Houston |