
|
|||||
|
 | |
| |
| |
| |
| |
| |
|
Gene: MUC21 |
Gene summary for MUC21 |
| Gene information | Species | Human | Gene symbol | MUC21 | Gene ID | 394263 |
| Gene name | mucin 21, cell surface associated | |
| Gene Alias | C6orf205 | |
| Cytomap | 6p21.33 | |
| Gene Type | protein-coding | GO ID | GO:0007155 | UniProtAcc | Q5SSG8 |
Top |
Malignant transformation analysis |
| Identification of the aberrant gene expression in precancerous and cancerous lesions by comparing the gene expression of stem-like cells in diseased tissues with normal stem cells |
| Entrez ID | Symbol | Replicates | Species | Organ | Tissue | Adj P-value | Log2FC | Malignancy |
| 394263 | MUC21 | RNA-P17T-P17T-2 | Human | Lung | IAC | 2.13e-03 | 5.60e-01 | 0.3371 |
| 394263 | MUC21 | RNA-P17T-P17T-4 | Human | Lung | IAC | 1.48e-03 | 5.67e-01 | 0.343 |
| Page: 1 |
| Tissue | Expression Dynamics | Abbreviation |
| Lung | 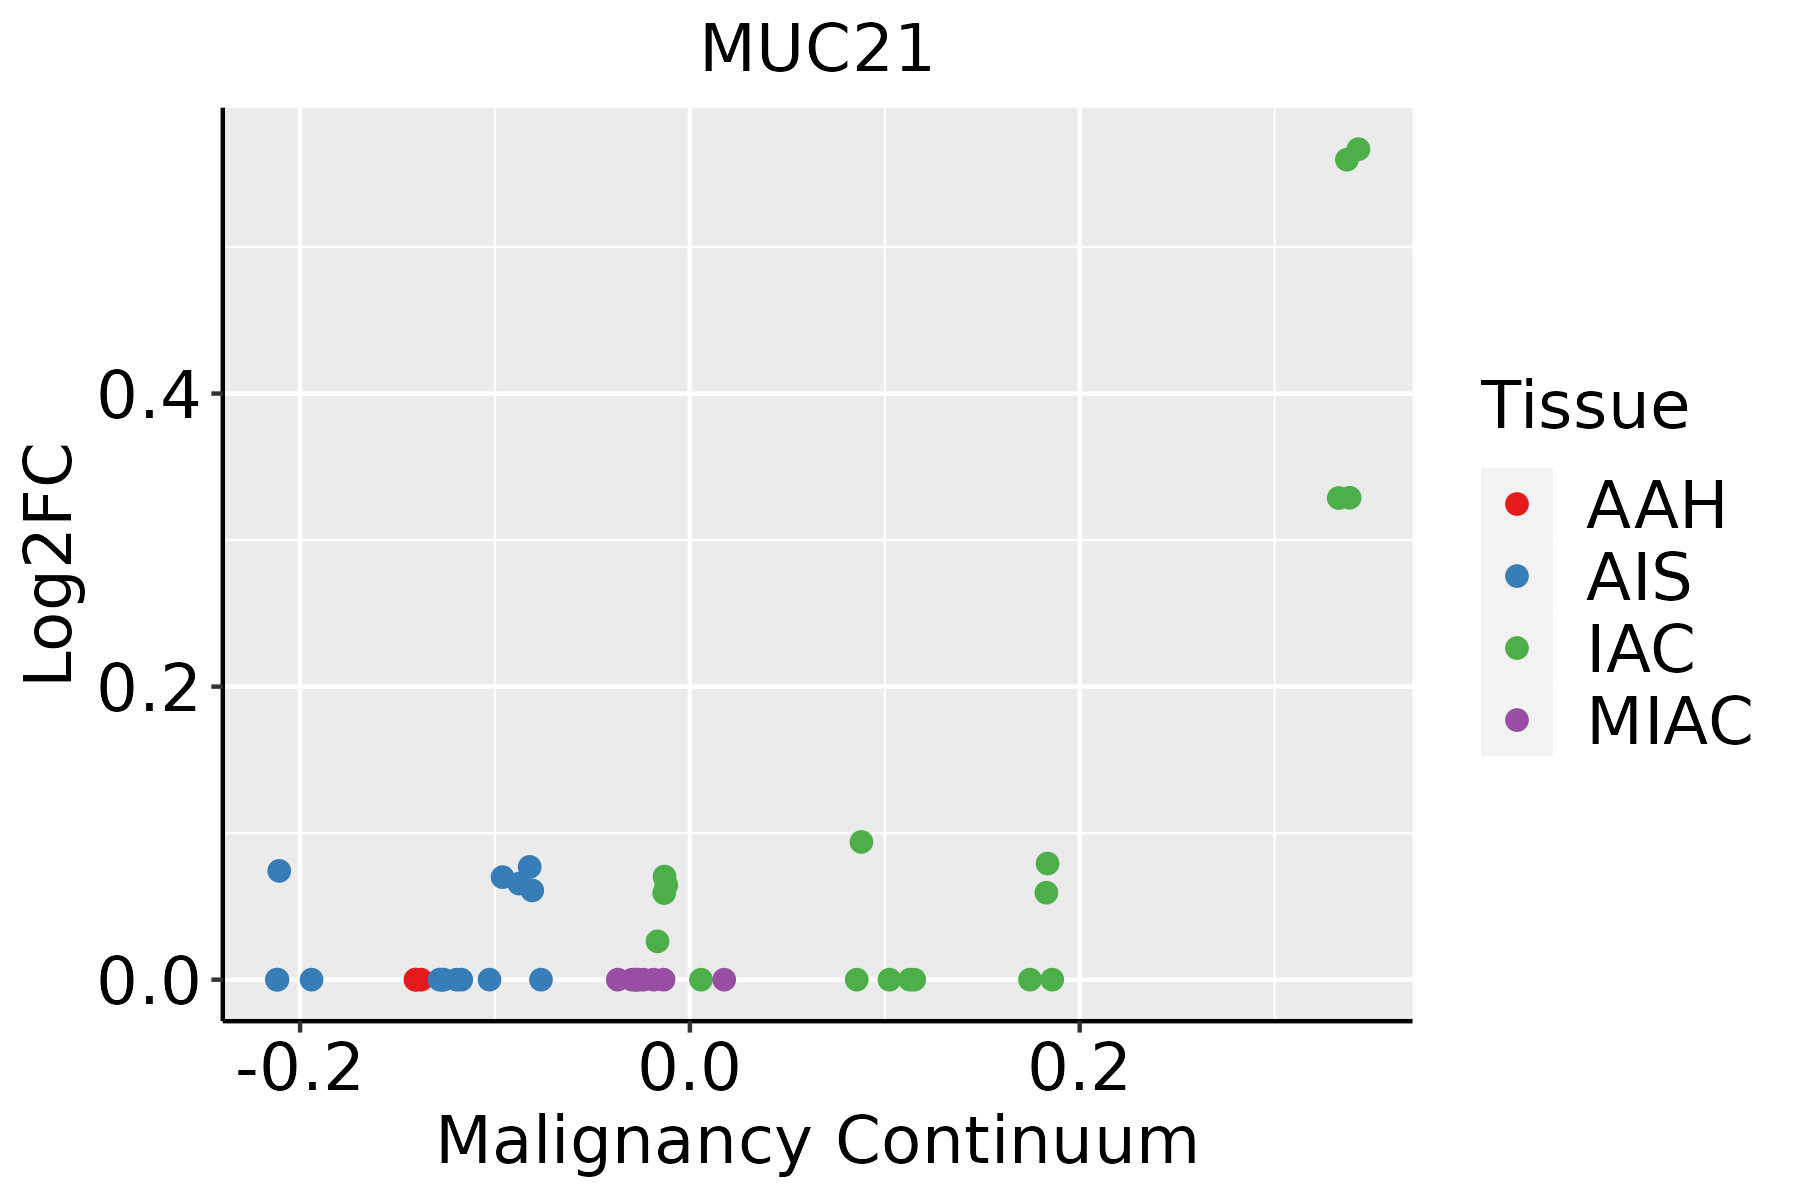 | AAH: Atypical adenomatous hyperplasia |
| AIS: Adenocarcinoma in situ | ||
| IAC: Invasive lung adenocarcinoma | ||
| MIA: Minimally invasive adenocarcinoma |
| ∗log2FC in expression of this searched gene in stem-like cells from each diseased tissue sample relative to stem-like cells in normal samples in each tissue plotted against the malignancy continuum. Samples are colored based on if they are from different disease stage. |
Top |
Malignant transformation related pathway analysis |
| Find out the enriched GO biological processes and KEGG pathways involved in transition from healthy to precancer to cancer |
| Tissue | Disease Stage | Enriched GO biological Processes |
| Colorectum | AD |  |
| Colorectum | SER |  |
| Colorectum | MSS |  |
| Colorectum | MSI-H |  |
| Colorectum | FAP |  |
| ∗Top 15 enriched GO BP terms are showed in the bar plot of each disease state in each tissue. Each row represents a significant GO biological process which is colored according to the -log10(p.adjust). |
| Page: 1 2 3 4 5 6 7 8 9 |
| GO ID | Tissue | Disease Stage | Description | Gene Ratio | Bg Ratio | pvalue | p.adjust | Count |
| GO:00224078 | Lung | IAC | regulation of cell-cell adhesion | 76/2061 | 448/18723 | 8.16e-05 | 1.68e-03 | 76 |
| Page: 1 |
| Pathway ID | Tissue | Disease Stage | Description | Gene Ratio | Bg Ratio | pvalue | p.adjust | qvalue | Count |
| Page: 1 |
Top |
Cell-cell communication analysis |
| Identification of potential cell-cell interactions between two cell types and their ligand-receptor pairs for different disease states |
| Ligand | Receptor | LRpair | Pathway | Tissue | Disease Stage |
| Page: 1 |
Top |
Single-cell gene regulatory network inference analysis |
| Find out the significant the regulons (TFs) and the target genes of each regulon across cell types for different disease states |
| TF | Cell Type | Tissue | Disease Stage | Target Gene | RSS | Regulon Activity |
| ∗The dot plots of a searched regulon are shown for all cell subpopulations in each disease state of each tissue based on the regulon specific score inferred using pySCENIC and by calculating the average expression. |
| Page: 1 |
Top |
Somatic mutation of malignant transformation related genes |
| Annotation of somatic variants for genes involved in malignant transformation |
| Hugo Symbol | Variant Class | Variant Classification | dbSNP RS | HGVSc | HGVSp | HGVSp Short | SWISSPROT | BIOTYPE | SIFT | PolyPhen | Tumor Sample Barcode | Tissue | Histology | Sex | Age | Stage | Therapy Types | Drugs | Outcome |
| MUC21 | SNV | Missense_Mutation | c.399N>A | p.Ser133Arg | p.S133R | Q5SSG8 | protein_coding | deleterious(0.04) | possibly_damaging(0.733) | TCGA-A1-A0SH-01 | Breast | breast invasive carcinoma | Female | <65 | I/II | Chemotherapy | tc | SD | |
| MUC21 | SNV | Missense_Mutation | rs148827807 | c.571A>G | p.Arg191Gly | p.R191G | Q5SSG8 | protein_coding | tolerated(1) | benign(0) | TCGA-BH-A0H5-01 | Breast | breast invasive carcinoma | Female | <65 | I/II | Chemotherapy | cytoxan | CR |
| MUC21 | SNV | Missense_Mutation | rs552812759 | c.648N>C | p.Arg216Ser | p.R216S | Q5SSG8 | protein_coding | tolerated(1) | benign(0) | TCGA-BH-A1FC-01 | Breast | breast invasive carcinoma | Female | >=65 | I/II | Unknown | Unknown | SD |
| MUC21 | SNV | Missense_Mutation | rs552812759 | c.648N>C | p.Arg216Ser | p.R216S | Q5SSG8 | protein_coding | tolerated(1) | benign(0) | TCGA-C8-A1HO-01 | Breast | breast invasive carcinoma | Female | <65 | III/IV | Chemotherapy | 5-fluorouracil | CR |
| MUC21 | SNV | Missense_Mutation | rs767618572 | c.529G>A | p.Ala177Thr | p.A177T | Q5SSG8 | protein_coding | tolerated(0.46) | benign(0.001) | TCGA-EW-A1J1-01 | Breast | breast invasive carcinoma | Female | <65 | I/II | Chemotherapy | taxotere | SD |
| MUC21 | SNV | Missense_Mutation | rs753696307 | c.530C>T | p.Ala177Val | p.A177V | Q5SSG8 | protein_coding | tolerated(0.08) | benign(0) | TCGA-EW-A1J1-01 | Breast | breast invasive carcinoma | Female | <65 | I/II | Chemotherapy | taxotere | SD |
| MUC21 | insertion | Frame_Shift_Ins | novel | c.791_792insTAAGGTGTGTACTCTCCTGAGAGACGCTTCCTTGGAA | p.Ser265LysfsTer22 | p.S265Kfs*22 | Q5SSG8 | protein_coding | TCGA-AN-A0FS-01 | Breast | breast invasive carcinoma | Female | <65 | I/II | Unknown | Unknown | SD | ||
| MUC21 | SNV | Missense_Mutation | rs780528569 | c.562G>A | p.Val188Met | p.V188M | Q5SSG8 | protein_coding | tolerated(0.06) | benign(0.007) | TCGA-A6-6653-01 | Colorectum | colon adenocarcinoma | Male | >=65 | I/II | Unknown | Unknown | SD |
| MUC21 | SNV | Missense_Mutation | c.758N>A | p.Gly253Asp | p.G253D | Q5SSG8 | protein_coding | deleterious(0.03) | benign(0.037) | TCGA-AA-3678-01 | Colorectum | colon adenocarcinoma | Female | <65 | III/IV | Chemotherapy | folinic | CR | |
| MUC21 | SNV | Missense_Mutation | c.718N>A | p.Ala240Thr | p.A240T | Q5SSG8 | protein_coding | tolerated(0.17) | benign(0.146) | TCGA-AA-A01P-01 | Colorectum | colon adenocarcinoma | Female | >=65 | III/IV | Unknown | Unknown | PD |
| Page: 1 2 3 4 5 |
Top |
Related drugs of malignant transformation related genes |
| Identification of chemicals and drugs interact with genes involved in malignant transfromation |
| (DGIdb 4.0) |
| Entrez ID | Symbol | Category | Interaction Types | Drug Claim Name | Drug Name | PMIDs |
| Page: 1 |

Copyright 2023-Present -The University of Texas Health Science Center at Houston |