
|
|||||
|
 | |
| |
| |
| |
| |
| |
|
Gene: MUC17 |
Gene summary for MUC17 |
| Gene information | Species | Human | Gene symbol | MUC17 | Gene ID | 140453 |
| Gene name | mucin 17, cell surface associated | |
| Gene Alias | MUC-17 | |
| Cytomap | 7q22.1 | |
| Gene Type | protein-coding | GO ID | GO:0008150 | UniProtAcc | Q685J3 |
Top |
Malignant transformation analysis |
| Identification of the aberrant gene expression in precancerous and cancerous lesions by comparing the gene expression of stem-like cells in diseased tissues with normal stem cells |
| Entrez ID | Symbol | Replicates | Species | Organ | Tissue | Adj P-value | Log2FC | Malignancy |
| 140453 | MUC17 | HTA11_2487_2000001011 | Human | Colorectum | SER | 3.48e-06 | 1.16e+00 | -0.1808 |
| 140453 | MUC17 | HTA11_1938_2000001011 | Human | Colorectum | AD | 2.03e-05 | 4.70e-01 | -0.0811 |
| 140453 | MUC17 | HTA11_411_2000001011 | Human | Colorectum | SER | 2.93e-04 | 2.05e+00 | -0.2602 |
| 140453 | MUC17 | HTA11_2112_2000001011 | Human | Colorectum | SER | 2.40e-05 | 1.44e+00 | -0.2196 |
| 140453 | MUC17 | HTA11_7696_3000711011 | Human | Colorectum | AD | 2.12e-02 | -1.38e-01 | 0.0674 |
| 140453 | MUC17 | HTA11_99999971662_82457 | Human | Colorectum | MSS | 2.38e-03 | -1.42e-01 | 0.3859 |
| 140453 | MUC17 | A015-C-203 | Human | Colorectum | FAP | 2.05e-02 | -1.36e-01 | -0.1294 |
| 140453 | MUC17 | A002-C-201 | Human | Colorectum | FAP | 1.71e-02 | -1.46e-01 | 0.0324 |
| 140453 | MUC17 | A002-C-203 | Human | Colorectum | FAP | 7.57e-03 | -1.37e-01 | 0.2786 |
| 140453 | MUC17 | A001-C-108 | Human | Colorectum | FAP | 1.92e-04 | -1.40e-01 | -0.0272 |
| 140453 | MUC17 | A015-C-106 | Human | Colorectum | FAP | 3.19e-04 | -1.20e-01 | -0.0511 |
| 140453 | MUC17 | A015-C-202 | Human | Colorectum | FAP | 1.83e-02 | -1.46e-01 | -0.0849 |
| 140453 | MUC17 | A001-C-203 | Human | Colorectum | FAP | 3.34e-02 | -1.31e-01 | -0.0481 |
| 140453 | MUC17 | A002-C-116 | Human | Colorectum | FAP | 2.00e-05 | -1.39e-01 | -0.0452 |
| 140453 | MUC17 | F034 | Human | Colorectum | FAP | 4.21e-02 | -1.31e-01 | -0.0665 |
| 140453 | MUC17 | CRC-3-11773 | Human | Colorectum | CRC | 2.60e-02 | -1.15e-01 | 0.2564 |
| 140453 | MUC17 | Pat01-B | Human | Stomach | GC | 5.32e-84 | 1.37e+00 | 0.5754 |
| 140453 | MUC17 | Pat02-B | Human | Stomach | GC | 1.54e-25 | 5.48e-01 | 0.0368 |
| 140453 | MUC17 | Pat03-B | Human | Stomach | GC | 1.41e-42 | 1.00e+00 | 0.3693 |
| 140453 | MUC17 | Pat05-B | Human | Stomach | GC | 6.46e-04 | 2.62e-01 | -0.0353 |
| Page: 1 2 |
| Tissue | Expression Dynamics | Abbreviation |
| Colorectum (GSE201348) |  | FAP: Familial adenomatous polyposis |
| CRC: Colorectal cancer | ||
| Colorectum (HTA11) |  | AD: Adenomas |
| SER: Sessile serrated lesions | ||
| MSI-H: Microsatellite-high colorectal cancer | ||
| MSS: Microsatellite stable colorectal cancer | ||
| GC | 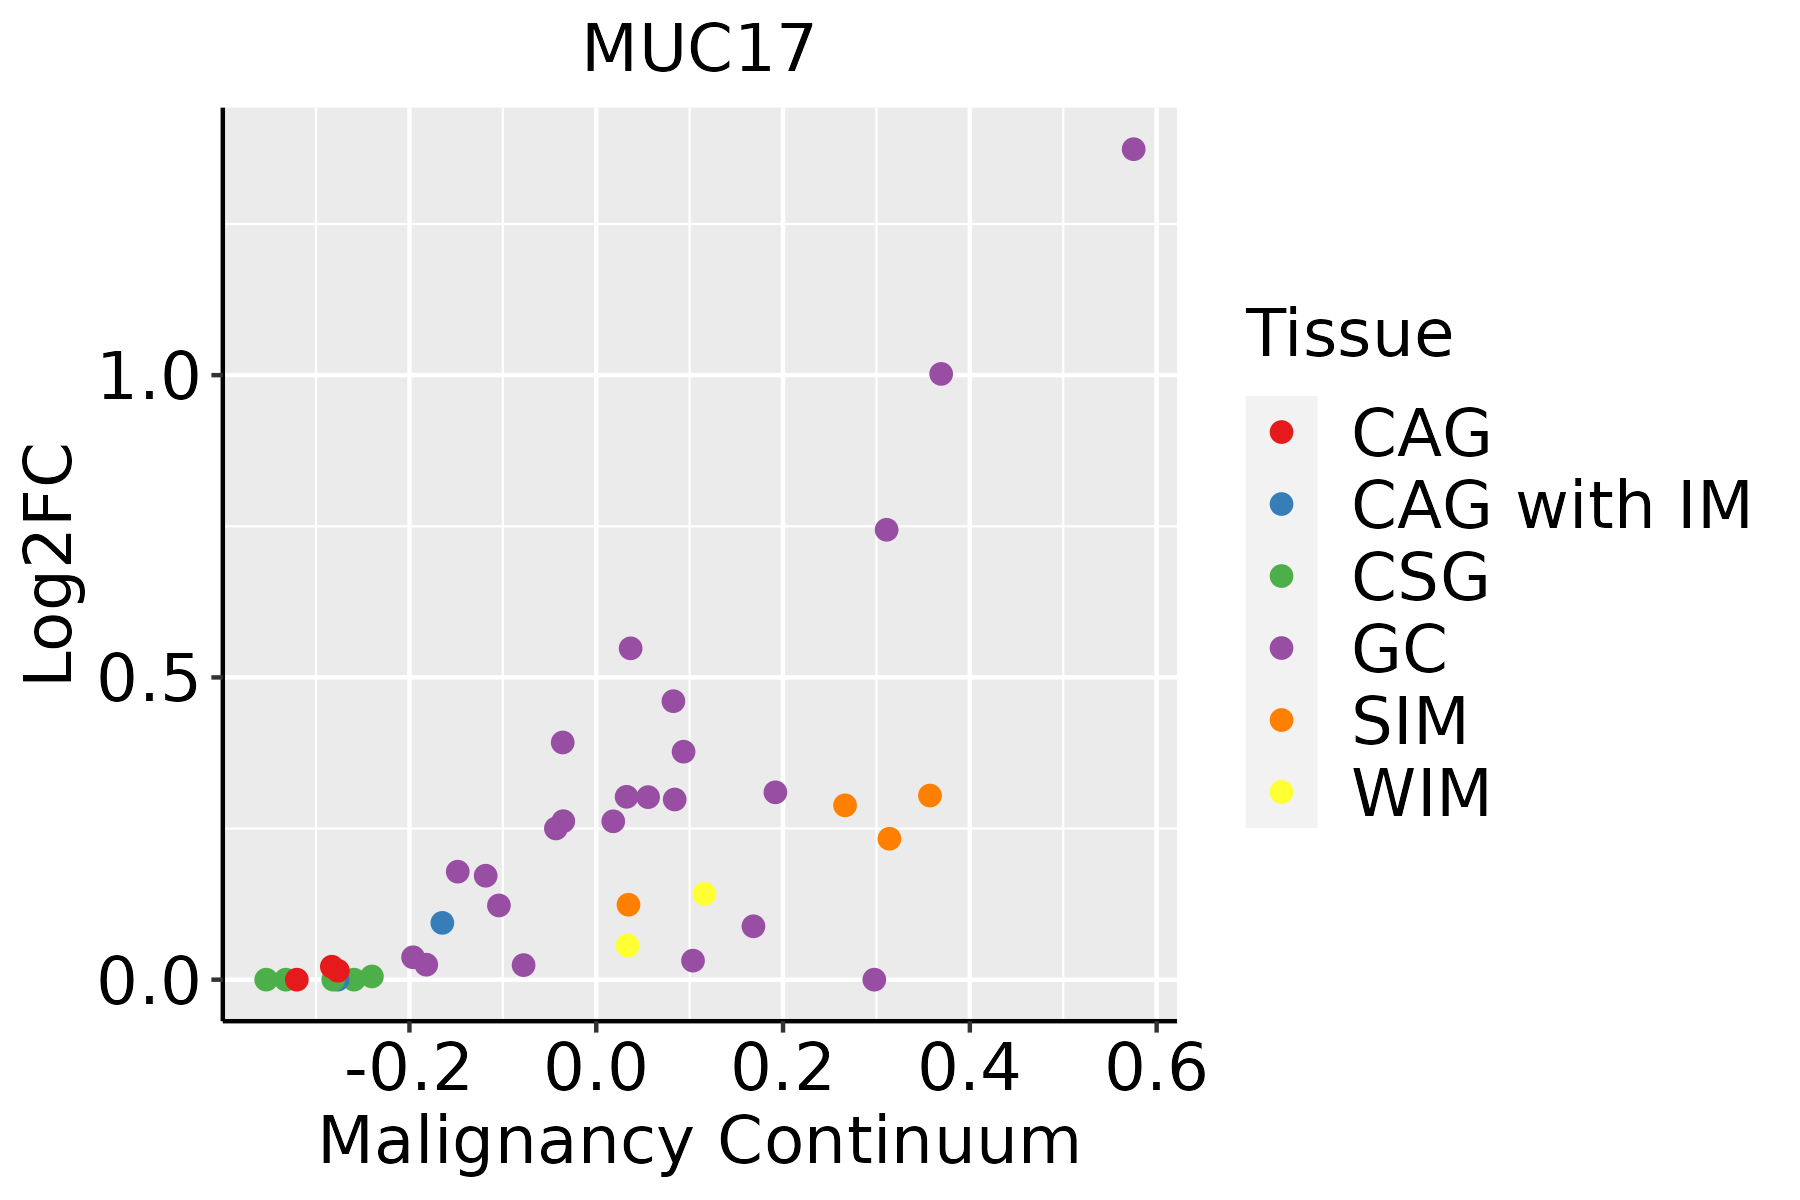 | CAG: Chronic atrophic gastritis |
| CAG with IM: Chronic atrophic gastritis with intestinal metaplasia | ||
| CSG: Chronic superficial gastritis | ||
| GC: Gastric cancer | ||
| SIM: Severe intestinal metaplasia | ||
| WIM: Wild intestinal metaplasia |
| ∗log2FC in expression of this searched gene in stem-like cells from each diseased tissue sample relative to stem-like cells in normal samples in each tissue plotted against the malignancy continuum. Samples are colored based on if they are from different disease stage. |
Top |
Malignant transformation related pathway analysis |
| Find out the enriched GO biological processes and KEGG pathways involved in transition from healthy to precancer to cancer |
| Tissue | Disease Stage | Enriched GO biological Processes |
| Colorectum | AD |  |
| Colorectum | SER |  |
| Colorectum | MSS |  |
| Colorectum | MSI-H |  |
| Colorectum | FAP |  |
| ∗Top 15 enriched GO BP terms are showed in the bar plot of each disease state in each tissue. Each row represents a significant GO biological process which is colored according to the -log10(p.adjust). |
| Page: 1 2 3 4 5 6 7 8 9 |
| GO ID | Tissue | Disease Stage | Description | Gene Ratio | Bg Ratio | pvalue | p.adjust | Count |
| Page: 1 |
| Pathway ID | Tissue | Disease Stage | Description | Gene Ratio | Bg Ratio | pvalue | p.adjust | qvalue | Count |
| Page: 1 |
Top |
Cell-cell communication analysis |
| Identification of potential cell-cell interactions between two cell types and their ligand-receptor pairs for different disease states |
| Ligand | Receptor | LRpair | Pathway | Tissue | Disease Stage |
| Page: 1 |
Top |
Single-cell gene regulatory network inference analysis |
| Find out the significant the regulons (TFs) and the target genes of each regulon across cell types for different disease states |
| TF | Cell Type | Tissue | Disease Stage | Target Gene | RSS | Regulon Activity |
| ∗The dot plots of a searched regulon are shown for all cell subpopulations in each disease state of each tissue based on the regulon specific score inferred using pySCENIC and by calculating the average expression. |
| Page: 1 |
Top |
Somatic mutation of malignant transformation related genes |
| Annotation of somatic variants for genes involved in malignant transformation |
| Hugo Symbol | Variant Class | Variant Classification | dbSNP RS | HGVSc | HGVSp | HGVSp Short | SWISSPROT | BIOTYPE | SIFT | PolyPhen | Tumor Sample Barcode | Tissue | Histology | Sex | Age | Stage | Therapy Types | Drugs | Outcome |
| MUC17 | SNV | Missense_Mutation | novel | c.4214C>G | p.Thr1405Ser | p.T1405S | Q685J3 | protein_coding | tolerated(0.29) | possibly_damaging(0.855) | TCGA-3C-AALI-01 | Breast | breast invasive carcinoma | Female | <65 | I/II | Unspecific | Poly E | Complete Response |
| MUC17 | SNV | Missense_Mutation | c.10118N>T | p.Thr3373Ile | p.T3373I | Q685J3 | protein_coding | tolerated(0.08) | probably_damaging(0.986) | TCGA-A1-A0SO-01 | Breast | breast invasive carcinoma | Female | >=65 | I/II | Chemotherapy | SD | ||
| MUC17 | SNV | Missense_Mutation | rs761171920 | c.9971N>C | p.Ile3324Thr | p.I3324T | Q685J3 | protein_coding | tolerated(1) | benign(0.009) | TCGA-A2-A04P-01 | Breast | breast invasive carcinoma | Female | <65 | III/IV | Chemotherapy | taxol | PD |
| MUC17 | SNV | Missense_Mutation | c.10795N>T | p.Pro3599Ser | p.P3599S | Q685J3 | protein_coding | tolerated(0.2) | possibly_damaging(0.594) | TCGA-A2-A04W-01 | Breast | breast invasive carcinoma | Female | <65 | I/II | Chemotherapy | cytoxan | SD | |
| MUC17 | SNV | Missense_Mutation | c.13264N>G | p.Arg4422Gly | p.R4422G | Q685J3 | protein_coding | deleterious(0.01) | possibly_damaging(0.759) | TCGA-A2-A0D1-01 | Breast | breast invasive carcinoma | Female | >=65 | I/II | Chemotherapy | taxotere | SD | |
| MUC17 | SNV | Missense_Mutation | rs752029816 | c.8390N>G | p.Val2797Gly | p.V2797G | Q685J3 | protein_coding | tolerated(0.59) | benign(0.001) | TCGA-A2-A3XY-01 | Breast | breast invasive carcinoma | Female | <65 | I/II | Chemotherapy | adriamycin | PD |
| MUC17 | SNV | Missense_Mutation | rs374087771 | c.13244N>A | p.Arg4415His | p.R4415H | Q685J3 | protein_coding | tolerated(0.52) | benign(0.038) | TCGA-A8-A06Q-01 | Breast | breast invasive carcinoma | Female | <65 | III/IV | Unknown | Unknown | SD |
| MUC17 | SNV | Missense_Mutation | rs749795865 | c.12721C>T | p.Arg4241Cys | p.R4241C | Q685J3 | protein_coding | deleterious(0) | possibly_damaging(0.668) | TCGA-A8-A08L-01 | Breast | breast invasive carcinoma | Female | >=65 | III/IV | Unknown | Unknown | SD |
| MUC17 | SNV | Missense_Mutation | c.1826C>T | p.Ser609Leu | p.S609L | Q685J3 | protein_coding | deleterious(0) | possibly_damaging(0.819) | TCGA-A8-A095-01 | Breast | breast invasive carcinoma | Female | <65 | I/II | Chemotherapy | 5-fluorouracil | CR | |
| MUC17 | SNV | Missense_Mutation | c.6921N>A | p.Asn2307Lys | p.N2307K | Q685J3 | protein_coding | deleterious(0) | benign(0.005) | TCGA-A8-A09M-01 | Breast | breast invasive carcinoma | Female | >=65 | III/IV | Chemotherapy | paclitaxel | CR |
| Page: 1 2 3 4 5 6 7 8 9 10 11 12 13 14 15 16 17 18 19 20 21 22 23 24 25 26 27 28 29 30 31 32 33 34 35 36 37 38 39 40 41 42 43 44 45 46 47 48 49 50 51 52 53 54 55 56 57 58 59 60 61 62 63 64 65 66 67 68 69 70 71 72 |
Top |
Related drugs of malignant transformation related genes |
| Identification of chemicals and drugs interact with genes involved in malignant transfromation |
| (DGIdb 4.0) |
| Entrez ID | Symbol | Category | Interaction Types | Drug Claim Name | Drug Name | PMIDs |
| Page: 1 |

Copyright 2023-Present -The University of Texas Health Science Center at Houston |