
|
|||||
|
 | |
| |
| |
| |
| |
| |
|
Gene: MUC15 |
Gene summary for MUC15 |
| Gene information | Species | Human | Gene symbol | MUC15 | Gene ID | 143662 |
| Gene name | mucin 15, cell surface associated | |
| Gene Alias | MUC-15 | |
| Cytomap | 11p14.2 | |
| Gene Type | protein-coding | GO ID | GO:0005575 | UniProtAcc | A0A0A0MT67 |
Top |
Malignant transformation analysis |
| Identification of the aberrant gene expression in precancerous and cancerous lesions by comparing the gene expression of stem-like cells in diseased tissues with normal stem cells |
| Entrez ID | Symbol | Replicates | Species | Organ | Tissue | Adj P-value | Log2FC | Malignancy |
| 143662 | MUC15 | HCC1 | Human | Liver | HCC | 3.64e-12 | 3.73e+00 | 0.5336 |
| 143662 | MUC15 | HCC2 | Human | Liver | HCC | 5.11e-07 | 2.48e+00 | 0.5341 |
| 143662 | MUC15 | Adj_PTCwithHT_6 | Human | Thyroid | HT | 8.61e-17 | -5.45e-01 | 0.02 |
| 143662 | MUC15 | Adj_PTCwithHT_8 | Human | Thyroid | HT | 6.56e-06 | -4.91e-01 | 0.0267 |
| 143662 | MUC15 | PTCwithHT_1 | Human | Thyroid | HT | 2.55e-03 | -5.51e-01 | 0.0238 |
| 143662 | MUC15 | PTCwithHT_6 | Human | Thyroid | HT | 3.25e-14 | -5.20e-01 | 0.02 |
| 143662 | MUC15 | PTCwithHT_8 | Human | Thyroid | HT | 2.81e-10 | -4.42e-01 | 0.0351 |
| 143662 | MUC15 | PTCwithoutHT_2 | Human | Thyroid | PTC | 9.42e-10 | -4.12e-01 | 0.0419 |
| 143662 | MUC15 | male-WTA | Human | Thyroid | PTC | 1.28e-38 | -8.49e-03 | 0.1037 |
| 143662 | MUC15 | PTC01 | Human | Thyroid | PTC | 3.03e-12 | 7.88e-01 | 0.1899 |
| 143662 | MUC15 | PTC05 | Human | Thyroid | PTC | 1.06e-27 | 1.89e+00 | 0.2065 |
| 143662 | MUC15 | PTC06 | Human | Thyroid | PTC | 1.46e-18 | 8.20e-01 | 0.2057 |
| 143662 | MUC15 | PTC07 | Human | Thyroid | PTC | 2.88e-39 | 1.30e+00 | 0.2044 |
| 143662 | MUC15 | ATC09 | Human | Thyroid | ATC | 1.53e-07 | -2.70e-01 | 0.2871 |
| 143662 | MUC15 | ATC12 | Human | Thyroid | ATC | 3.57e-20 | -5.51e-01 | 0.34 |
| 143662 | MUC15 | ATC13 | Human | Thyroid | ATC | 3.57e-20 | -5.50e-01 | 0.34 |
| 143662 | MUC15 | ATC1 | Human | Thyroid | ATC | 2.98e-06 | -2.55e-01 | 0.2878 |
| 143662 | MUC15 | ATC4 | Human | Thyroid | ATC | 6.29e-13 | -5.51e-01 | 0.34 |
| 143662 | MUC15 | ATC5 | Human | Thyroid | ATC | 5.37e-18 | -5.51e-01 | 0.34 |
| Page: 1 |
| Tissue | Expression Dynamics | Abbreviation |
| Liver | 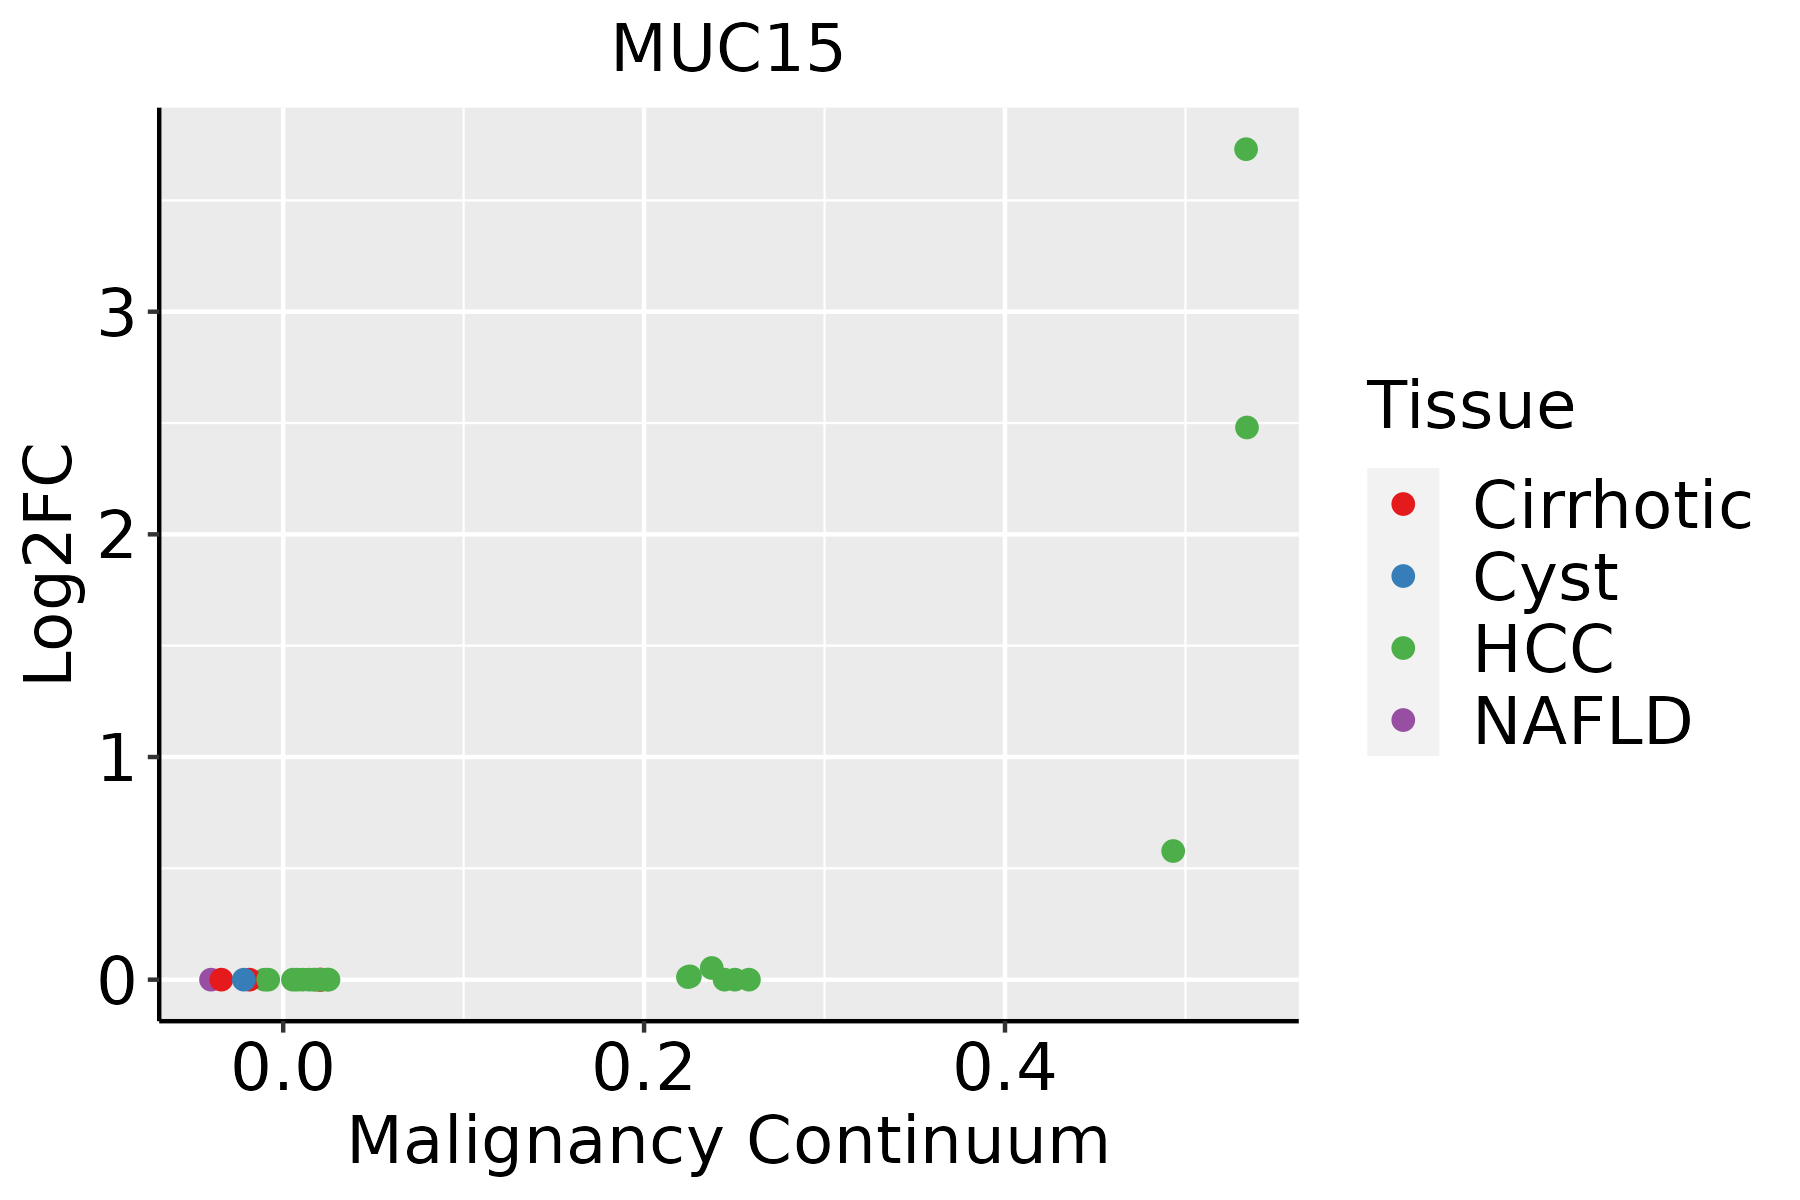 | HCC: Hepatocellular carcinoma |
| NAFLD: Non-alcoholic fatty liver disease | ||
| Thyroid |  | ATC: Anaplastic thyroid cancer |
| HT: Hashimoto's thyroiditis | ||
| PTC: Papillary thyroid cancer |
| ∗log2FC in expression of this searched gene in stem-like cells from each diseased tissue sample relative to stem-like cells in normal samples in each tissue plotted against the malignancy continuum. Samples are colored based on if they are from different disease stage. |
Top |
Malignant transformation related pathway analysis |
| Find out the enriched GO biological processes and KEGG pathways involved in transition from healthy to precancer to cancer |
| Tissue | Disease Stage | Enriched GO biological Processes |
| Colorectum | AD |  |
| Colorectum | SER |  |
| Colorectum | MSS |  |
| Colorectum | MSI-H |  |
| Colorectum | FAP |  |
| ∗Top 15 enriched GO BP terms are showed in the bar plot of each disease state in each tissue. Each row represents a significant GO biological process which is colored according to the -log10(p.adjust). |
| Page: 1 2 3 4 5 6 7 8 9 |
| GO ID | Tissue | Disease Stage | Description | Gene Ratio | Bg Ratio | pvalue | p.adjust | Count |
| Page: 1 |
| Pathway ID | Tissue | Disease Stage | Description | Gene Ratio | Bg Ratio | pvalue | p.adjust | qvalue | Count |
| Page: 1 |
Top |
Cell-cell communication analysis |
| Identification of potential cell-cell interactions between two cell types and their ligand-receptor pairs for different disease states |
| Ligand | Receptor | LRpair | Pathway | Tissue | Disease Stage |
| Page: 1 |
Top |
Single-cell gene regulatory network inference analysis |
| Find out the significant the regulons (TFs) and the target genes of each regulon across cell types for different disease states |
| TF | Cell Type | Tissue | Disease Stage | Target Gene | RSS | Regulon Activity |
| ∗The dot plots of a searched regulon are shown for all cell subpopulations in each disease state of each tissue based on the regulon specific score inferred using pySCENIC and by calculating the average expression. |
| Page: 1 |
Top |
Somatic mutation of malignant transformation related genes |
| Annotation of somatic variants for genes involved in malignant transformation |
| Hugo Symbol | Variant Class | Variant Classification | dbSNP RS | HGVSc | HGVSp | HGVSp Short | SWISSPROT | BIOTYPE | SIFT | PolyPhen | Tumor Sample Barcode | Tissue | Histology | Sex | Age | Stage | Therapy Types | Drugs | Outcome |
| MUC15 | SNV | Missense_Mutation | novel | c.415N>A | p.Leu139Met | p.L139M | protein_coding | deleterious_low_confidence(0.04) | benign(0.392) | TCGA-AN-A046-01 | Breast | breast invasive carcinoma | Female | >=65 | I/II | Unknown | Unknown | SD | |
| MUC15 | SNV | Missense_Mutation | c.353N>T | p.Ser118Leu | p.S118L | protein_coding | tolerated_low_confidence(1) | benign(0) | TCGA-EW-A1PC-01 | Breast | breast invasive carcinoma | Female | >=65 | I/II | Hormone Therapy | tamoxiphen | SD | ||
| MUC15 | insertion | In_Frame_Ins | novel | c.378_379insGAAGCC | p.Ser126_Leu127insGluAla | p.S126_L127insEA | protein_coding | TCGA-A1-A0SM-01 | Breast | breast invasive carcinoma | Male | >=65 | I/II | Unknown | Unknown | SD | |||
| MUC15 | insertion | Nonsense_Mutation | novel | c.377_378insAAATGACTAGTATATGTTCAT | p.Ser126delinsArgAsnAspTerTyrMetPheIle | p.S126delinsRND*YMFI | protein_coding | TCGA-A1-A0SM-01 | Breast | breast invasive carcinoma | Male | >=65 | I/II | Unknown | Unknown | SD | |||
| MUC15 | deletion | Frame_Shift_Del | novel | c.979delN | p.Ser327AlafsTer7 | p.S327Afs*7 | protein_coding | TCGA-A7-A26I-01 | Breast | breast invasive carcinoma | Female | >=65 | I/II | Chemotherapy | cytoxan | SD | |||
| MUC15 | insertion | Frame_Shift_Ins | novel | c.378_379insATATGTTCATTGAAGCC | p.Leu127IlefsTer7 | p.L127Ifs*7 | protein_coding | TCGA-A8-A096-01 | Breast | breast invasive carcinoma | Female | >=65 | I/II | Unknown | Unknown | SD | |||
| MUC15 | insertion | In_Frame_Ins | novel | c.378_379insGAAGCC | p.Ser126_Leu127insGluAla | p.S126_L127insEA | protein_coding | TCGA-B6-A0RM-01 | Breast | breast invasive carcinoma | Female | <65 | I/II | Unknown | Unknown | SD | |||
| MUC15 | SNV | Missense_Mutation | novel | c.426C>A | p.Ser142Arg | p.S142R | protein_coding | tolerated_low_confidence(0.13) | benign(0.387) | TCGA-DS-A1OB-01 | Cervix | cervical & endocervical cancer | Female | <65 | I/II | Chemotherapy | carboplatin | PD | |
| MUC15 | SNV | Missense_Mutation | novel | c.310N>G | p.Leu104Val | p.L104V | protein_coding | tolerated_low_confidence(1) | benign(0.024) | TCGA-VS-A9U7-01 | Cervix | cervical & endocervical cancer | Female | <65 | I/II | Chemotherapy | cisplatin | CR | |
| MUC15 | insertion | Frame_Shift_Ins | novel | c.427_428insGGAGAAG | p.Phe143TrpfsTer6 | p.F143Wfs*6 | protein_coding | TCGA-DS-A1OB-01 | Cervix | cervical & endocervical cancer | Female | <65 | I/II | Chemotherapy | carboplatin | PD |
| Page: 1 2 3 4 5 6 7 8 9 10 |
Top |
Related drugs of malignant transformation related genes |
| Identification of chemicals and drugs interact with genes involved in malignant transfromation |
| (DGIdb 4.0) |
| Entrez ID | Symbol | Category | Interaction Types | Drug Claim Name | Drug Name | PMIDs |
| Page: 1 |

Copyright 2023-Present -The University of Texas Health Science Center at Houston |