
|
|||||
|
 | |
| |
| |
| |
| |
| |
|
Gene: MUC13 |
Gene summary for MUC13 |
| Gene information | Species | Human | Gene symbol | MUC13 | Gene ID | 56667 |
| Gene name | mucin 13, cell surface associated | |
| Gene Alias | DRCC1 | |
| Cytomap | 3q21.2 | |
| Gene Type | protein-coding | GO ID | GO:0001894 | UniProtAcc | Q9H3R2 |
Top |
Malignant transformation analysis |
| Identification of the aberrant gene expression in precancerous and cancerous lesions by comparing the gene expression of stem-like cells in diseased tissues with normal stem cells |
| Entrez ID | Symbol | Replicates | Species | Organ | Tissue | Adj P-value | Log2FC | Malignancy |
| 56667 | MUC13 | HTA11_2487_2000001011 | Human | Colorectum | SER | 1.71e-21 | 1.59e+00 | -0.1808 |
| 56667 | MUC13 | HTA11_1938_2000001011 | Human | Colorectum | AD | 9.63e-16 | 1.03e+00 | -0.0811 |
| 56667 | MUC13 | HTA11_78_2000001011 | Human | Colorectum | AD | 1.23e-04 | 5.73e-01 | -0.1088 |
| 56667 | MUC13 | HTA11_347_2000001011 | Human | Colorectum | AD | 1.41e-40 | 1.49e+00 | -0.1954 |
| 56667 | MUC13 | HTA11_411_2000001011 | Human | Colorectum | SER | 4.41e-14 | 2.87e+00 | -0.2602 |
| 56667 | MUC13 | HTA11_2112_2000001011 | Human | Colorectum | SER | 1.46e-14 | 2.26e+00 | -0.2196 |
| 56667 | MUC13 | HTA11_3361_2000001011 | Human | Colorectum | AD | 1.88e-10 | 8.11e-01 | -0.1207 |
| 56667 | MUC13 | HTA11_83_2000001011 | Human | Colorectum | SER | 8.06e-09 | 8.65e-01 | -0.1526 |
| 56667 | MUC13 | HTA11_696_2000001011 | Human | Colorectum | AD | 7.83e-27 | 1.23e+00 | -0.1464 |
| 56667 | MUC13 | HTA11_866_2000001011 | Human | Colorectum | AD | 2.84e-10 | 8.36e-01 | -0.1001 |
| 56667 | MUC13 | HTA11_1391_2000001011 | Human | Colorectum | AD | 3.61e-33 | 1.69e+00 | -0.059 |
| 56667 | MUC13 | HTA11_2992_2000001011 | Human | Colorectum | SER | 1.59e-05 | 9.83e-01 | -0.1706 |
| 56667 | MUC13 | HTA11_5212_2000001011 | Human | Colorectum | AD | 1.35e-13 | 1.82e+00 | -0.2061 |
| 56667 | MUC13 | HTA11_5216_2000001011 | Human | Colorectum | SER | 1.09e-04 | 1.00e+00 | -0.1462 |
| 56667 | MUC13 | HTA11_546_2000001011 | Human | Colorectum | AD | 3.75e-07 | 6.84e-01 | -0.0842 |
| 56667 | MUC13 | HTA11_7862_2000001011 | Human | Colorectum | AD | 5.89e-03 | 4.56e-01 | -0.0179 |
| 56667 | MUC13 | HTA11_866_3004761011 | Human | Colorectum | AD | 1.06e-21 | 8.89e-01 | 0.096 |
| 56667 | MUC13 | HTA11_7663_2000001011 | Human | Colorectum | SER | 8.14e-05 | 8.28e-01 | 0.0131 |
| 56667 | MUC13 | HTA11_10711_2000001011 | Human | Colorectum | AD | 6.04e-03 | 4.45e-01 | 0.0338 |
| 56667 | MUC13 | HTA11_7696_3000711011 | Human | Colorectum | AD | 6.02e-06 | 5.66e-01 | 0.0674 |
| Page: 1 2 3 4 |
| Tissue | Expression Dynamics | Abbreviation |
| Colorectum (GSE201348) |  | FAP: Familial adenomatous polyposis |
| CRC: Colorectal cancer | ||
| Colorectum (HTA11) |  | AD: Adenomas |
| SER: Sessile serrated lesions | ||
| MSI-H: Microsatellite-high colorectal cancer | ||
| MSS: Microsatellite stable colorectal cancer | ||
| GC | 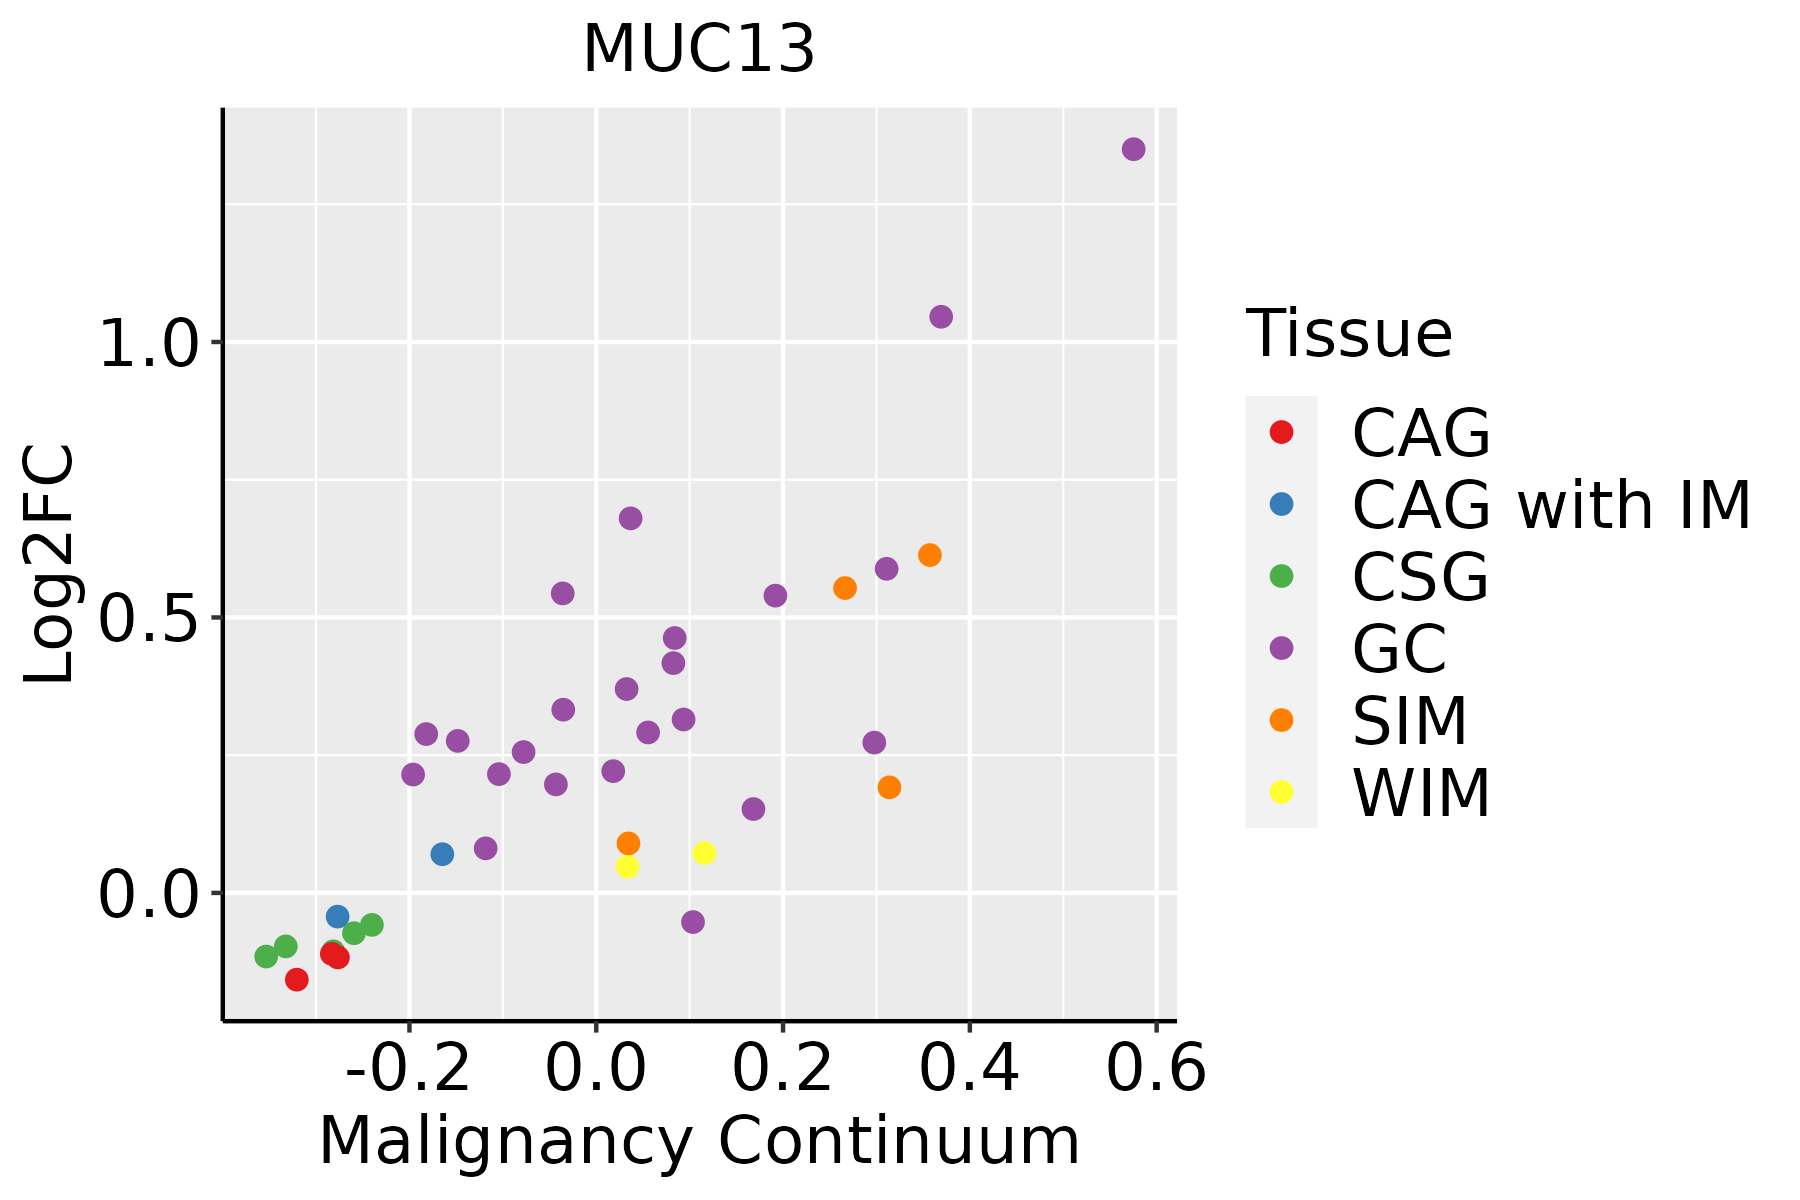 | CAG: Chronic atrophic gastritis |
| CAG with IM: Chronic atrophic gastritis with intestinal metaplasia | ||
| CSG: Chronic superficial gastritis | ||
| GC: Gastric cancer | ||
| SIM: Severe intestinal metaplasia | ||
| WIM: Wild intestinal metaplasia | ||
| Liver | 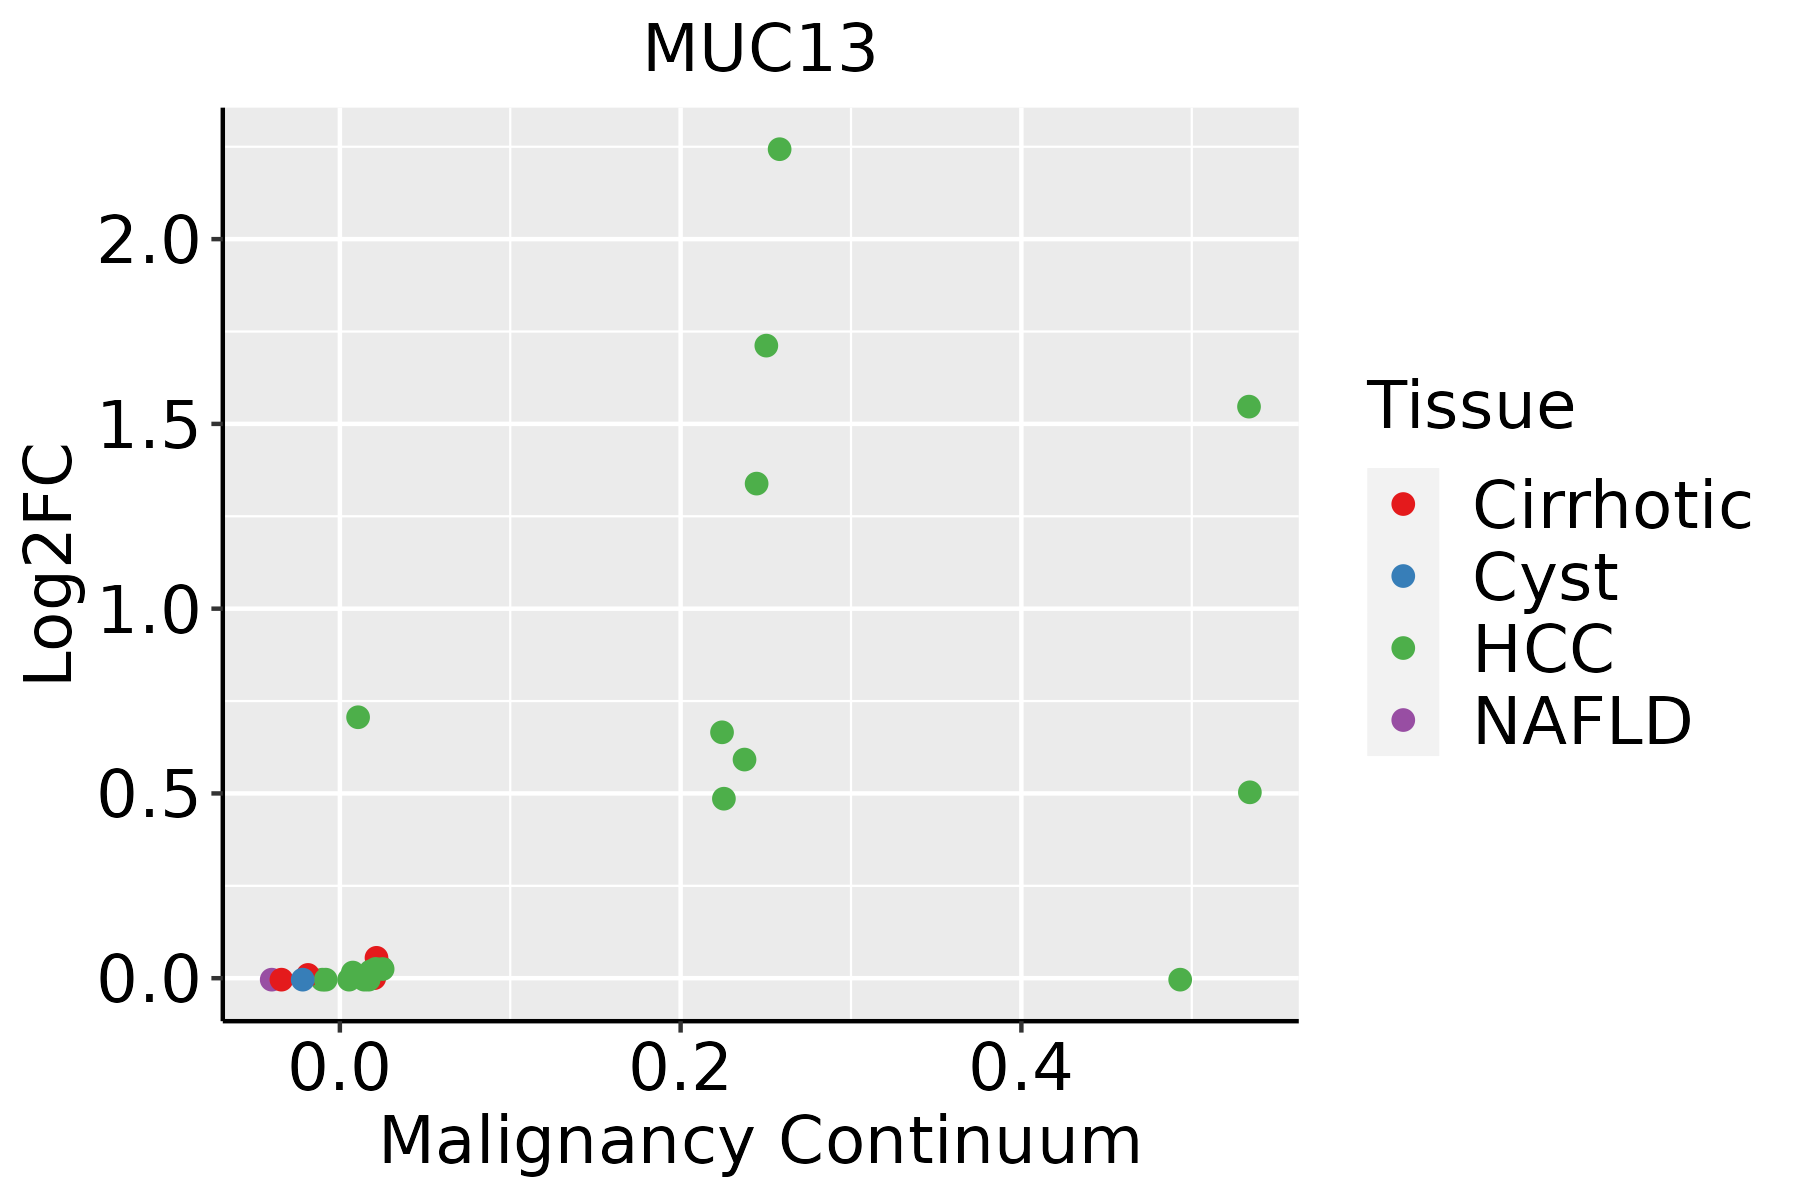 | HCC: Hepatocellular carcinoma |
| NAFLD: Non-alcoholic fatty liver disease |
| ∗log2FC in expression of this searched gene in stem-like cells from each diseased tissue sample relative to stem-like cells in normal samples in each tissue plotted against the malignancy continuum. Samples are colored based on if they are from different disease stage. |
Top |
Malignant transformation related pathway analysis |
| Find out the enriched GO biological processes and KEGG pathways involved in transition from healthy to precancer to cancer |
| Tissue | Disease Stage | Enriched GO biological Processes |
| Colorectum | AD |  |
| Colorectum | SER |  |
| Colorectum | MSS |  |
| Colorectum | MSI-H |  |
| Colorectum | FAP |  |
| ∗Top 15 enriched GO BP terms are showed in the bar plot of each disease state in each tissue. Each row represents a significant GO biological process which is colored according to the -log10(p.adjust). |
| Page: 1 2 3 4 5 6 7 8 9 |
| GO ID | Tissue | Disease Stage | Description | Gene Ratio | Bg Ratio | pvalue | p.adjust | Count |
| GO:0060249 | Colorectum | AD | anatomical structure homeostasis | 94/3918 | 314/18723 | 9.37e-05 | 1.42e-03 | 94 |
| GO:0001894 | Colorectum | AD | tissue homeostasis | 81/3918 | 268/18723 | 1.96e-04 | 2.62e-03 | 81 |
| GO:0030277 | Colorectum | AD | maintenance of gastrointestinal epithelium | 10/3918 | 22/18723 | 8.52e-03 | 4.97e-02 | 10 |
| GO:00018941 | Colorectum | SER | tissue homeostasis | 66/2897 | 268/18723 | 5.87e-05 | 1.37e-03 | 66 |
| GO:00602491 | Colorectum | SER | anatomical structure homeostasis | 74/2897 | 314/18723 | 1.01e-04 | 2.13e-03 | 74 |
| GO:0022600 | Colorectum | SER | digestive system process | 29/2897 | 104/18723 | 8.57e-04 | 1.05e-02 | 29 |
| GO:00602492 | Colorectum | MSS | anatomical structure homeostasis | 84/3467 | 314/18723 | 1.87e-04 | 2.64e-03 | 84 |
| GO:00018942 | Colorectum | MSS | tissue homeostasis | 72/3467 | 268/18723 | 4.53e-04 | 5.40e-03 | 72 |
| GO:00226001 | Colorectum | MSS | digestive system process | 31/3467 | 104/18723 | 3.46e-03 | 2.59e-02 | 31 |
| GO:00602493 | Colorectum | MSI-H | anatomical structure homeostasis | 38/1319 | 314/18723 | 7.73e-04 | 1.44e-02 | 38 |
| GO:00018943 | Colorectum | MSI-H | tissue homeostasis | 33/1319 | 268/18723 | 1.24e-03 | 2.00e-02 | 33 |
| GO:00302771 | Colorectum | MSI-H | maintenance of gastrointestinal epithelium | 6/1319 | 22/18723 | 3.38e-03 | 4.07e-02 | 6 |
| GO:00018944 | Colorectum | FAP | tissue homeostasis | 61/2622 | 268/18723 | 6.71e-05 | 1.28e-03 | 61 |
| GO:00602494 | Colorectum | FAP | anatomical structure homeostasis | 69/2622 | 314/18723 | 7.51e-05 | 1.37e-03 | 69 |
| GO:0010669 | Colorectum | FAP | epithelial structure maintenance | 10/2622 | 30/18723 | 5.90e-03 | 3.75e-02 | 10 |
| GO:00302772 | Colorectum | FAP | maintenance of gastrointestinal epithelium | 8/2622 | 22/18723 | 7.51e-03 | 4.47e-02 | 8 |
| GO:00226002 | Colorectum | FAP | digestive system process | 24/2622 | 104/18723 | 8.41e-03 | 4.89e-02 | 24 |
| GO:00602495 | Colorectum | CRC | anatomical structure homeostasis | 57/2078 | 314/18723 | 1.24e-04 | 2.41e-03 | 57 |
| GO:00018945 | Colorectum | CRC | tissue homeostasis | 48/2078 | 268/18723 | 5.56e-04 | 7.70e-03 | 48 |
| GO:00226003 | Colorectum | CRC | digestive system process | 21/2078 | 104/18723 | 4.67e-03 | 3.62e-02 | 21 |
| Page: 1 2 |
| Pathway ID | Tissue | Disease Stage | Description | Gene Ratio | Bg Ratio | pvalue | p.adjust | qvalue | Count |
| Page: 1 |
Top |
Cell-cell communication analysis |
| Identification of potential cell-cell interactions between two cell types and their ligand-receptor pairs for different disease states |
| Ligand | Receptor | LRpair | Pathway | Tissue | Disease Stage |
| Page: 1 |
Top |
Single-cell gene regulatory network inference analysis |
| Find out the significant the regulons (TFs) and the target genes of each regulon across cell types for different disease states |
| TF | Cell Type | Tissue | Disease Stage | Target Gene | RSS | Regulon Activity |
| ∗The dot plots of a searched regulon are shown for all cell subpopulations in each disease state of each tissue based on the regulon specific score inferred using pySCENIC and by calculating the average expression. |
| Page: 1 |
Top |
Somatic mutation of malignant transformation related genes |
| Annotation of somatic variants for genes involved in malignant transformation |
| Hugo Symbol | Variant Class | Variant Classification | dbSNP RS | HGVSc | HGVSp | HGVSp Short | SWISSPROT | BIOTYPE | SIFT | PolyPhen | Tumor Sample Barcode | Tissue | Histology | Sex | Age | Stage | Therapy Types | Drugs | Outcome |
| MUC13 | SNV | Missense_Mutation | rs758163036 | c.973N>T | p.Arg325Trp | p.R325W | Q9H3R2 | protein_coding | deleterious(0.02) | probably_damaging(0.988) | TCGA-AN-A046-01 | Breast | breast invasive carcinoma | Female | >=65 | I/II | Unknown | Unknown | SD |
| MUC13 | SNV | Missense_Mutation | novel | c.359N>C | p.Ile120Thr | p.I120T | Q9H3R2 | protein_coding | tolerated(0.55) | benign(0.055) | TCGA-AN-A046-01 | Breast | breast invasive carcinoma | Female | >=65 | I/II | Unknown | Unknown | SD |
| MUC13 | SNV | Missense_Mutation | novel | c.8N>T | p.Ala3Val | p.A3V | Q9H3R2 | protein_coding | deleterious_low_confidence(0) | benign(0.412) | TCGA-BH-A0B1-01 | Breast | breast invasive carcinoma | Female | >=65 | I/II | Chemotherapy | adriamycin | SD |
| MUC13 | SNV | Missense_Mutation | novel | c.1078N>G | p.Cys360Gly | p.C360G | Q9H3R2 | protein_coding | deleterious(0) | probably_damaging(0.998) | TCGA-BH-A18V-01 | Breast | breast invasive carcinoma | Female | <65 | I/II | Unknown | Unknown | SD |
| MUC13 | SNV | Missense_Mutation | rs763114171 | c.1117N>A | p.Ala373Thr | p.A373T | Q9H3R2 | protein_coding | deleterious(0.04) | possibly_damaging(0.742) | TCGA-WT-AB41-01 | Breast | breast invasive carcinoma | Female | <65 | I/II | Chemotherapy | taxotere | CR |
| MUC13 | insertion | Nonsense_Mutation | novel | c.580_581insGATGTTAG | p.Thr194ArgfsTer3 | p.T194Rfs*3 | Q9H3R2 | protein_coding | TCGA-AO-A03T-01 | Breast | breast invasive carcinoma | Female | <65 | I/II | Chemotherapy | cyclophosphamide | SD | ||
| MUC13 | insertion | Frame_Shift_Ins | novel | c.1347_1348insTGGGCTTCCTGGGCCATTCTTCAAAGACTTGCATTGCTATT | p.Lys450TrpfsTer24 | p.K450Wfs*24 | Q9H3R2 | protein_coding | TCGA-BH-A0AY-01 | Breast | breast invasive carcinoma | Female | <65 | I/II | Chemotherapy | SD | |||
| MUC13 | insertion | Frame_Shift_Ins | novel | c.6_7insTTTGTCATATTTTTCAATAACATTTTTTCCAGTTTTGTCT | p.Ala3PhefsTer37 | p.A3Ffs*37 | Q9H3R2 | protein_coding | TCGA-BH-A0B1-01 | Breast | breast invasive carcinoma | Female | >=65 | I/II | Chemotherapy | adriamycin | SD | ||
| MUC13 | SNV | Missense_Mutation | novel | c.101C>T | p.Ala34Val | p.A34V | Q9H3R2 | protein_coding | deleterious_low_confidence(0.01) | benign(0.177) | TCGA-2W-A8YY-01 | Cervix | cervical & endocervical cancer | Female | <65 | I/II | Chemotherapy | cisplatin | CR |
| MUC13 | SNV | Missense_Mutation | novel | c.247C>T | p.Pro83Ser | p.P83S | Q9H3R2 | protein_coding | tolerated_low_confidence(0.57) | benign(0.04) | TCGA-DG-A2KM-01 | Cervix | cervical & endocervical cancer | Female | <65 | I/II | Chemotherapy | cisplatin | SD |
| Page: 1 2 3 4 5 6 |
Top |
Related drugs of malignant transformation related genes |
| Identification of chemicals and drugs interact with genes involved in malignant transfromation |
| (DGIdb 4.0) |
| Entrez ID | Symbol | Category | Interaction Types | Drug Claim Name | Drug Name | PMIDs |
| Page: 1 |

Copyright 2023-Present -The University of Texas Health Science Center at Houston |