| Tissue | Expression Dynamics | Abbreviation |
| Breast |  | IDC: Invasive ductal carcinoma |
| DCIS: Ductal carcinoma in situ |
| Precancer(BRCA1-mut): Precancerous lesion from BRCA1 mutation carriers |
| Cervix | 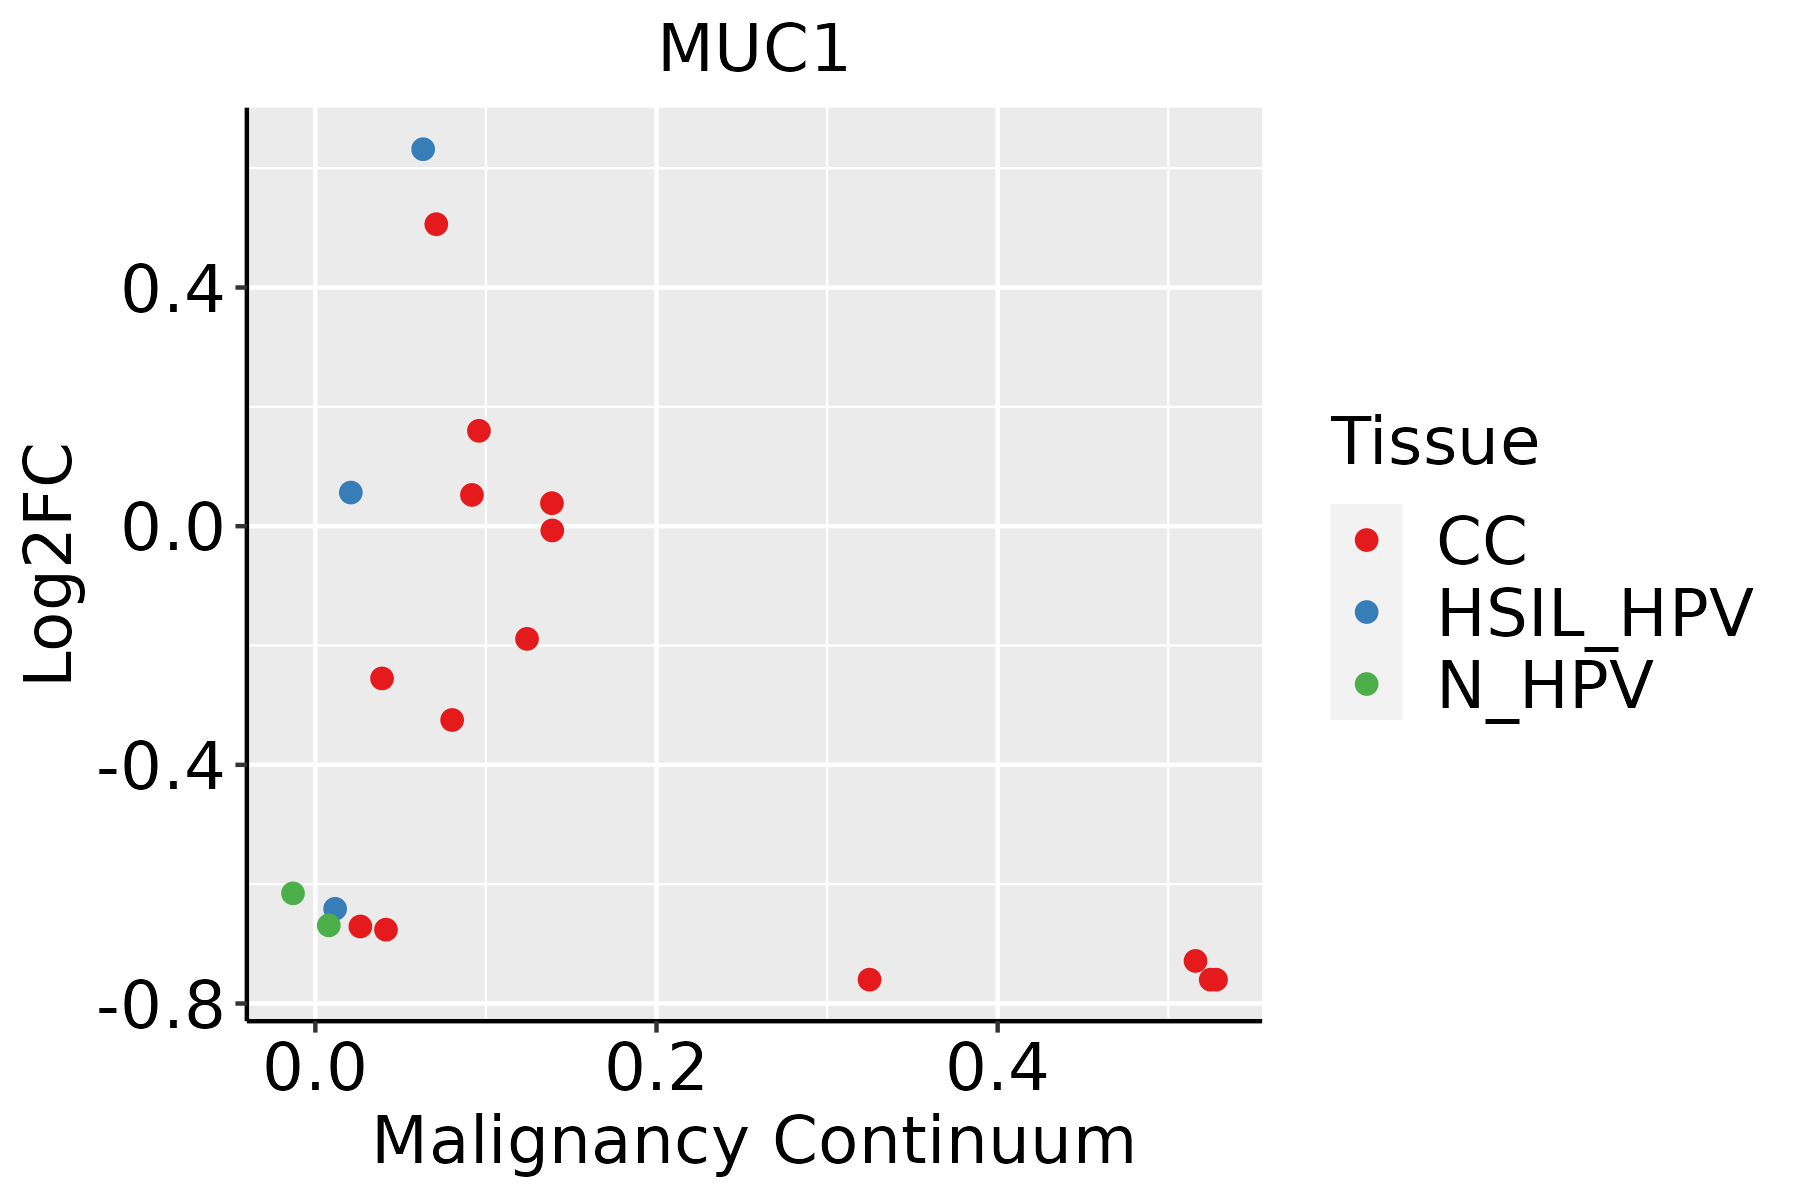 | CC: Cervix cancer |
| HSIL_HPV: HPV-infected high-grade squamous intraepithelial lesions |
| N_HPV: HPV-infected normal cervix |
| Colorectum (GSE201348) |  | FAP: Familial adenomatous polyposis |
| CRC: Colorectal cancer |
| Colorectum (HTA11) |  | AD: Adenomas |
| SER: Sessile serrated lesions |
| MSI-H: Microsatellite-high colorectal cancer |
| MSS: Microsatellite stable colorectal cancer |
| Endometrium | 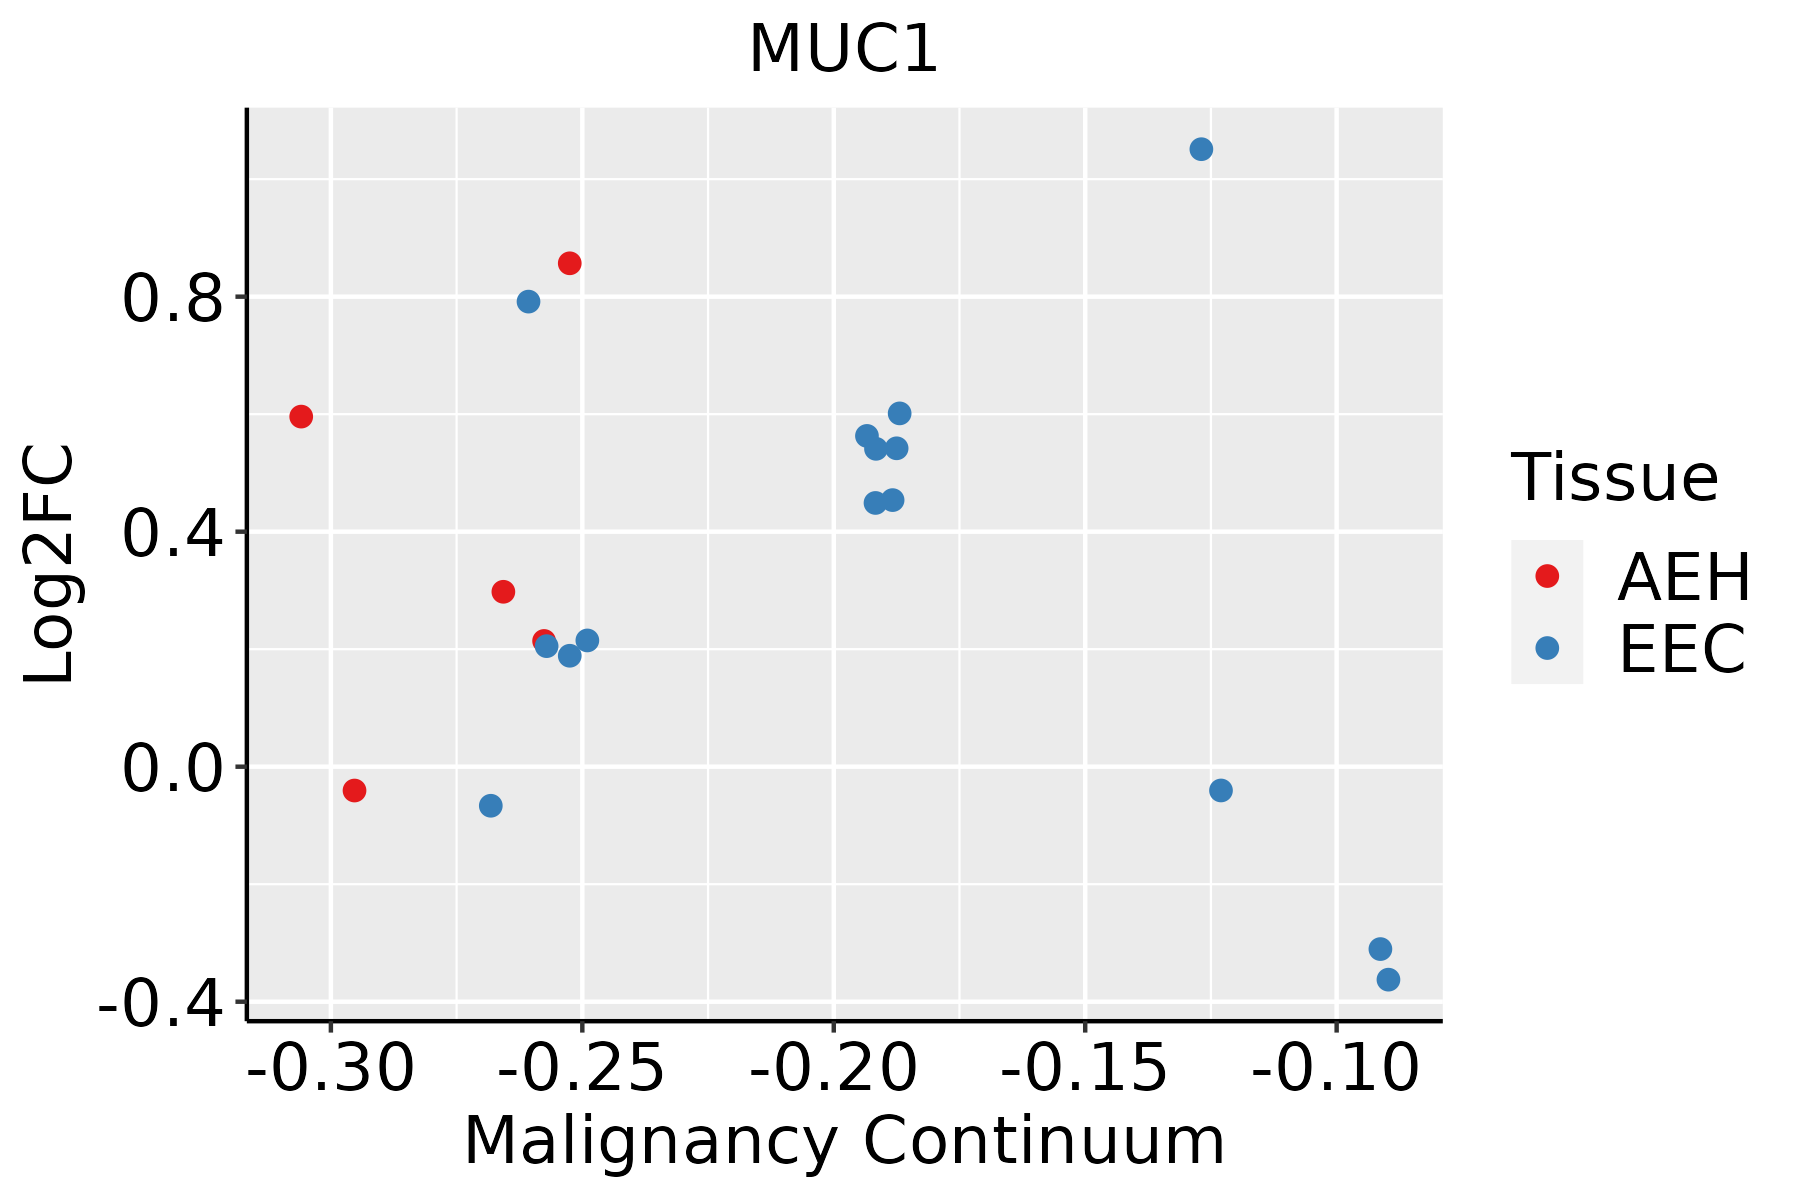 | AEH: Atypical endometrial hyperplasia |
| EEC: Endometrioid Cancer |
| Esophagus |  | ESCC: Esophageal squamous cell carcinoma |
| HGIN: High-grade intraepithelial neoplasias |
| LGIN: Low-grade intraepithelial neoplasias |
| GC | 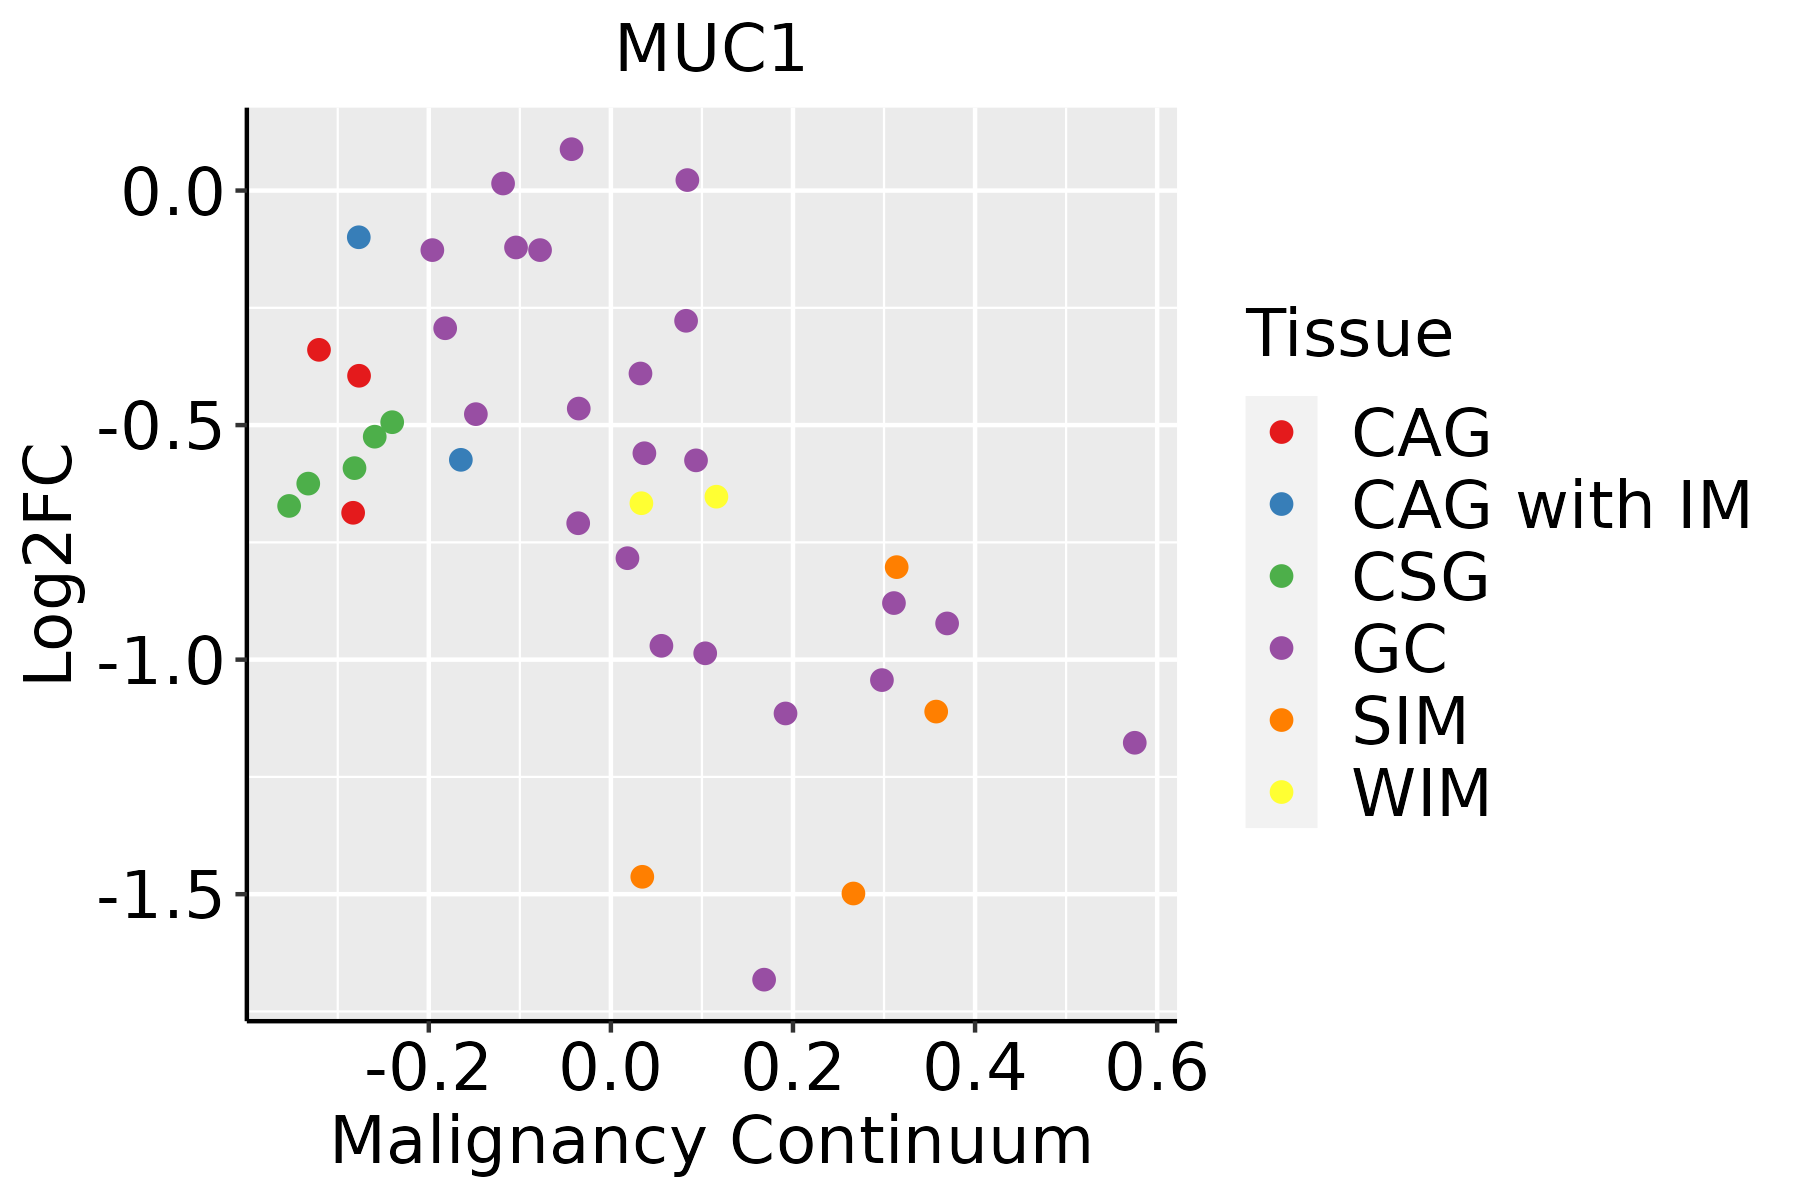 | CAG: Chronic atrophic gastritis |
| CAG with IM: Chronic atrophic gastritis with intestinal metaplasia |
| CSG: Chronic superficial gastritis |
| GC: Gastric cancer |
| SIM: Severe intestinal metaplasia |
| WIM: Wild intestinal metaplasia |
| Liver | 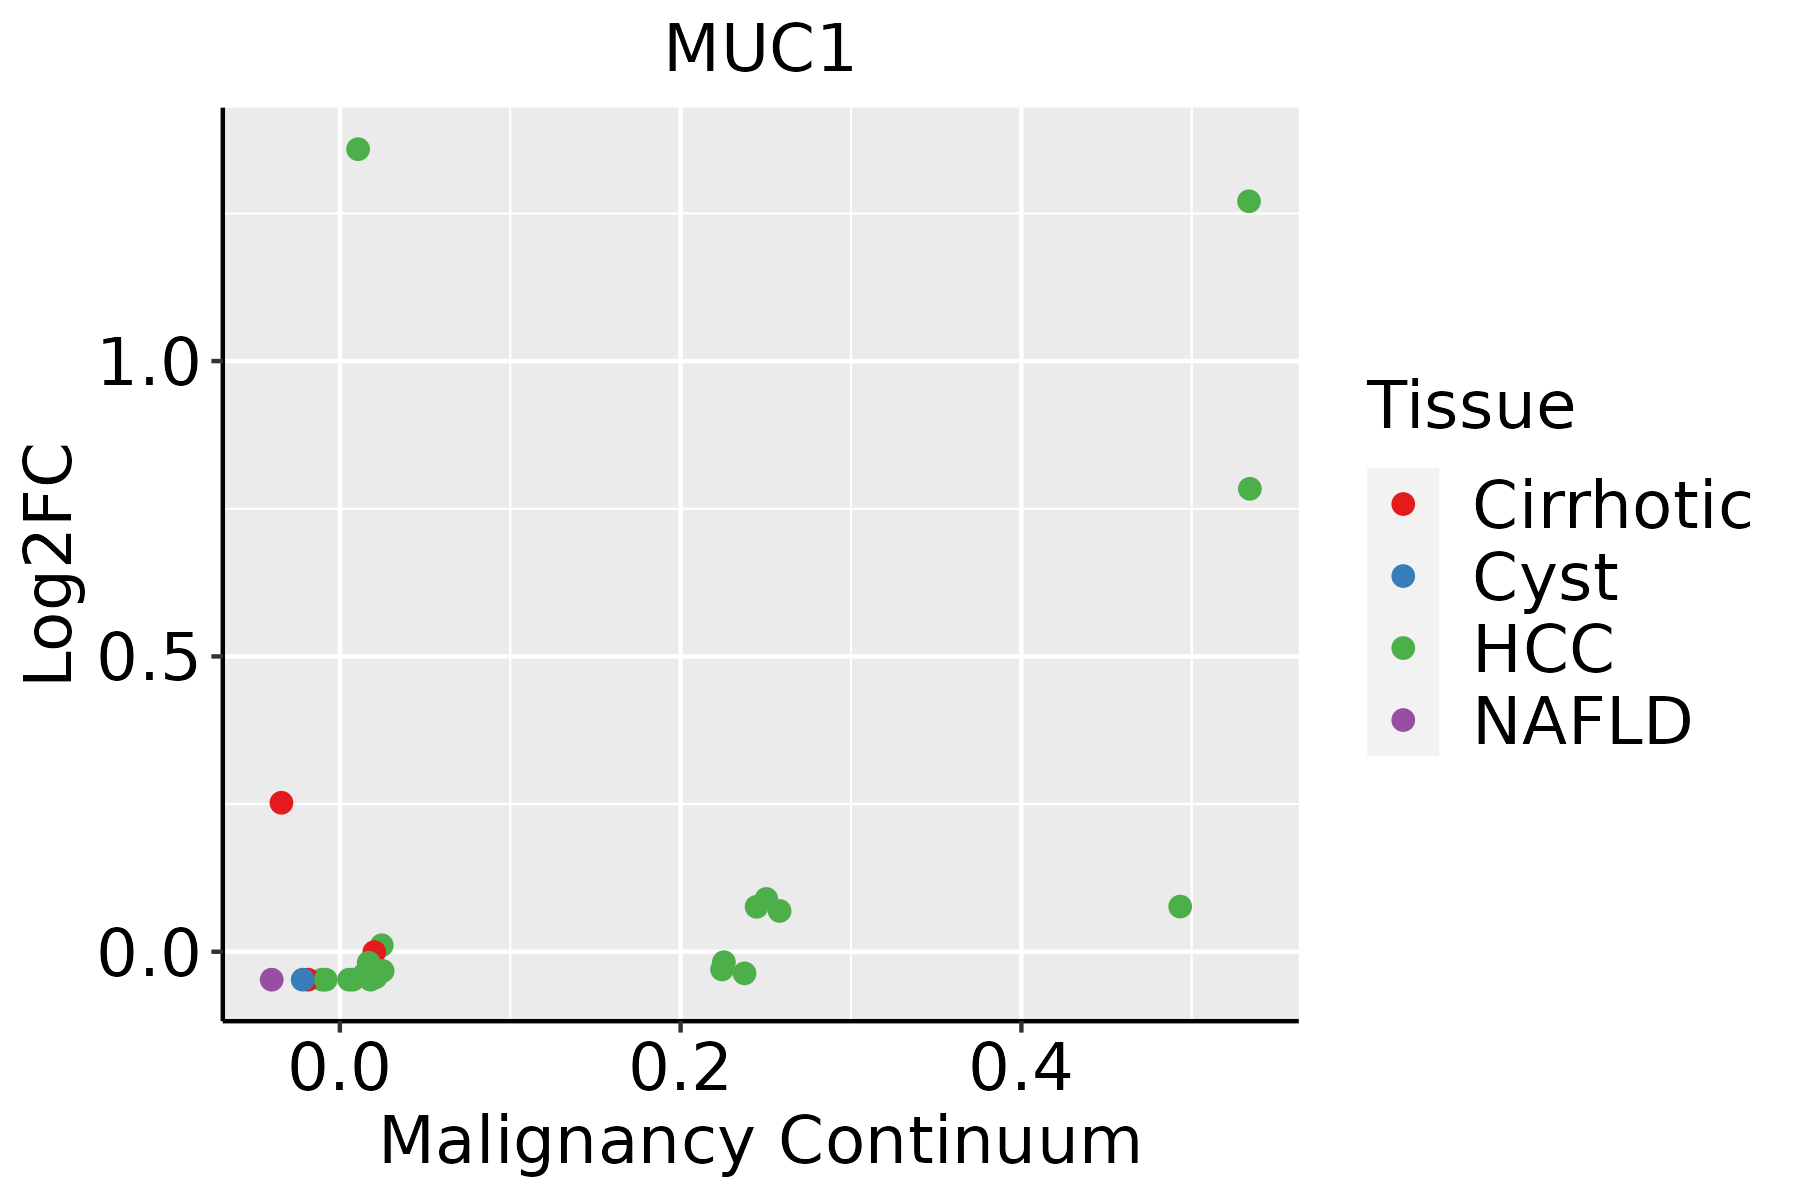 | HCC: Hepatocellular carcinoma |
| NAFLD: Non-alcoholic fatty liver disease |
| Lung | 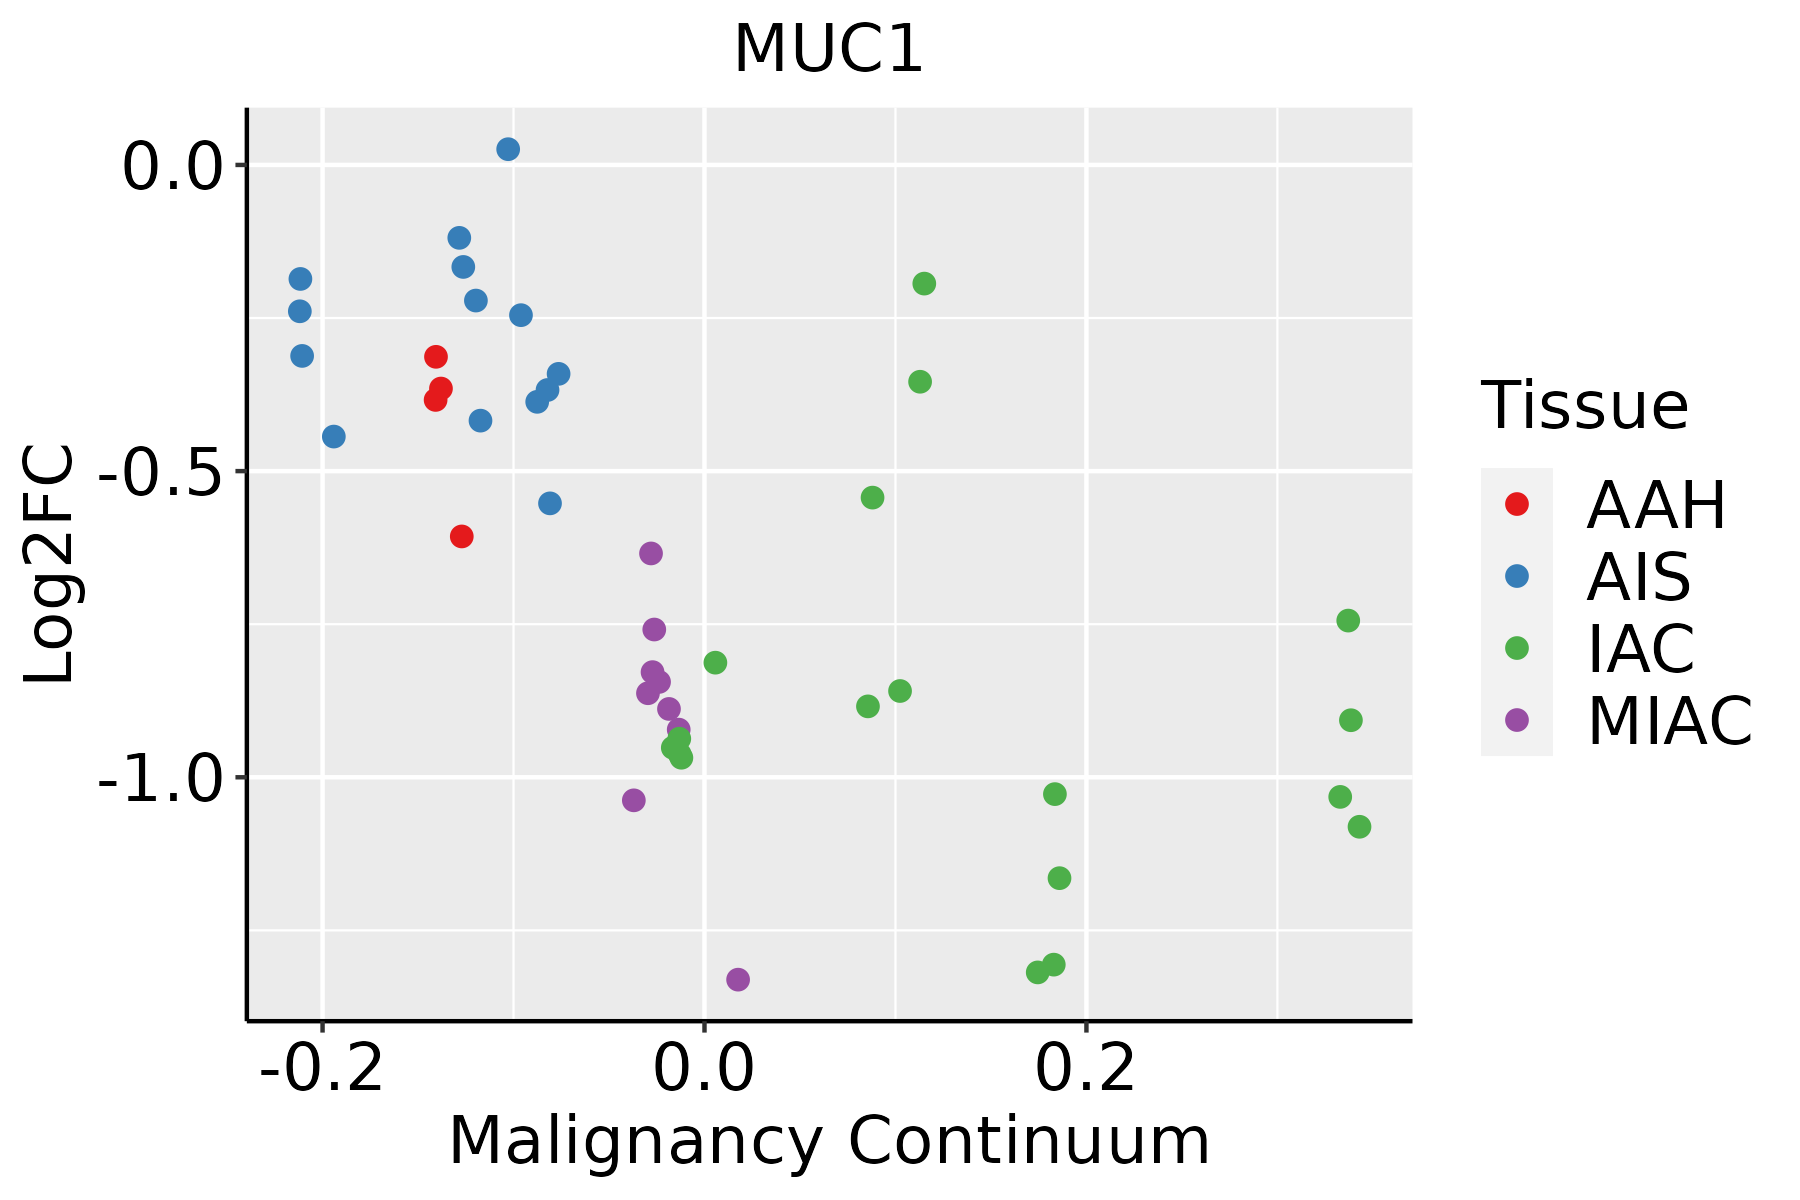 | AAH: Atypical adenomatous hyperplasia |
| AIS: Adenocarcinoma in situ |
| IAC: Invasive lung adenocarcinoma |
| MIA: Minimally invasive adenocarcinoma |
| Oral Cavity | 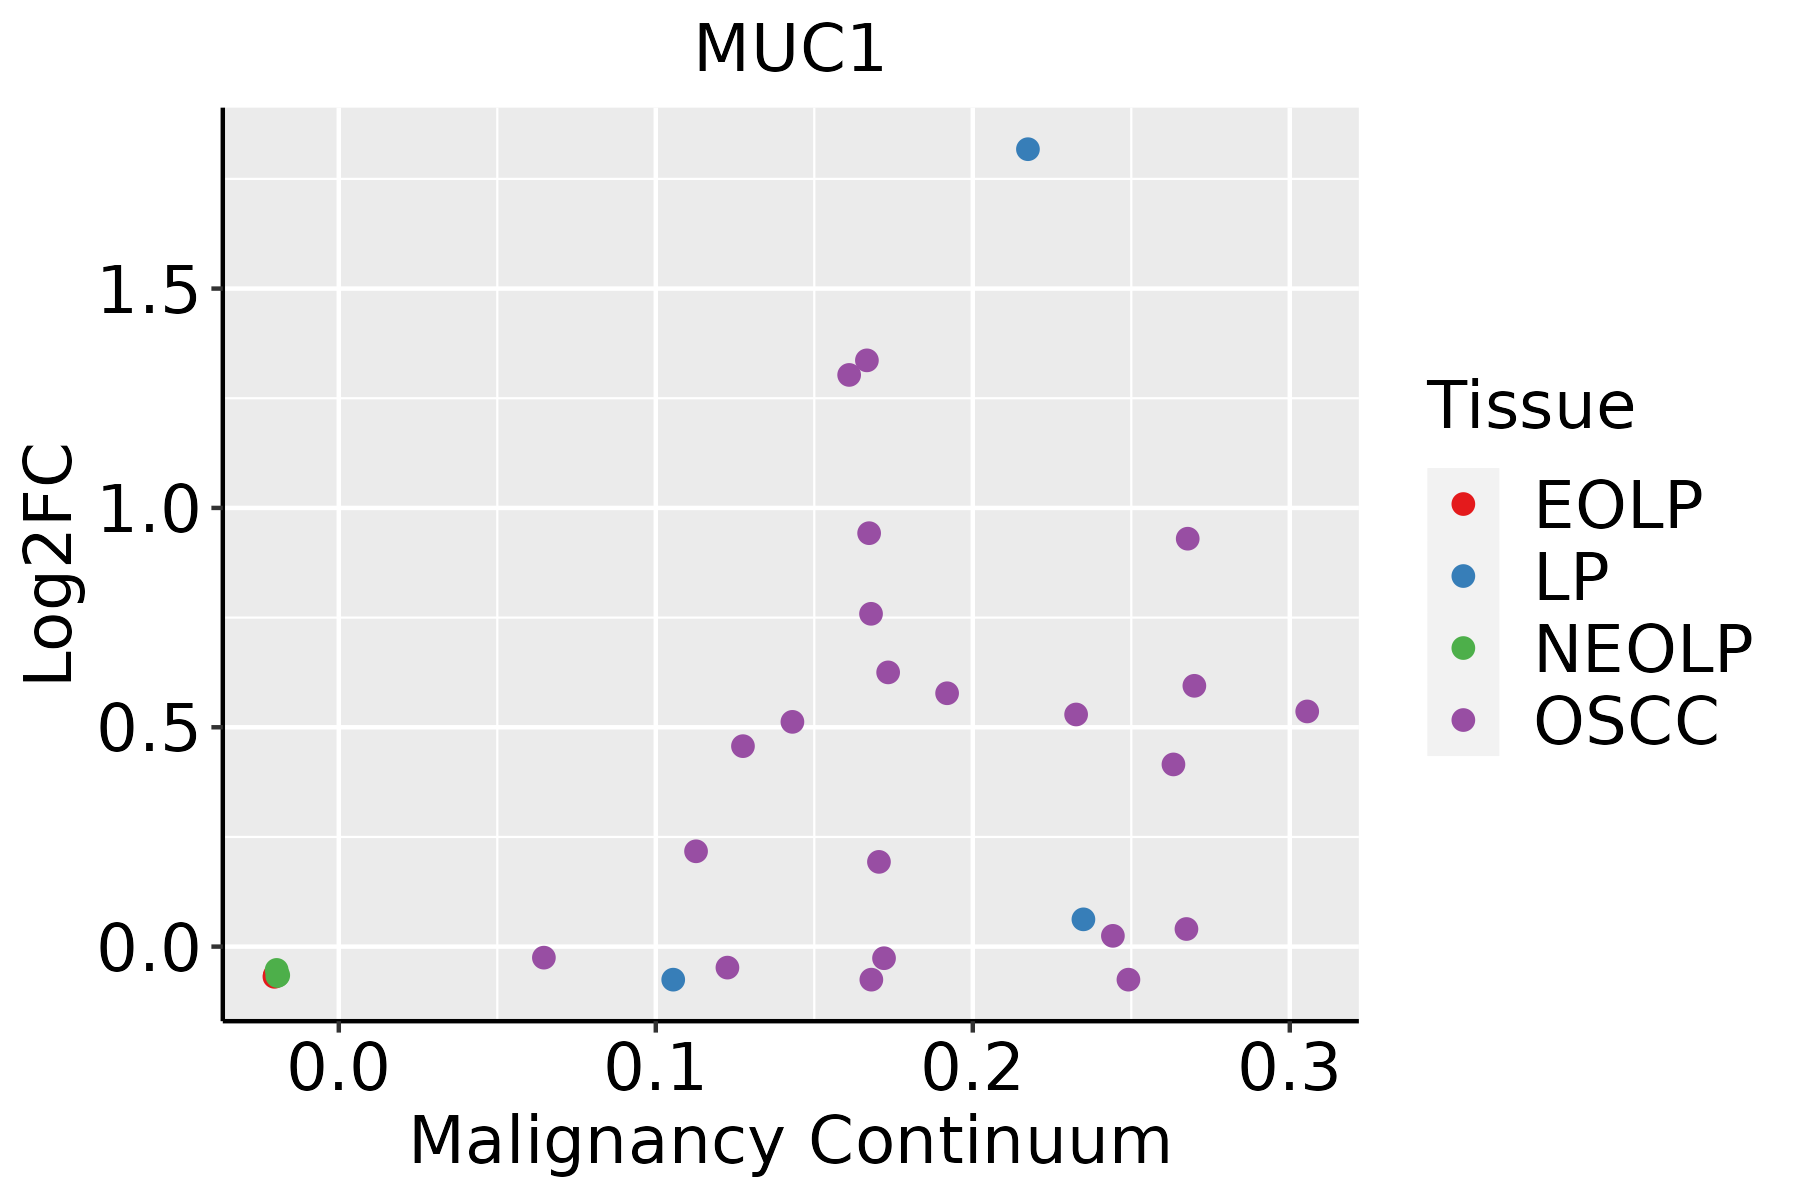 | EOLP: Erosive Oral lichen planus |
| LP: leukoplakia |
| NEOLP: Non-erosive oral lichen planus |
| OSCC: Oral squamous cell carcinoma |
| Prostate |  | BPH: Benign Prostatic Hyperplasia |
| Thyroid | 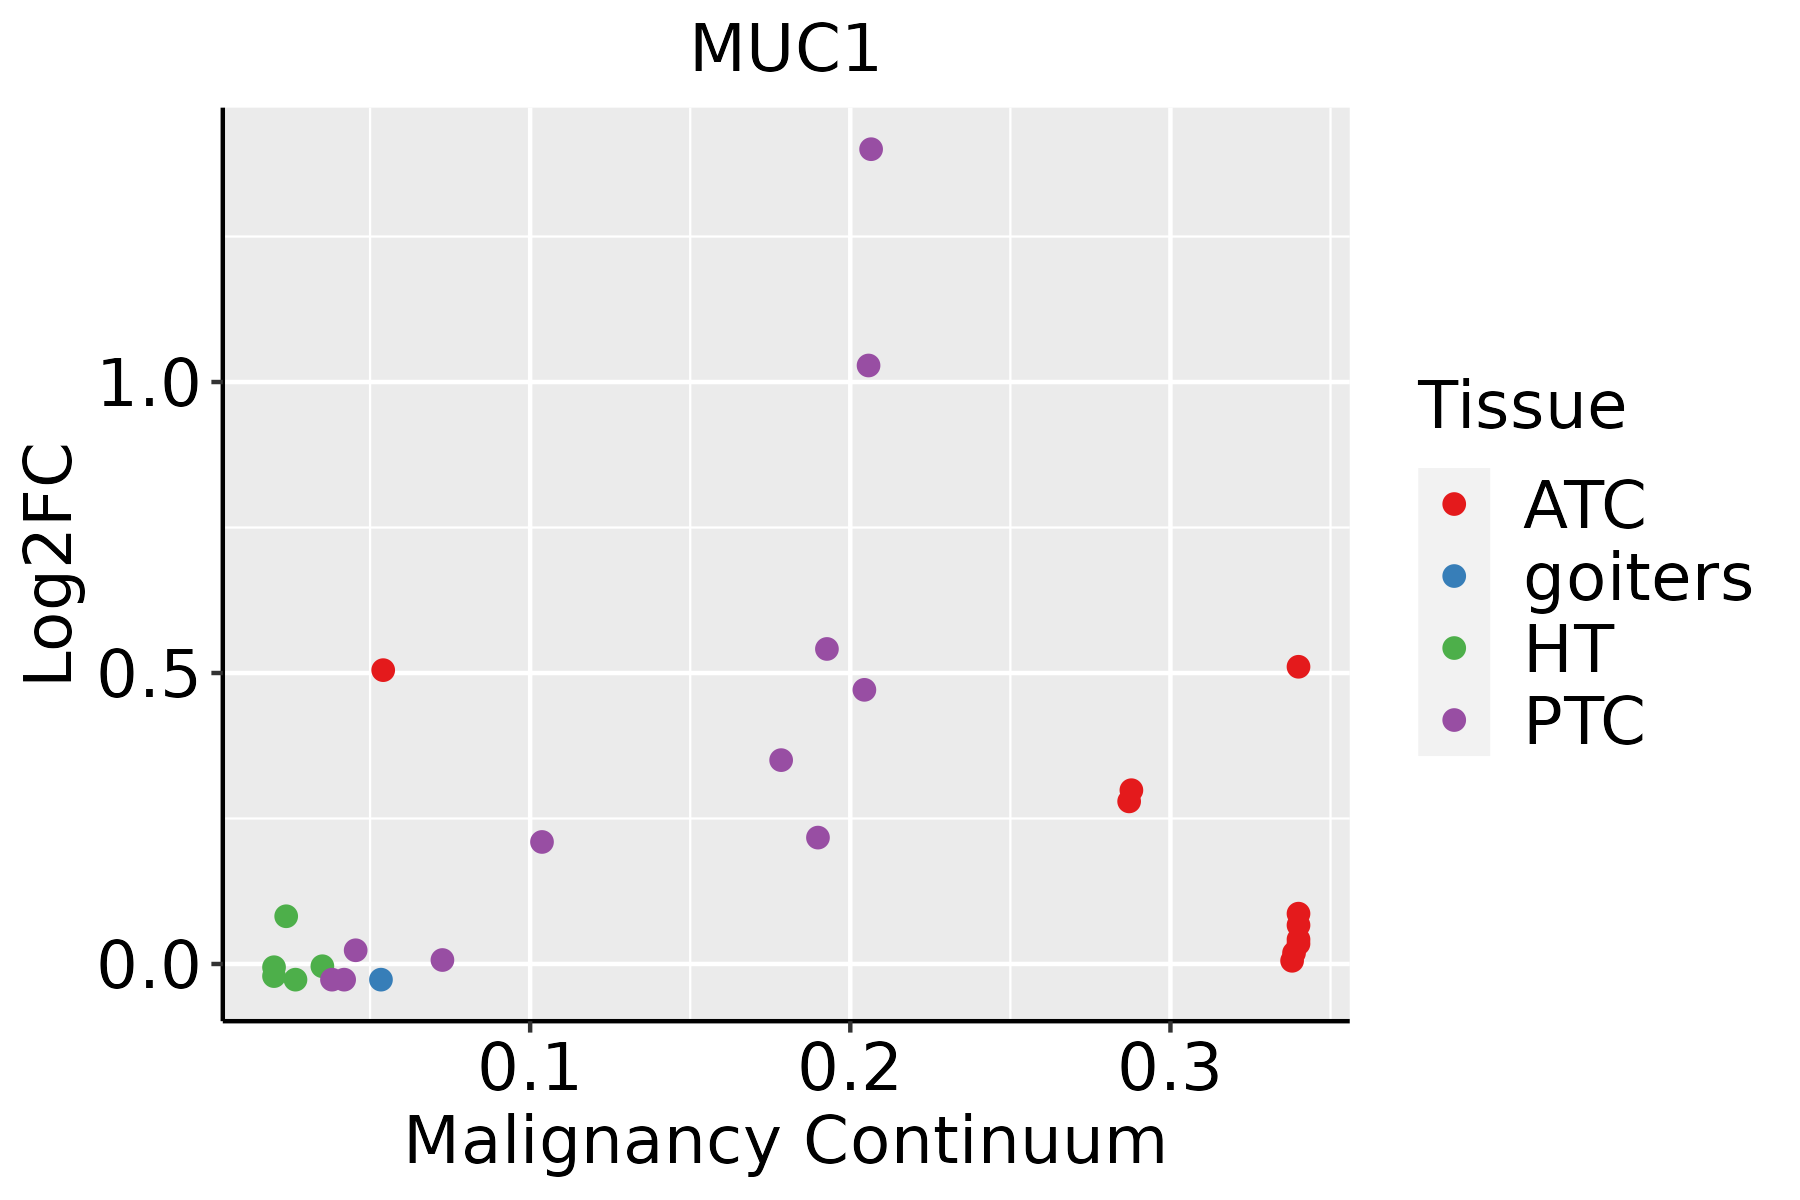 | ATC: Anaplastic thyroid cancer |
| HT: Hashimoto's thyroiditis |
| PTC: Papillary thyroid cancer |
| GO ID | Tissue | Disease Stage | Description | Gene Ratio | Bg Ratio | pvalue | p.adjust | Count |
| GO:00971939 | Breast | Precancer | intrinsic apoptotic signaling pathway | 59/1080 | 288/18723 | 8.07e-18 | 3.60e-15 | 59 |
| GO:20012339 | Breast | Precancer | regulation of apoptotic signaling pathway | 65/1080 | 356/18723 | 7.70e-17 | 3.17e-14 | 65 |
| GO:20012429 | Breast | Precancer | regulation of intrinsic apoptotic signaling pathway | 41/1080 | 164/18723 | 6.48e-16 | 2.31e-13 | 41 |
| GO:20012349 | Breast | Precancer | negative regulation of apoptotic signaling pathway | 39/1080 | 224/18723 | 5.35e-10 | 4.77e-08 | 39 |
| GO:20012439 | Breast | Precancer | negative regulation of intrinsic apoptotic signaling pathway | 23/1080 | 98/18723 | 5.82e-09 | 4.45e-07 | 23 |
| GO:19017969 | Breast | Precancer | regulation of signal transduction by p53 class mediator | 19/1080 | 93/18723 | 1.20e-06 | 4.60e-05 | 19 |
| GO:00723319 | Breast | Precancer | signal transduction by p53 class mediator | 26/1080 | 163/18723 | 2.23e-06 | 7.76e-05 | 26 |
| GO:00723328 | Breast | Precancer | intrinsic apoptotic signaling pathway by p53 class mediator | 16/1080 | 76/18723 | 5.49e-06 | 1.63e-04 | 16 |
| GO:00436209 | Breast | Precancer | regulation of DNA-templated transcription in response to stress | 13/1080 | 53/18723 | 7.06e-06 | 1.95e-04 | 13 |
| GO:00436189 | Breast | Precancer | regulation of transcription from RNA polymerase II promoter in response to stress | 12/1080 | 47/18723 | 1.02e-05 | 2.67e-04 | 12 |
| GO:19022537 | Breast | Precancer | regulation of intrinsic apoptotic signaling pathway by p53 class mediator | 9/1080 | 29/18723 | 2.40e-05 | 5.53e-04 | 9 |
| GO:00086308 | Breast | Precancer | intrinsic apoptotic signaling pathway in response to DNA damage | 16/1080 | 99/18723 | 1.65e-04 | 2.74e-03 | 16 |
| GO:19021655 | Breast | Precancer | regulation of intrinsic apoptotic signaling pathway in response to DNA damage by p53 class mediator | 6/1080 | 16/18723 | 1.76e-04 | 2.87e-03 | 6 |
| GO:00427718 | Breast | Precancer | intrinsic apoptotic signaling pathway in response to DNA damage by p53 class mediator | 9/1080 | 43/18723 | 6.51e-04 | 7.99e-03 | 9 |
| GO:19022293 | Breast | Precancer | regulation of intrinsic apoptotic signaling pathway in response to DNA damage | 8/1080 | 36/18723 | 8.49e-04 | 9.82e-03 | 8 |
| GO:20010208 | Breast | Precancer | regulation of response to DNA damage stimulus | 24/1080 | 219/18723 | 1.93e-03 | 1.87e-02 | 24 |
| GO:00360037 | Breast | Precancer | positive regulation of transcription from RNA polymerase II promoter in response to stress | 6/1080 | 24/18723 | 1.99e-03 | 1.90e-02 | 6 |
| GO:00303309 | Breast | Precancer | DNA damage response, signal transduction by p53 class mediator | 11/1080 | 72/18723 | 2.65e-03 | 2.36e-02 | 11 |
| GO:00315714 | Breast | Precancer | mitotic G1 DNA damage checkpoint | 6/1080 | 30/18723 | 6.54e-03 | 4.51e-02 | 6 |
| GO:19021661 | Breast | Precancer | negative regulation of intrinsic apoptotic signaling pathway in response to DNA damage by p53 class mediator | 4/1080 | 14/18723 | 6.92e-03 | 4.67e-02 | 4 |
| Hugo Symbol | Variant Class | Variant Classification | dbSNP RS | HGVSc | HGVSp | HGVSp Short | SWISSPROT | BIOTYPE | SIFT | PolyPhen | Tumor Sample Barcode | Tissue | Histology | Sex | Age | Stage | Therapy Types | Drugs | Outcome |
| MUC1 | SNV | Missense_Mutation | novel | c.640C>A | p.Pro214Thr | p.P214T | | protein_coding | tolerated(0.08) | possibly_damaging(0.503) | TCGA-A7-A0DB-01 | Breast | breast invasive carcinoma | Female | <65 | I/II | Hormone Therapy | arimidex | SD |
| MUC1 | SNV | Missense_Mutation | | c.1102N>T | p.Val368Phe | p.V368F | | protein_coding | deleterious(0.05) | benign(0.186) | TCGA-D8-A13Z-01 | Breast | breast invasive carcinoma | Female | <65 | I/II | Chemotherapy | doxorubicine | SD |
| MUC1 | SNV | Missense_Mutation | novel | c.998C>A | p.Thr333Asn | p.T333N | | protein_coding | deleterious(0) | probably_damaging(0.923) | TCGA-D8-A1XC-01 | Breast | breast invasive carcinoma | Female | >=65 | III/IV | Unknown | Unknown | PD |
| MUC1 | deletion | Frame_Shift_Del | novel | c.643_697delNNNNNNNNNNNNNNNNNNNNNNNNNNNNNNNNNNNNNNNNNNNNNNNNNNNNNNN | p.Ala215ProfsTer100 | p.A215Pfs*100 | | protein_coding | | | TCGA-E2-A15S-01 | Breast | breast invasive carcinoma | Female | <65 | I/II | Chemotherapy | doxorubicin | SD |
| MUC1 | SNV | Missense_Mutation | rs759820018 | c.247N>G | p.Gln83Glu | p.Q83E | | protein_coding | tolerated(0.8) | benign(0.101) | TCGA-EK-A3GK-01 | Cervix | cervical & endocervical cancer | Female | <65 | I/II | Unknown | Unknown | SD |
| MUC1 | SNV | Missense_Mutation | novel | c.620N>G | p.Ser207Cys | p.S207C | | protein_coding | deleterious(0) | probably_damaging(0.968) | TCGA-HM-A3JJ-01 | Cervix | cervical & endocervical cancer | Female | <65 | I/II | Chemotherapy | cisplatin | PD |
| MUC1 | SNV | Missense_Mutation | novel | c.701N>G | p.Leu234Arg | p.L234R | | protein_coding | tolerated(0.37) | benign(0.299) | TCGA-R2-A69V-01 | Cervix | cervical & endocervical cancer | Female | <65 | I/II | Chemotherapy | cisplatin | SD |
| MUC1 | SNV | Missense_Mutation | novel | c.1183N>A | p.Leu395Met | p.L395M | | protein_coding | deleterious(0) | probably_damaging(0.999) | TCGA-VS-A8EL-01 | Cervix | cervical & endocervical cancer | Female | <65 | I/II | Chemotherapy | cisplatin | CR |
| MUC1 | SNV | Missense_Mutation | novel | c.854N>T | p.Ser285Phe | p.S285F | | protein_coding | deleterious(0.03) | probably_damaging(0.999) | TCGA-VS-A94Z-01 | Cervix | cervical & endocervical cancer | Female | <65 | I/II | Chemotherapy | cisplatin | CR |
| MUC1 | SNV | Missense_Mutation | novel | c.175G>A | p.Glu59Lys | p.E59K | | protein_coding | tolerated(0.48) | possibly_damaging(0.497) | TCGA-VS-A958-01 | Cervix | cervical & endocervical cancer | Female | <65 | I/II | Chemotherapy | cisplatin | CR |
| Entrez ID | Symbol | Category | Interaction Types | Drug Claim Name | Drug Name | PMIDs |
| 4582 | MUC1 | CLINICALLY ACTIONABLE, ENZYME, DRUGGABLE GENOME | | Anti-MUC1 mab | | |
| 4582 | MUC1 | CLINICALLY ACTIONABLE, ENZYME, DRUGGABLE GENOME | | G0-203-2c | | |
| 4582 | MUC1 | CLINICALLY ACTIONABLE, ENZYME, DRUGGABLE GENOME | | SODIUM BUTYRATE | | 2211839 |
| 4582 | MUC1 | CLINICALLY ACTIONABLE, ENZYME, DRUGGABLE GENOME | | MUC-1 CART cell immunotherapy | | |
| 4582 | MUC1 | CLINICALLY ACTIONABLE, ENZYME, DRUGGABLE GENOME | | Pankomab-GEX | | |
| 4582 | MUC1 | CLINICALLY ACTIONABLE, ENZYME, DRUGGABLE GENOME | | BREVAREX MAB | | |
| 4582 | MUC1 | CLINICALLY ACTIONABLE, ENZYME, DRUGGABLE GENOME | | AS-1402 | HUHMFG1 | |
| 4582 | MUC1 | CLINICALLY ACTIONABLE, ENZYME, DRUGGABLE GENOME | | SAR-566658 | SAR-566658 | |
| 4582 | MUC1 | CLINICALLY ACTIONABLE, ENZYME, DRUGGABLE GENOME | | GO-203-2c | GO-203-2C | |
| 4582 | MUC1 | CLINICALLY ACTIONABLE, ENZYME, DRUGGABLE GENOME | | AS1402 | HUHMFG1 | |


