
|
|||||
|
 | |
| |
| |
| |
| |
| |
|
Gene: MTX2 |
Gene summary for MTX2 |
| Gene information | Species | Human | Gene symbol | MTX2 | Gene ID | 10651 |
| Gene name | metaxin 2 | |
| Gene Alias | MDPS | |
| Cytomap | 2q31.1 | |
| Gene Type | protein-coding | GO ID | GO:0006810 | UniProtAcc | O75431 |
Top |
Malignant transformation analysis |
| Identification of the aberrant gene expression in precancerous and cancerous lesions by comparing the gene expression of stem-like cells in diseased tissues with normal stem cells |
| Entrez ID | Symbol | Replicates | Species | Organ | Tissue | Adj P-value | Log2FC | Malignancy |
| 10651 | MTX2 | CCI_2 | Human | Cervix | CC | 2.24e-05 | 6.39e-01 | 0.5249 |
| 10651 | MTX2 | CCI_3 | Human | Cervix | CC | 6.93e-05 | 4.80e-01 | 0.516 |
| 10651 | MTX2 | Tumor | Human | Cervix | CC | 3.18e-10 | 3.14e-01 | 0.1241 |
| 10651 | MTX2 | sample3 | Human | Cervix | CC | 1.52e-14 | 3.19e-01 | 0.1387 |
| 10651 | MTX2 | T3 | Human | Cervix | CC | 1.43e-11 | 3.22e-01 | 0.1389 |
| 10651 | MTX2 | HTA11_3410_2000001011 | Human | Colorectum | AD | 8.87e-20 | -6.77e-01 | 0.0155 |
| 10651 | MTX2 | HTA11_1938_2000001011 | Human | Colorectum | AD | 8.88e-03 | -3.22e-01 | -0.0811 |
| 10651 | MTX2 | HTA11_3361_2000001011 | Human | Colorectum | AD | 2.72e-04 | -4.91e-01 | -0.1207 |
| 10651 | MTX2 | HTA11_696_2000001011 | Human | Colorectum | AD | 1.76e-15 | -5.22e-01 | -0.1464 |
| 10651 | MTX2 | HTA11_866_2000001011 | Human | Colorectum | AD | 6.00e-05 | -4.09e-01 | -0.1001 |
| 10651 | MTX2 | HTA11_1391_2000001011 | Human | Colorectum | AD | 1.90e-04 | -4.55e-01 | -0.059 |
| 10651 | MTX2 | HTA11_546_2000001011 | Human | Colorectum | AD | 4.83e-02 | -5.31e-01 | -0.0842 |
| 10651 | MTX2 | HTA11_7862_2000001011 | Human | Colorectum | AD | 3.80e-02 | -5.50e-01 | -0.0179 |
| 10651 | MTX2 | HTA11_866_3004761011 | Human | Colorectum | AD | 5.45e-06 | -4.80e-01 | 0.096 |
| 10651 | MTX2 | HTA11_10711_2000001011 | Human | Colorectum | AD | 1.90e-08 | -6.47e-01 | 0.0338 |
| 10651 | MTX2 | HTA11_7696_3000711011 | Human | Colorectum | AD | 9.49e-12 | -4.76e-01 | 0.0674 |
| 10651 | MTX2 | HTA11_6818_2000001021 | Human | Colorectum | AD | 4.24e-02 | -4.98e-01 | 0.0588 |
| 10651 | MTX2 | HTA11_99999971662_82457 | Human | Colorectum | MSS | 5.18e-10 | -4.44e-01 | 0.3859 |
| 10651 | MTX2 | HTA11_99999973899_84307 | Human | Colorectum | MSS | 2.63e-03 | -5.93e-01 | 0.2585 |
| 10651 | MTX2 | HTA11_99999974143_84620 | Human | Colorectum | MSS | 2.56e-16 | -5.50e-01 | 0.3005 |
| Page: 1 2 3 4 5 6 7 8 9 |
| Tissue | Expression Dynamics | Abbreviation |
| Cervix | 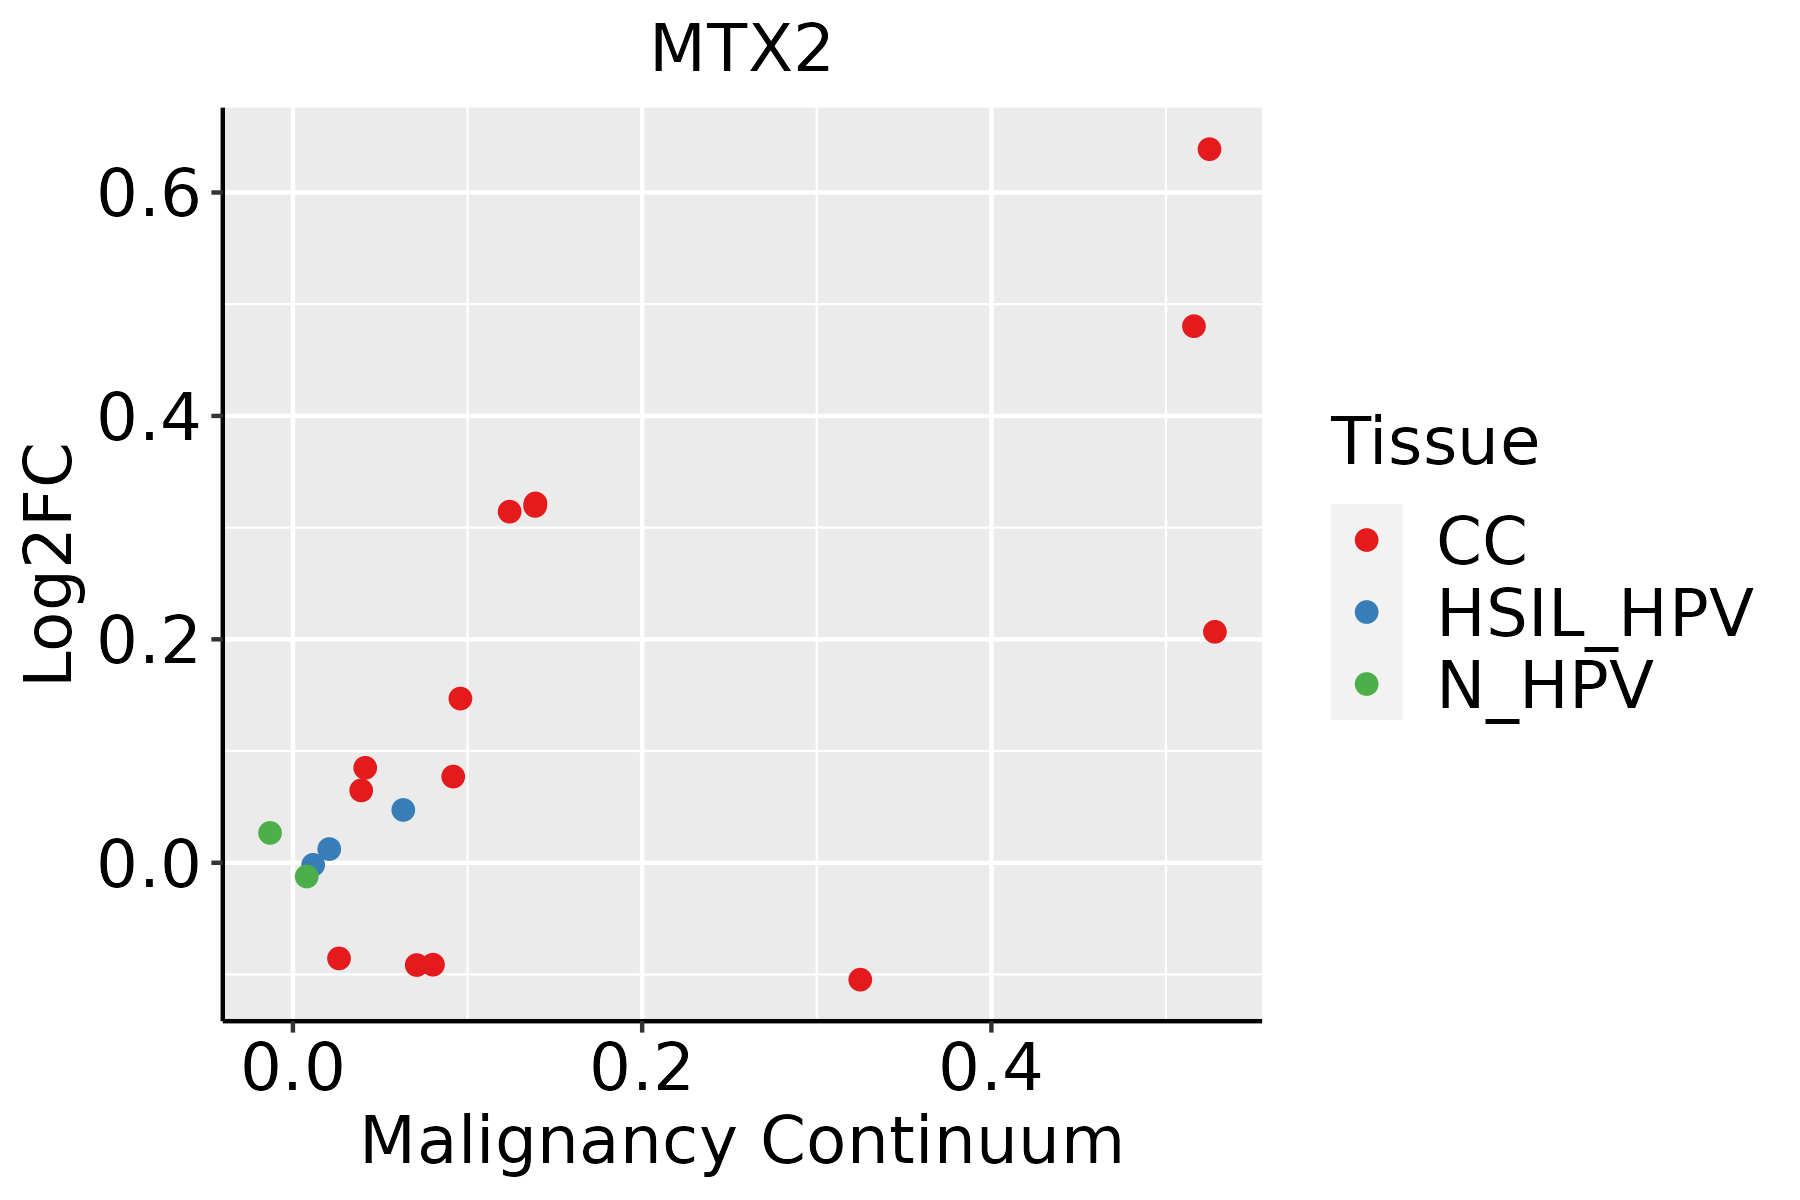 | CC: Cervix cancer |
| HSIL_HPV: HPV-infected high-grade squamous intraepithelial lesions | ||
| N_HPV: HPV-infected normal cervix | ||
| Colorectum (GSE201348) |  | FAP: Familial adenomatous polyposis |
| CRC: Colorectal cancer | ||
| Colorectum (HTA11) |  | AD: Adenomas |
| SER: Sessile serrated lesions | ||
| MSI-H: Microsatellite-high colorectal cancer | ||
| MSS: Microsatellite stable colorectal cancer | ||
| Esophagus | 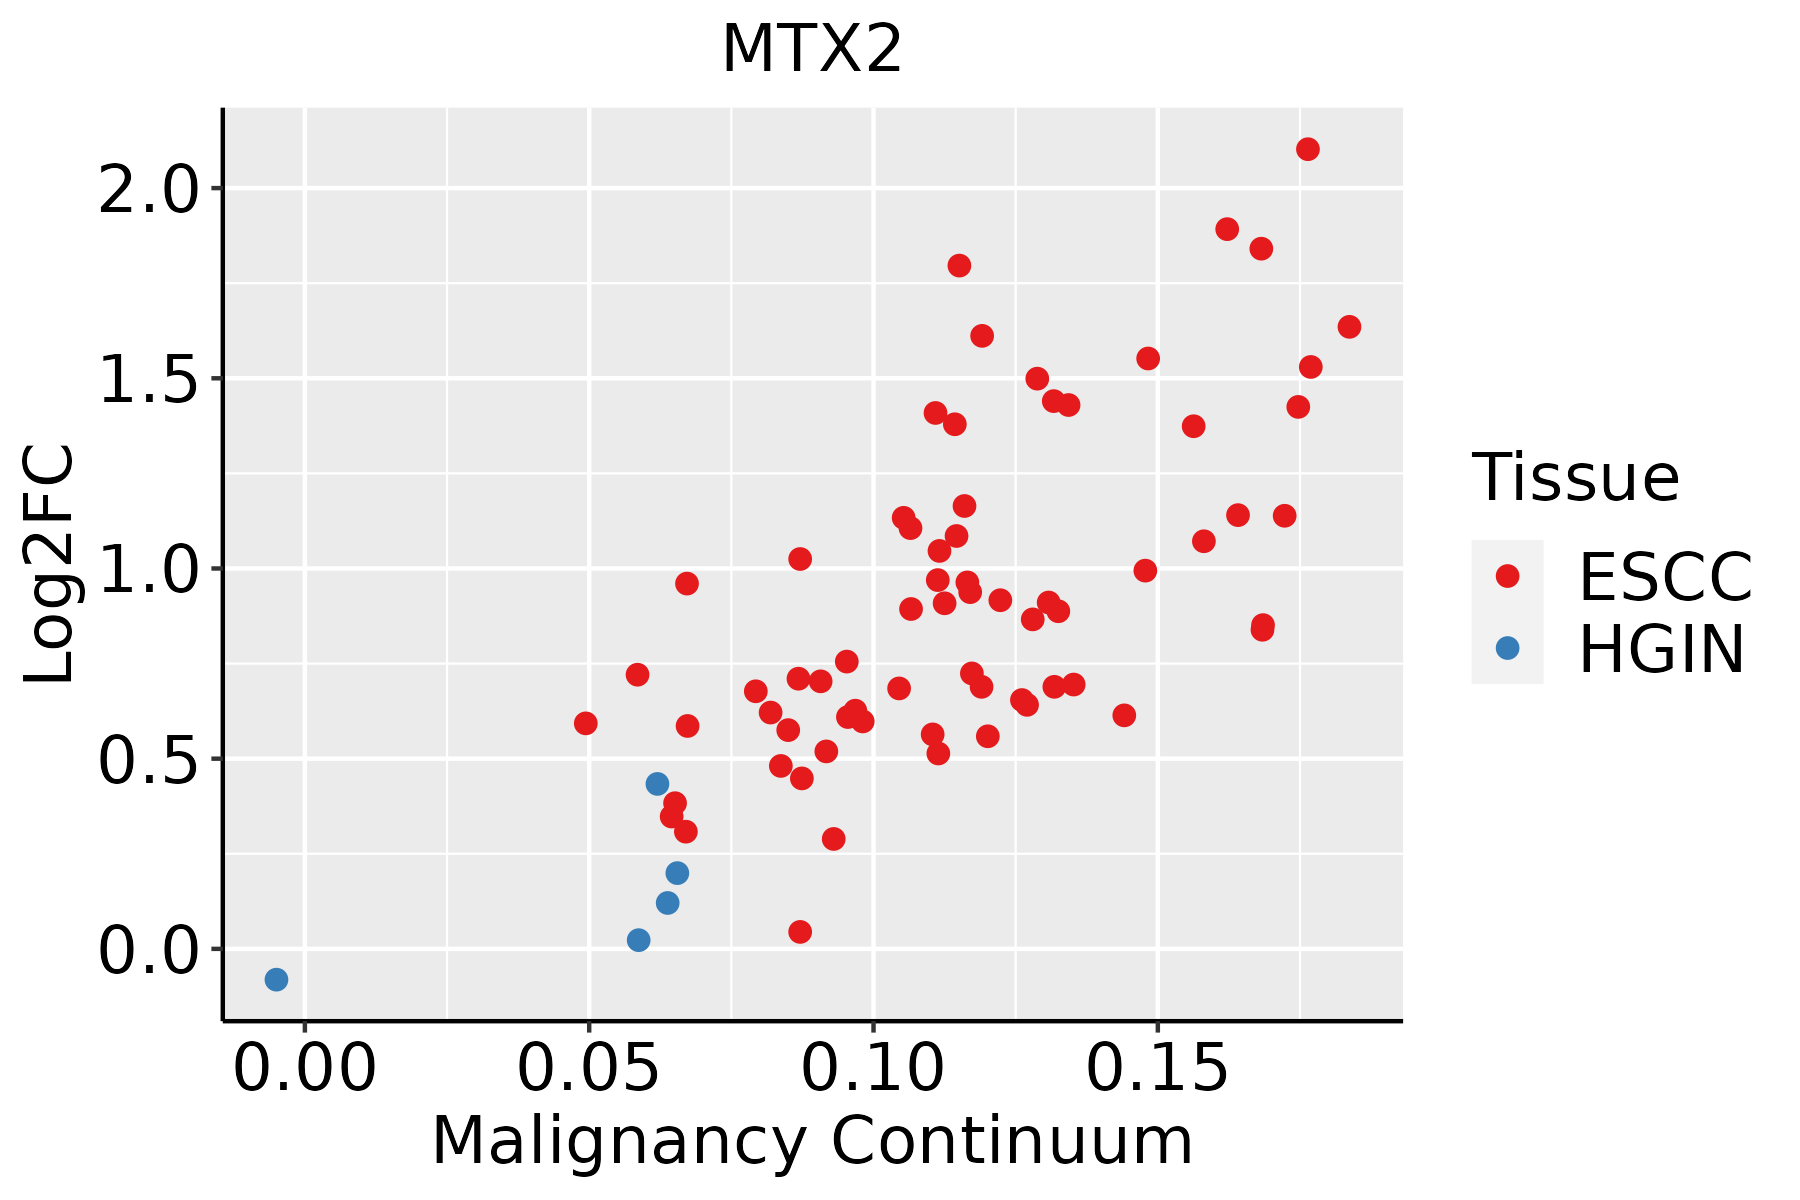 | ESCC: Esophageal squamous cell carcinoma |
| HGIN: High-grade intraepithelial neoplasias | ||
| LGIN: Low-grade intraepithelial neoplasias | ||
| Liver |  | HCC: Hepatocellular carcinoma |
| NAFLD: Non-alcoholic fatty liver disease | ||
| Oral Cavity |  | EOLP: Erosive Oral lichen planus |
| LP: leukoplakia | ||
| NEOLP: Non-erosive oral lichen planus | ||
| OSCC: Oral squamous cell carcinoma | ||
| Skin |  | AK: Actinic keratosis |
| cSCC: Cutaneous squamous cell carcinoma | ||
| SCCIS:squamous cell carcinoma in situ | ||
| Thyroid |  | ATC: Anaplastic thyroid cancer |
| HT: Hashimoto's thyroiditis | ||
| PTC: Papillary thyroid cancer |
| ∗log2FC in expression of this searched gene in stem-like cells from each diseased tissue sample relative to stem-like cells in normal samples in each tissue plotted against the malignancy continuum. Samples are colored based on if they are from different disease stage. |
Top |
Malignant transformation related pathway analysis |
| Find out the enriched GO biological processes and KEGG pathways involved in transition from healthy to precancer to cancer |
| Tissue | Disease Stage | Enriched GO biological Processes |
| Colorectum | AD |  |
| Colorectum | SER |  |
| Colorectum | MSS |  |
| Colorectum | MSI-H |  |
| Colorectum | FAP |  |
| ∗Top 15 enriched GO BP terms are showed in the bar plot of each disease state in each tissue. Each row represents a significant GO biological process which is colored according to the -log10(p.adjust). |
| Page: 1 2 3 4 5 6 7 8 9 |
| GO ID | Tissue | Disease Stage | Description | Gene Ratio | Bg Ratio | pvalue | p.adjust | Count |
| GO:00068399 | Cervix | CC | mitochondrial transport | 60/2311 | 254/18723 | 4.21e-07 | 1.67e-05 | 60 |
| GO:00070067 | Cervix | CC | mitochondrial membrane organization | 28/2311 | 116/18723 | 3.28e-04 | 3.47e-03 | 28 |
| GO:00070074 | Cervix | CC | inner mitochondrial membrane organization | 11/2311 | 38/18723 | 4.94e-03 | 2.95e-02 | 11 |
| GO:0006839 | Colorectum | AD | mitochondrial transport | 102/3918 | 254/18723 | 1.87e-12 | 3.08e-10 | 102 |
| GO:0007006 | Colorectum | AD | mitochondrial membrane organization | 48/3918 | 116/18723 | 4.53e-07 | 1.72e-05 | 48 |
| GO:0007007 | Colorectum | AD | inner mitochondrial membrane organization | 18/3918 | 38/18723 | 2.45e-04 | 3.09e-03 | 18 |
| GO:00068392 | Colorectum | MSS | mitochondrial transport | 93/3467 | 254/18723 | 6.14e-12 | 9.82e-10 | 93 |
| GO:00070062 | Colorectum | MSS | mitochondrial membrane organization | 42/3467 | 116/18723 | 4.99e-06 | 1.38e-04 | 42 |
| GO:00070072 | Colorectum | MSS | inner mitochondrial membrane organization | 14/3467 | 38/18723 | 6.00e-03 | 4.03e-02 | 14 |
| GO:00068394 | Colorectum | FAP | mitochondrial transport | 55/2622 | 254/18723 | 5.58e-04 | 6.24e-03 | 55 |
| GO:0006839110 | Esophagus | ESCC | mitochondrial transport | 187/8552 | 254/18723 | 8.35e-20 | 9.81e-18 | 187 |
| GO:000700619 | Esophagus | ESCC | mitochondrial membrane organization | 93/8552 | 116/18723 | 2.16e-14 | 1.11e-12 | 93 |
| GO:000700713 | Esophagus | ESCC | inner mitochondrial membrane organization | 31/8552 | 38/18723 | 5.93e-06 | 6.10e-05 | 31 |
| GO:00068397 | Liver | Cirrhotic | mitochondrial transport | 112/4634 | 254/18723 | 1.03e-11 | 6.66e-10 | 112 |
| GO:00070065 | Liver | Cirrhotic | mitochondrial membrane organization | 57/4634 | 116/18723 | 1.13e-08 | 4.29e-07 | 57 |
| GO:00070073 | Liver | Cirrhotic | inner mitochondrial membrane organization | 19/4634 | 38/18723 | 6.75e-04 | 5.06e-03 | 19 |
| GO:000683912 | Liver | HCC | mitochondrial transport | 184/7958 | 254/18723 | 2.30e-22 | 3.83e-20 | 184 |
| GO:000700612 | Liver | HCC | mitochondrial membrane organization | 80/7958 | 116/18723 | 7.09e-09 | 1.81e-07 | 80 |
| GO:000700711 | Liver | HCC | inner mitochondrial membrane organization | 28/7958 | 38/18723 | 9.60e-05 | 8.34e-04 | 28 |
| GO:000683918 | Oral cavity | OSCC | mitochondrial transport | 162/7305 | 254/18723 | 8.96e-16 | 6.52e-14 | 162 |
| Page: 1 2 |
| Pathway ID | Tissue | Disease Stage | Description | Gene Ratio | Bg Ratio | pvalue | p.adjust | qvalue | Count |
| Page: 1 |
Top |
Cell-cell communication analysis |
| Identification of potential cell-cell interactions between two cell types and their ligand-receptor pairs for different disease states |
| Ligand | Receptor | LRpair | Pathway | Tissue | Disease Stage |
| Page: 1 |
Top |
Single-cell gene regulatory network inference analysis |
| Find out the significant the regulons (TFs) and the target genes of each regulon across cell types for different disease states |
| TF | Cell Type | Tissue | Disease Stage | Target Gene | RSS | Regulon Activity |
| ∗The dot plots of a searched regulon are shown for all cell subpopulations in each disease state of each tissue based on the regulon specific score inferred using pySCENIC and by calculating the average expression. |
| Page: 1 |
Top |
Somatic mutation of malignant transformation related genes |
| Annotation of somatic variants for genes involved in malignant transformation |
| Hugo Symbol | Variant Class | Variant Classification | dbSNP RS | HGVSc | HGVSp | HGVSp Short | SWISSPROT | BIOTYPE | SIFT | PolyPhen | Tumor Sample Barcode | Tissue | Histology | Sex | Age | Stage | Therapy Types | Drugs | Outcome |
| MTX2 | SNV | Missense_Mutation | c.567N>G | p.Cys189Trp | p.C189W | O75431 | protein_coding | deleterious(0) | probably_damaging(0.997) | TCGA-B6-A0WX-01 | Breast | breast invasive carcinoma | Female | <65 | III/IV | Unknown | Unknown | PD | |
| MTX2 | insertion | Frame_Shift_Ins | novel | c.343_344insCACATGCTGCTAATTTTTTTGTTTGTTTTGTTTTGTTTTT | p.Met115ThrfsTer32 | p.M115Tfs*32 | O75431 | protein_coding | TCGA-BH-A0B4-01 | Breast | breast invasive carcinoma | Male | >=65 | III/IV | Hormone Therapy | tamoxiphen | SD | ||
| MTX2 | SNV | Missense_Mutation | novel | c.190G>A | p.Glu64Lys | p.E64K | O75431 | protein_coding | deleterious(0.01) | probably_damaging(0.998) | TCGA-EA-A97N-01 | Cervix | cervical & endocervical cancer | Female | <65 | I/II | Unknown | Unknown | SD |
| MTX2 | SNV | Missense_Mutation | c.25N>A | p.Val9Ile | p.V9I | O75431 | protein_coding | tolerated(0.46) | benign(0.015) | TCGA-CK-6746-01 | Colorectum | colon adenocarcinoma | Female | >=65 | I/II | Unknown | Unknown | SD | |
| MTX2 | SNV | Missense_Mutation | c.575C>T | p.Ala192Val | p.A192V | O75431 | protein_coding | deleterious(0.01) | possibly_damaging(0.868) | TCGA-F4-6856-01 | Colorectum | colon adenocarcinoma | Male | <65 | I/II | Ancillary | leucovorin | CR | |
| MTX2 | SNV | Missense_Mutation | rs867441047 | c.758A>G | p.Tyr253Cys | p.Y253C | O75431 | protein_coding | deleterious(0) | probably_damaging(0.926) | TCGA-QG-A5Z1-01 | Colorectum | colon adenocarcinoma | Male | >=65 | III/IV | Unspecific | Complete Response | |
| MTX2 | SNV | Missense_Mutation | novel | c.92N>T | p.Glu31Val | p.E31V | O75431 | protein_coding | deleterious(0.05) | benign(0.142) | TCGA-AJ-A3NE-01 | Endometrium | uterine corpus endometrioid carcinoma | Female | <65 | I/II | Unknown | Unknown | SD |
| MTX2 | SNV | Missense_Mutation | c.467N>G | p.Ile156Ser | p.I156S | O75431 | protein_coding | deleterious(0) | benign(0.103) | TCGA-AP-A051-01 | Endometrium | uterine corpus endometrioid carcinoma | Female | >=65 | I/II | Unknown | Unknown | SD | |
| MTX2 | SNV | Missense_Mutation | novel | c.293N>A | p.Ser98Tyr | p.S98Y | O75431 | protein_coding | deleterious(0) | probably_damaging(0.94) | TCGA-AP-A1E0-01 | Endometrium | uterine corpus endometrioid carcinoma | Female | <65 | III/IV | Chemotherapy | paclitaxel | SD |
| MTX2 | SNV | Missense_Mutation | novel | c.65C>T | p.Ala22Val | p.A22V | O75431 | protein_coding | tolerated(0.97) | benign(0.039) | TCGA-AX-A0J1-01 | Endometrium | uterine corpus endometrioid carcinoma | Female | >=65 | I/II | Unknown | Unknown | SD |
| Page: 1 2 3 |
Top |
Related drugs of malignant transformation related genes |
| Identification of chemicals and drugs interact with genes involved in malignant transfromation |
| (DGIdb 4.0) |
| Entrez ID | Symbol | Category | Interaction Types | Drug Claim Name | Drug Name | PMIDs |
| Page: 1 |

Copyright 2023-Present -The University of Texas Health Science Center at Houston |