Schematic overview of the cellular and molecular mechanisms involved in the cancer progression, including the proposed cellular and molecular mechanisms in cancer cells trajectory. AT1: alveolar type 1 cells; AT2: alveolar type 2 cells; AAH: atypical adenomatous hyperplasia; AIS: adenocarcinoma in situ; MIA: minimally invasive adenocarcinoma; IA: invasive adenocarcinoma; EMT: epithelial-mesenchymal transition

Home

Download

Statistics

Help

Contact

Center for Computational Systems Medicine
leaf

Gene summary

leaf

Malignant transformation analysis

leaf

Malignant transformation related pathway analysis

leaf

Cell-cell communication analysis

leaf

Single-cell gene regulatory network inference analysis

leaf

Somatic mutation of malignant transformation related genes

leaf

Related drugs of malignant transformation related genes

Gene: MTX1

Gene summary for MTX1

check button Gene summary.

Gene informationSpeciesHuman
Gene symbol

MTX1

Gene ID

4580

Gene namemetaxin 1
Gene AliasMTX
Cytomap1q22
Gene Typeprotein-coding
GO ID

GO:0006810

UniProtAcc

A0A0A0MRK6


Top

Malignant transformation analysis

check button Identification of the aberrant gene expression in precancerous and cancerous lesions by comparing the gene expression of stem-like cells in diseased tissues with normal stem cells
check button Malignant transformation involving gene list.
Entrez IDSymbolReplicatesSpeciesOrganTissueAdj P-valueLog2FCMalignancy
4580MTX1LZE2THumanEsophagusESCC1.47e-141.16e+000.082
4580MTX1LZE4THumanEsophagusESCC2.45e-092.90e-010.0811
4580MTX1LZE5THumanEsophagusESCC1.40e-064.15e-010.0514
4580MTX1LZE7THumanEsophagusESCC8.50e-229.58e-010.0667
4580MTX1LZE8THumanEsophagusESCC4.44e-205.42e-010.067
4580MTX1LZE20THumanEsophagusESCC4.88e-052.29e-010.0662
4580MTX1LZE21D1HumanEsophagusHGIN4.41e-044.85e-010.0632
4580MTX1LZE22D1HumanEsophagusHGIN6.34e-083.26e-010.0595
4580MTX1LZE22THumanEsophagusESCC2.25e-168.17e-010.068
4580MTX1LZE24THumanEsophagusESCC5.18e-347.13e-010.0596
4580MTX1LZE21THumanEsophagusESCC1.97e-096.03e-010.0655
4580MTX1LZE6THumanEsophagusESCC6.15e-281.01e+000.0845
4580MTX1P1T-EHumanEsophagusESCC1.98e-115.56e-010.0875
4580MTX1P2T-EHumanEsophagusESCC5.65e-558.48e-010.1177
4580MTX1P4T-EHumanEsophagusESCC1.25e-509.73e-010.1323
4580MTX1P5T-EHumanEsophagusESCC2.06e-599.43e-010.1327
4580MTX1P8T-EHumanEsophagusESCC6.31e-487.11e-010.0889
4580MTX1P9T-EHumanEsophagusESCC1.64e-408.21e-010.1131
4580MTX1P10T-EHumanEsophagusESCC9.86e-345.89e-010.116
4580MTX1P11T-EHumanEsophagusESCC2.23e-309.48e-010.1426
Page: 1 2 3 4 5 6 7 

check button Transcriptomic changes along malignancy continuum.
TissueExpression DynamicsAbbreviation
EsophagusThe image shows the transcriptomic changes along malignancy continuum.log2FC in expression of this searched gene in stem-like cells from each diseased tissue sample relative to stem-like cells in normal samples in each tissue plotted against the malignancy continuum. Samples are colored based on if they are from different disease stage.ESCC: Esophageal squamous cell carcinoma
HGIN: High-grade intraepithelial neoplasias
LGIN: Low-grade intraepithelial neoplasias
LiverThe image shows the transcriptomic changes along malignancy continuum.log2FC in expression of this searched gene in stem-like cells from each diseased tissue sample relative to stem-like cells in normal samples in each tissue plotted against the malignancy continuum. Samples are colored based on if they are from different disease stage.
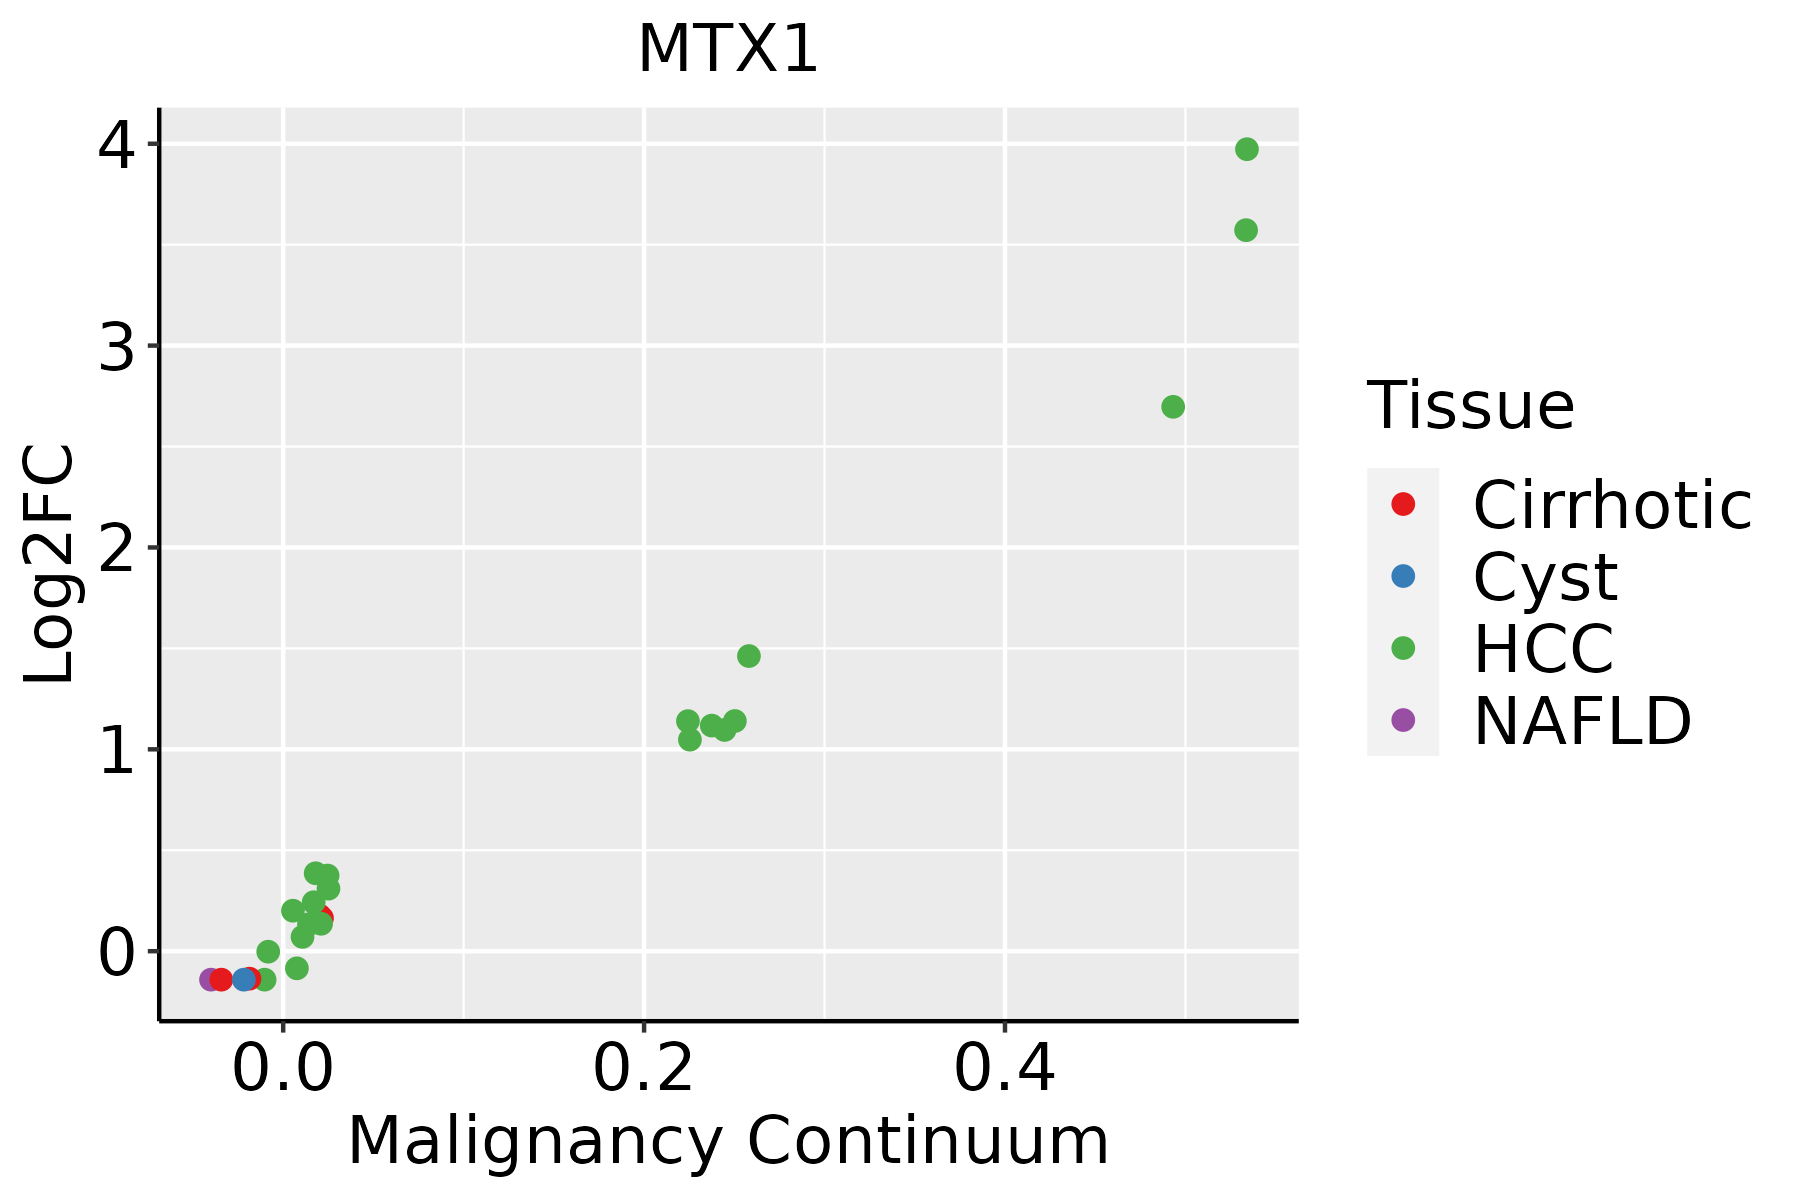
HCC: Hepatocellular carcinoma
NAFLD: Non-alcoholic fatty liver disease
Oral CavityThe image shows the transcriptomic changes along malignancy continuum.log2FC in expression of this searched gene in stem-like cells from each diseased tissue sample relative to stem-like cells in normal samples in each tissue plotted against the malignancy continuum. Samples are colored based on if they are from different disease stage.
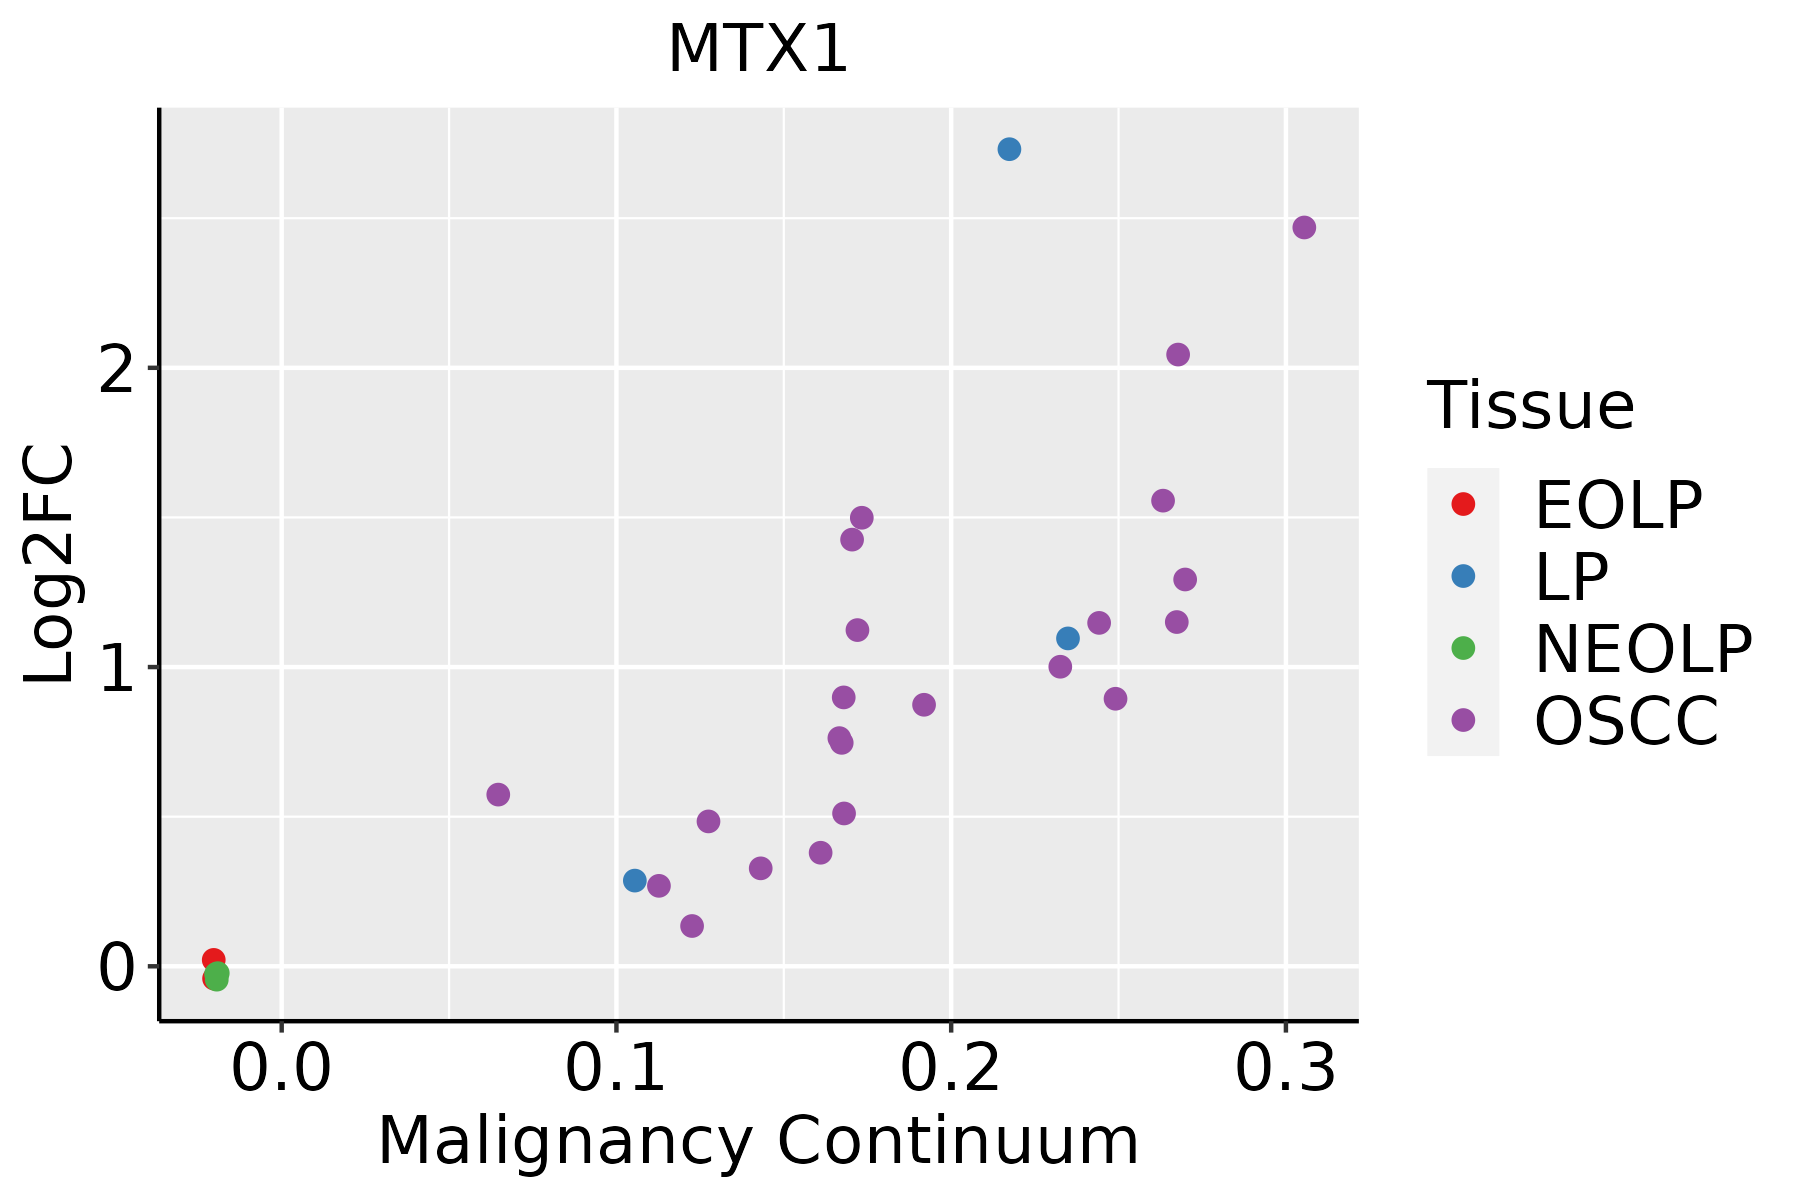
EOLP: Erosive Oral lichen planus
LP: leukoplakia
NEOLP: Non-erosive oral lichen planus
OSCC: Oral squamous cell carcinoma
SkinThe image shows the transcriptomic changes along malignancy continuum.log2FC in expression of this searched gene in stem-like cells from each diseased tissue sample relative to stem-like cells in normal samples in each tissue plotted against the malignancy continuum. Samples are colored based on if they are from different disease stage.
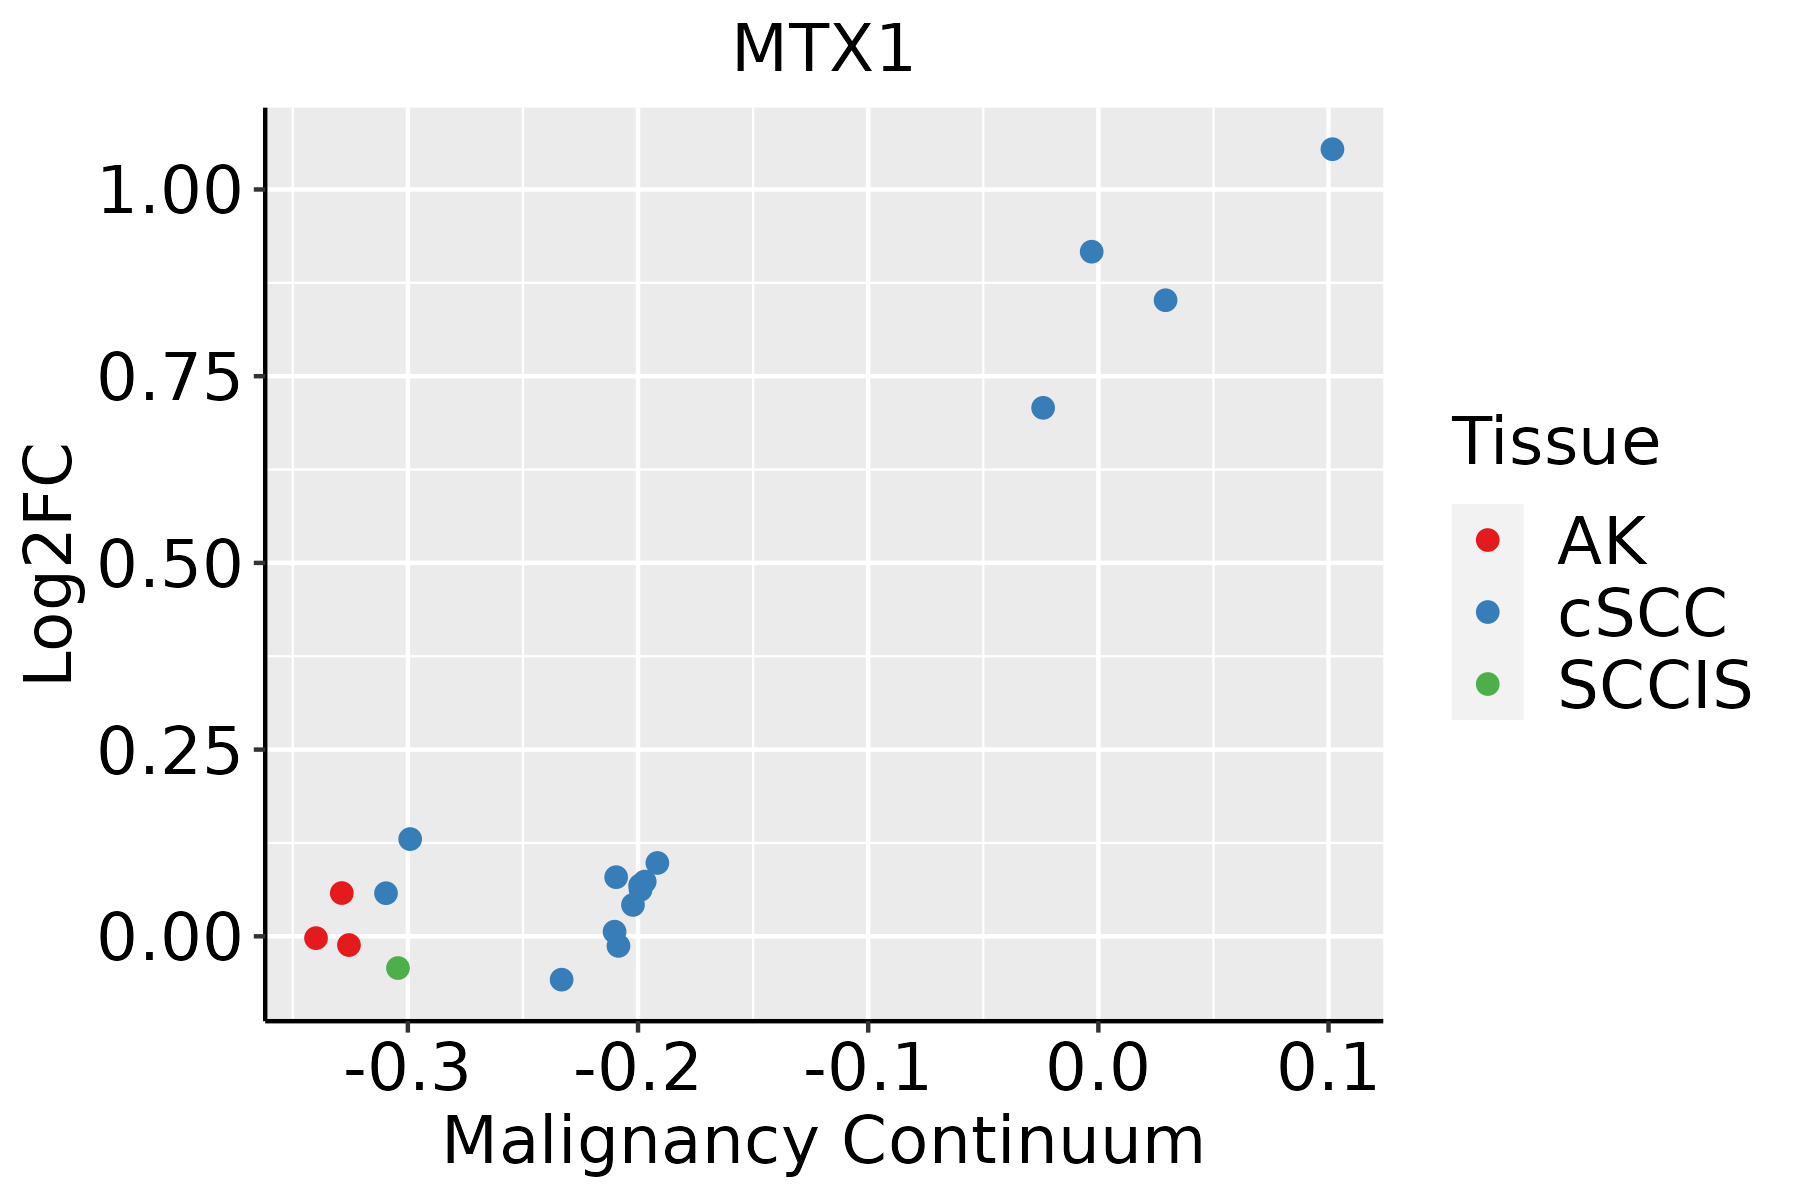
AK: Actinic keratosis
cSCC: Cutaneous squamous cell carcinoma
SCCIS:squamous cell carcinoma in situ
ThyroidThe image shows the transcriptomic changes along malignancy continuum.log2FC in expression of this searched gene in stem-like cells from each diseased tissue sample relative to stem-like cells in normal samples in each tissue plotted against the malignancy continuum. Samples are colored based on if they are from different disease stage.
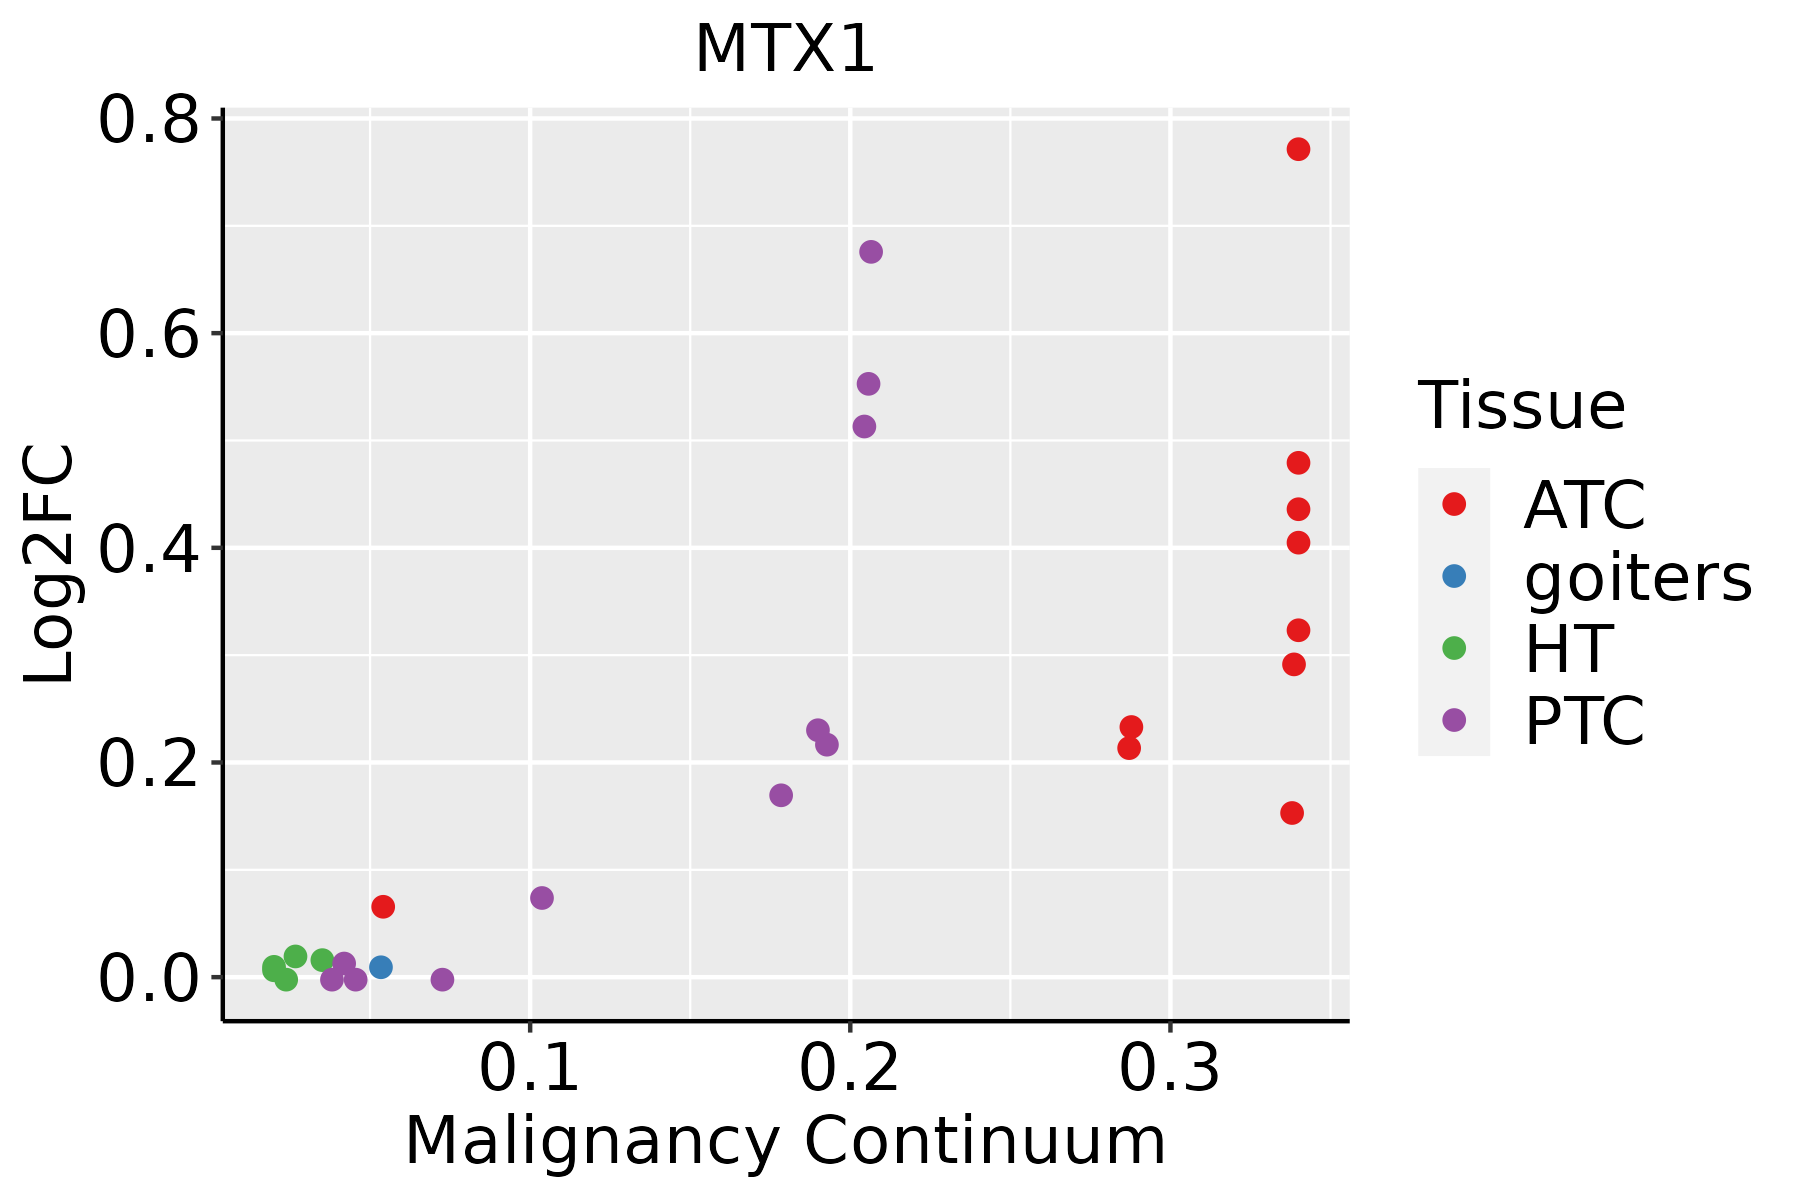
ATC: Anaplastic thyroid cancer
HT: Hashimoto's thyroiditis
PTC: Papillary thyroid cancer
∗log2FC in expression of this searched gene in stem-like cells from each diseased tissue sample relative to stem-like cells in normal samples in each tissue plotted against the malignancy continuum. Samples are colored based on if they are from different disease stage.

Top

Malignant transformation related pathway analysis

check buttonFind out the enriched GO biological processes and KEGG pathways involved in transition from healthy to precancer to cancer
check button Figure of enriched GO biological processes.
TissueDisease StageEnriched GO biological Processes
ColorectumADGO analysis - Figure of enriched GO biological processes: Top 15 enriched GO BP terms are showed in the bar plot of each disease state in each tissue. Each row represents a significant GO biological process which is colored according to the -log10(p.adjust).
ColorectumSERGO analysis - Figure of enriched GO biological processes: Top 15 enriched GO BP terms are showed in the bar plot of each disease state in each tissue. Each row represents a significant GO biological process which is colored according to the -log10(p.adjust).
ColorectumMSSGO analysis - Figure of enriched GO biological processes: Top 15 enriched GO BP terms are showed in the bar plot of each disease state in each tissue. Each row represents a significant GO biological process which is colored according to the -log10(p.adjust).
ColorectumMSI-HGO analysis - Figure of enriched GO biological processes: Top 15 enriched GO BP terms are showed in the bar plot of each disease state in each tissue. Each row represents a significant GO biological process which is colored according to the -log10(p.adjust).
ColorectumFAPGO analysis - Figure of enriched GO biological processes: Top 15 enriched GO BP terms are showed in the bar plot of each disease state in each tissue. Each row represents a significant GO biological process which is colored according to the -log10(p.adjust).
∗Top 15 enriched GO BP terms are showed in the bar plot of each disease state in each tissue. Each row represents a significant GO biological process which is colored according to the -log10(p.adjust).
Page: 1 2 3 4 5 6 7 8 9 

check button Enriched GO biological processes.
GO IDTissueDisease StageDescriptionGene RatioBg Ratiopvaluep.adjustCount
GO:000700618EsophagusHGINmitochondrial membrane organization37/2587116/187234.61e-072.07e-0537
GO:00070076EsophagusHGINinner mitochondrial membrane organization16/258738/187231.82e-054.93e-0416
GO:004873225EsophagusHGINgland development88/2587436/187231.34e-042.71e-0388
GO:000700619EsophagusESCCmitochondrial membrane organization93/8552116/187232.16e-141.11e-1293
GO:0048732111EsophagusESCCgland development269/8552436/187237.81e-122.95e-10269
GO:000700713EsophagusESCCinner mitochondrial membrane organization31/855238/187235.93e-066.10e-0531
GO:003087914EsophagusESCCmammary gland development85/8552137/187238.11e-056.01e-0485
GO:00070065LiverCirrhoticmitochondrial membrane organization57/4634116/187231.13e-084.29e-0757
GO:004873212LiverCirrhoticgland development154/4634436/187234.03e-079.42e-06154
GO:00070073LiverCirrhoticinner mitochondrial membrane organization19/463438/187236.75e-045.06e-0319
GO:005087812LiverCirrhoticregulation of body fluid levels118/4634379/187232.65e-031.55e-02118
GO:000700612LiverHCCmitochondrial membrane organization80/7958116/187237.09e-091.81e-0780
GO:004873222LiverHCCgland development242/7958436/187232.26e-085.28e-07242
GO:000700711LiverHCCinner mitochondrial membrane organization28/795838/187239.60e-058.34e-0428
GO:005087822LiverHCCregulation of body fluid levels191/7958379/187231.06e-036.11e-03191
GO:00308795LiverHCCmammary gland development75/7958137/187232.52e-031.22e-0275
GO:00075951LiverHCClactation29/795847/187236.16e-032.52e-0229
GO:000700610Oral cavityOSCCmitochondrial membrane organization85/7305116/187236.29e-143.40e-1285
GO:004873220Oral cavityOSCCgland development226/7305436/187232.78e-085.39e-07226
GO:00070075Oral cavityOSCCinner mitochondrial membrane organization27/730538/187236.23e-055.08e-0427
Page: 1 2 

check button Enriched KEGG pathways.
Pathway IDTissueDisease StageDescriptionGene RatioBg Ratiopvaluep.adjustqvalueCount
Page: 1 

Top

Cell-cell communication analysis

check buttonIdentification of potential cell-cell interactions between two cell types and their ligand-receptor pairs for different disease states
LigandReceptorLRpairPathwayTissueDisease Stage
Page: 1 

Top

Single-cell gene regulatory network inference analysis

check buttonFind out the significant the regulons (TFs) and the target genes of each regulon across cell types for different disease states
TFCell TypeTissueDisease StageTarget GeneRSSRegulon Activity
∗The dot plots of a searched regulon are shown for all cell subpopulations in each disease state of each tissue based on the regulon specific score inferred using pySCENIC and by calculating the average expression.
Page: 1 

Top

Somatic mutation of malignant transformation related genes

check buttonAnnotation of somatic variants for genes involved in malignant transformation
Hugo SymbolVariant ClassVariant ClassificationdbSNP RSHGVScHGVSpHGVSp ShortSWISSPROTBIOTYPESIFTPolyPhenTumor Sample BarcodeTissueHistologySexAgeStageTherapy TypesDrugsOutcome
MTX1SNVMissense_Mutationrs200446524c.895C>Tp.Arg299Trpp.R299Wprotein_codingdeleterious(0)probably_damaging(0.999)TCGA-2W-A8YY-01Cervixcervical & endocervical cancerFemale<65I/IIChemotherapycisplatinCR
MTX1SNVMissense_Mutationc.416N>Cp.Lys139Thrp.K139Tprotein_codingtolerated_low_confidence(0.4)benign(0.076)TCGA-CA-6718-01Colorectumcolon adenocarcinomaMale<65I/IIUnknownUnknownPD
MTX1insertionFrame_Shift_Insnovelc.480_481insGp.Trp163LeufsTer69p.W163Lfs*69protein_codingTCGA-G4-6628-01Colorectumcolon adenocarcinomaMale>=65I/IIUnknownUnknownSD
MTX1SNVMissense_Mutationnovelc.834N>Tp.Glu278Aspp.E278Dprotein_codingdeleterious(0.04)probably_damaging(0.999)TCGA-A5-A0G2-01Endometriumuterine corpus endometrioid carcinomaFemale<65III/IVUnknownUnknownSD
MTX1SNVMissense_Mutationrs776764435c.1031C>Tp.Ala344Valp.A344Vprotein_codingdeleterious(0.04)possibly_damaging(0.908)TCGA-AP-A051-01Endometriumuterine corpus endometrioid carcinomaFemale>=65I/IIUnknownUnknownSD
MTX1SNVMissense_Mutationnovelc.779N>Ap.Thr260Asnp.T260Nprotein_codingdeleterious(0)probably_damaging(1)TCGA-AP-A059-01Endometriumuterine corpus endometrioid carcinomaFemale>=65I/IIUnknownUnknownSD
MTX1SNVMissense_Mutationrs201017167c.682T>Cp.Tyr228Hisp.Y228Hprotein_codingdeleterious(0)probably_damaging(0.983)TCGA-AP-A0LD-01Endometriumuterine corpus endometrioid carcinomaFemale<65I/IIUnknownUnknownSD
MTX1SNVMissense_Mutationnovelc.1020N>Ap.Phe340Leup.F340Lprotein_codingdeleterious(0.01)probably_damaging(0.917)TCGA-AX-A05Z-01Endometriumuterine corpus endometrioid carcinomaFemale<65III/IVChemotherapyadriamycinSD
MTX1SNVMissense_Mutationnovelc.766G>Ap.Val256Metp.V256Mprotein_codingtolerated(0.05)possibly_damaging(0.596)TCGA-AX-A2HD-01Endometriumuterine corpus endometrioid carcinomaFemale>=65III/IVUnknownUnknownSD
MTX1SNVMissense_Mutationc.994N>Gp.Gln332Glup.Q332Eprotein_codingtolerated(0.06)possibly_damaging(0.539)TCGA-B5-A11R-01Endometriumuterine corpus endometrioid carcinomaFemale<65I/IIChemotherapypaclitaxelSD
Page: 1 2 3 

Top

Related drugs of malignant transformation related genes

check buttonIdentification of chemicals and drugs interact with genes involved in malignant transfromation
(DGIdb 4.0)
Entrez IDSymbolCategoryInteraction TypesDrug Claim NameDrug NamePMIDs
Page: 1