
|
|||||
|
 | |
| |
| |
| |
| |
| |
|
Gene: MTUS1 |
Gene summary for MTUS1 |
| Gene information | Species | Human | Gene symbol | MTUS1 | Gene ID | 57509 |
| Gene name | microtubule associated scaffold protein 1 | |
| Gene Alias | ATBP | |
| Cytomap | 8p22 | |
| Gene Type | protein-coding | GO ID | GO:0002376 | UniProtAcc | Q9ULD2 |
Top |
Malignant transformation analysis |
| Identification of the aberrant gene expression in precancerous and cancerous lesions by comparing the gene expression of stem-like cells in diseased tissues with normal stem cells |
| Entrez ID | Symbol | Replicates | Species | Organ | Tissue | Adj P-value | Log2FC | Malignancy |
| 57509 | MTUS1 | CA_HPV_1 | Human | Cervix | CC | 1.95e-08 | -2.25e-01 | 0.0264 |
| 57509 | MTUS1 | CA_HPV_3 | Human | Cervix | CC | 6.92e-05 | 1.61e-01 | 0.0414 |
| 57509 | MTUS1 | CCI_1 | Human | Cervix | CC | 4.88e-07 | 1.11e+00 | 0.528 |
| 57509 | MTUS1 | CCI_2 | Human | Cervix | CC | 1.27e-09 | 1.44e+00 | 0.5249 |
| 57509 | MTUS1 | CCI_3 | Human | Cervix | CC | 1.35e-17 | 1.30e+00 | 0.516 |
| 57509 | MTUS1 | sample3 | Human | Cervix | CC | 1.31e-05 | 1.03e-01 | 0.1387 |
| 57509 | MTUS1 | H2 | Human | Cervix | HSIL_HPV | 1.05e-09 | 3.98e-01 | 0.0632 |
| 57509 | MTUS1 | HTA11_3410_2000001011 | Human | Colorectum | AD | 1.97e-28 | -8.09e-01 | 0.0155 |
| 57509 | MTUS1 | HTA11_2951_2000001011 | Human | Colorectum | AD | 5.18e-04 | -7.24e-01 | 0.0216 |
| 57509 | MTUS1 | HTA11_347_2000001011 | Human | Colorectum | AD | 1.36e-07 | 5.03e-01 | -0.1954 |
| 57509 | MTUS1 | HTA11_3361_2000001011 | Human | Colorectum | AD | 4.48e-06 | -6.04e-01 | -0.1207 |
| 57509 | MTUS1 | HTA11_7862_2000001011 | Human | Colorectum | AD | 2.39e-05 | -6.88e-01 | -0.0179 |
| 57509 | MTUS1 | HTA11_866_3004761011 | Human | Colorectum | AD | 6.49e-22 | -8.32e-01 | 0.096 |
| 57509 | MTUS1 | HTA11_10711_2000001011 | Human | Colorectum | AD | 4.02e-08 | -6.81e-01 | 0.0338 |
| 57509 | MTUS1 | HTA11_7696_3000711011 | Human | Colorectum | AD | 2.11e-28 | -6.93e-01 | 0.0674 |
| 57509 | MTUS1 | HTA11_6818_2000001011 | Human | Colorectum | AD | 1.09e-05 | -6.18e-01 | 0.0112 |
| 57509 | MTUS1 | HTA11_6818_2000001021 | Human | Colorectum | AD | 7.69e-04 | -6.21e-01 | 0.0588 |
| 57509 | MTUS1 | HTA11_99999970781_79442 | Human | Colorectum | MSS | 4.61e-19 | -6.10e-01 | 0.294 |
| 57509 | MTUS1 | HTA11_99999965104_69814 | Human | Colorectum | MSS | 1.92e-06 | -7.10e-01 | 0.281 |
| 57509 | MTUS1 | HTA11_99999971662_82457 | Human | Colorectum | MSS | 1.83e-16 | -5.84e-01 | 0.3859 |
| Page: 1 2 3 4 5 6 7 8 9 10 11 12 |
| Tissue | Expression Dynamics | Abbreviation |
| Cervix | 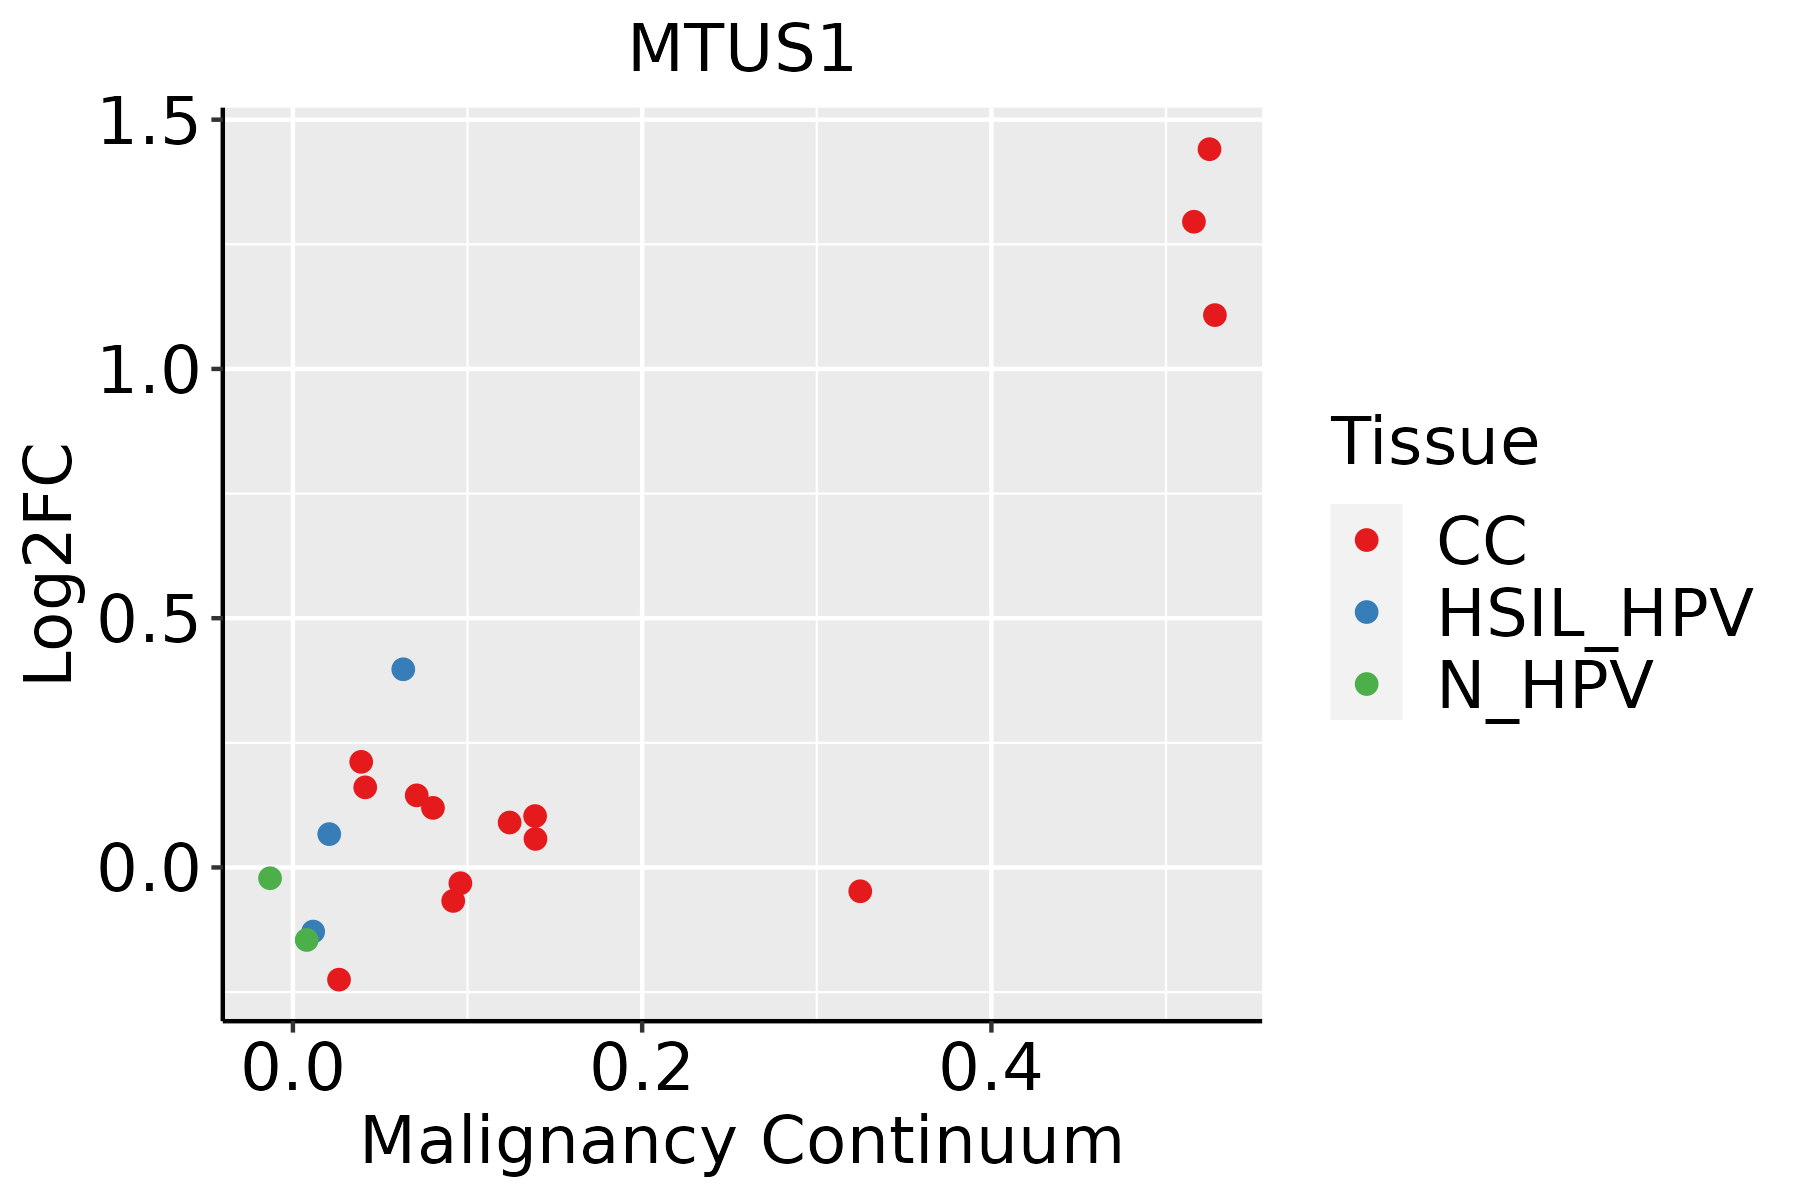 | CC: Cervix cancer |
| HSIL_HPV: HPV-infected high-grade squamous intraepithelial lesions | ||
| N_HPV: HPV-infected normal cervix | ||
| Colorectum (GSE201348) |  | FAP: Familial adenomatous polyposis |
| CRC: Colorectal cancer | ||
| Colorectum (HTA11) |  | AD: Adenomas |
| SER: Sessile serrated lesions | ||
| MSI-H: Microsatellite-high colorectal cancer | ||
| MSS: Microsatellite stable colorectal cancer | ||
| Endometrium |  | AEH: Atypical endometrial hyperplasia |
| EEC: Endometrioid Cancer | ||
| Esophagus |  | ESCC: Esophageal squamous cell carcinoma |
| HGIN: High-grade intraepithelial neoplasias | ||
| LGIN: Low-grade intraepithelial neoplasias | ||
| Liver | 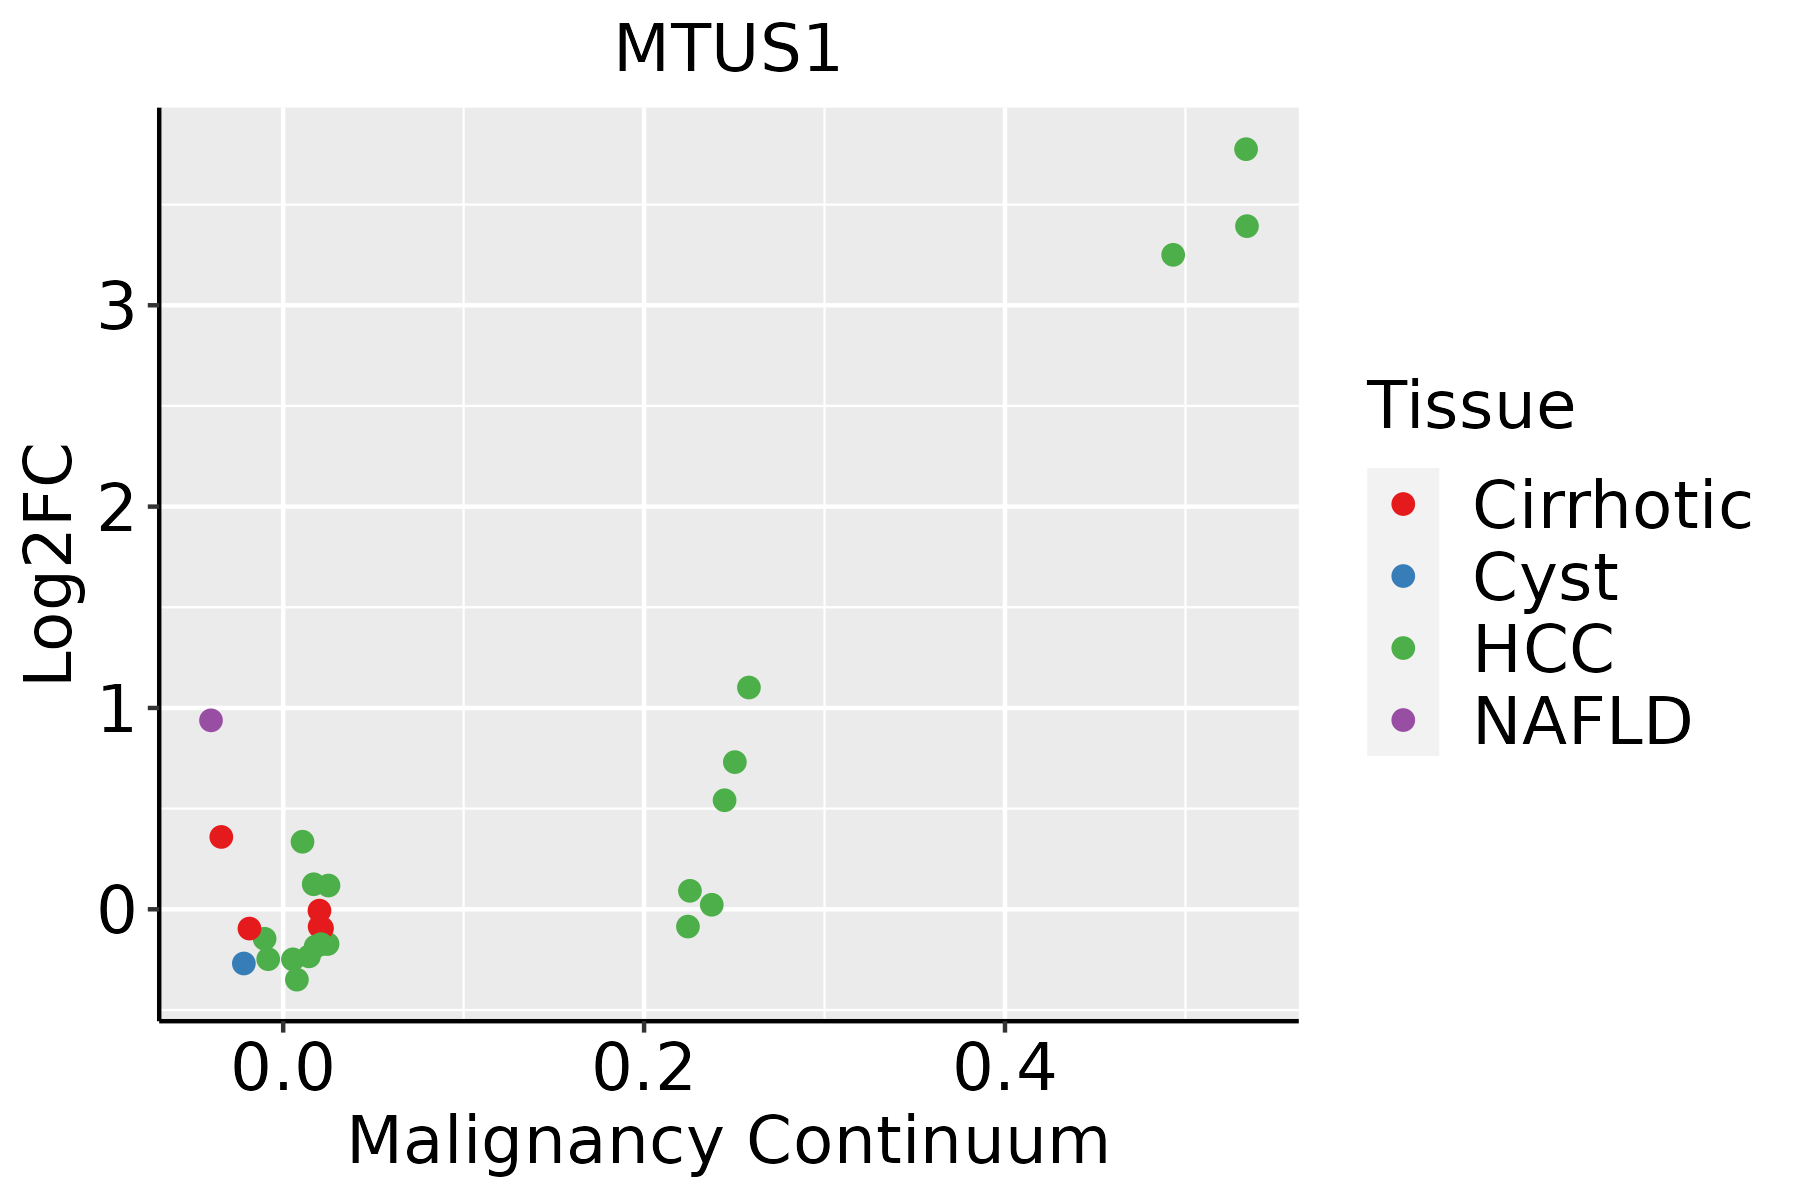 | HCC: Hepatocellular carcinoma |
| NAFLD: Non-alcoholic fatty liver disease | ||
| Lung | 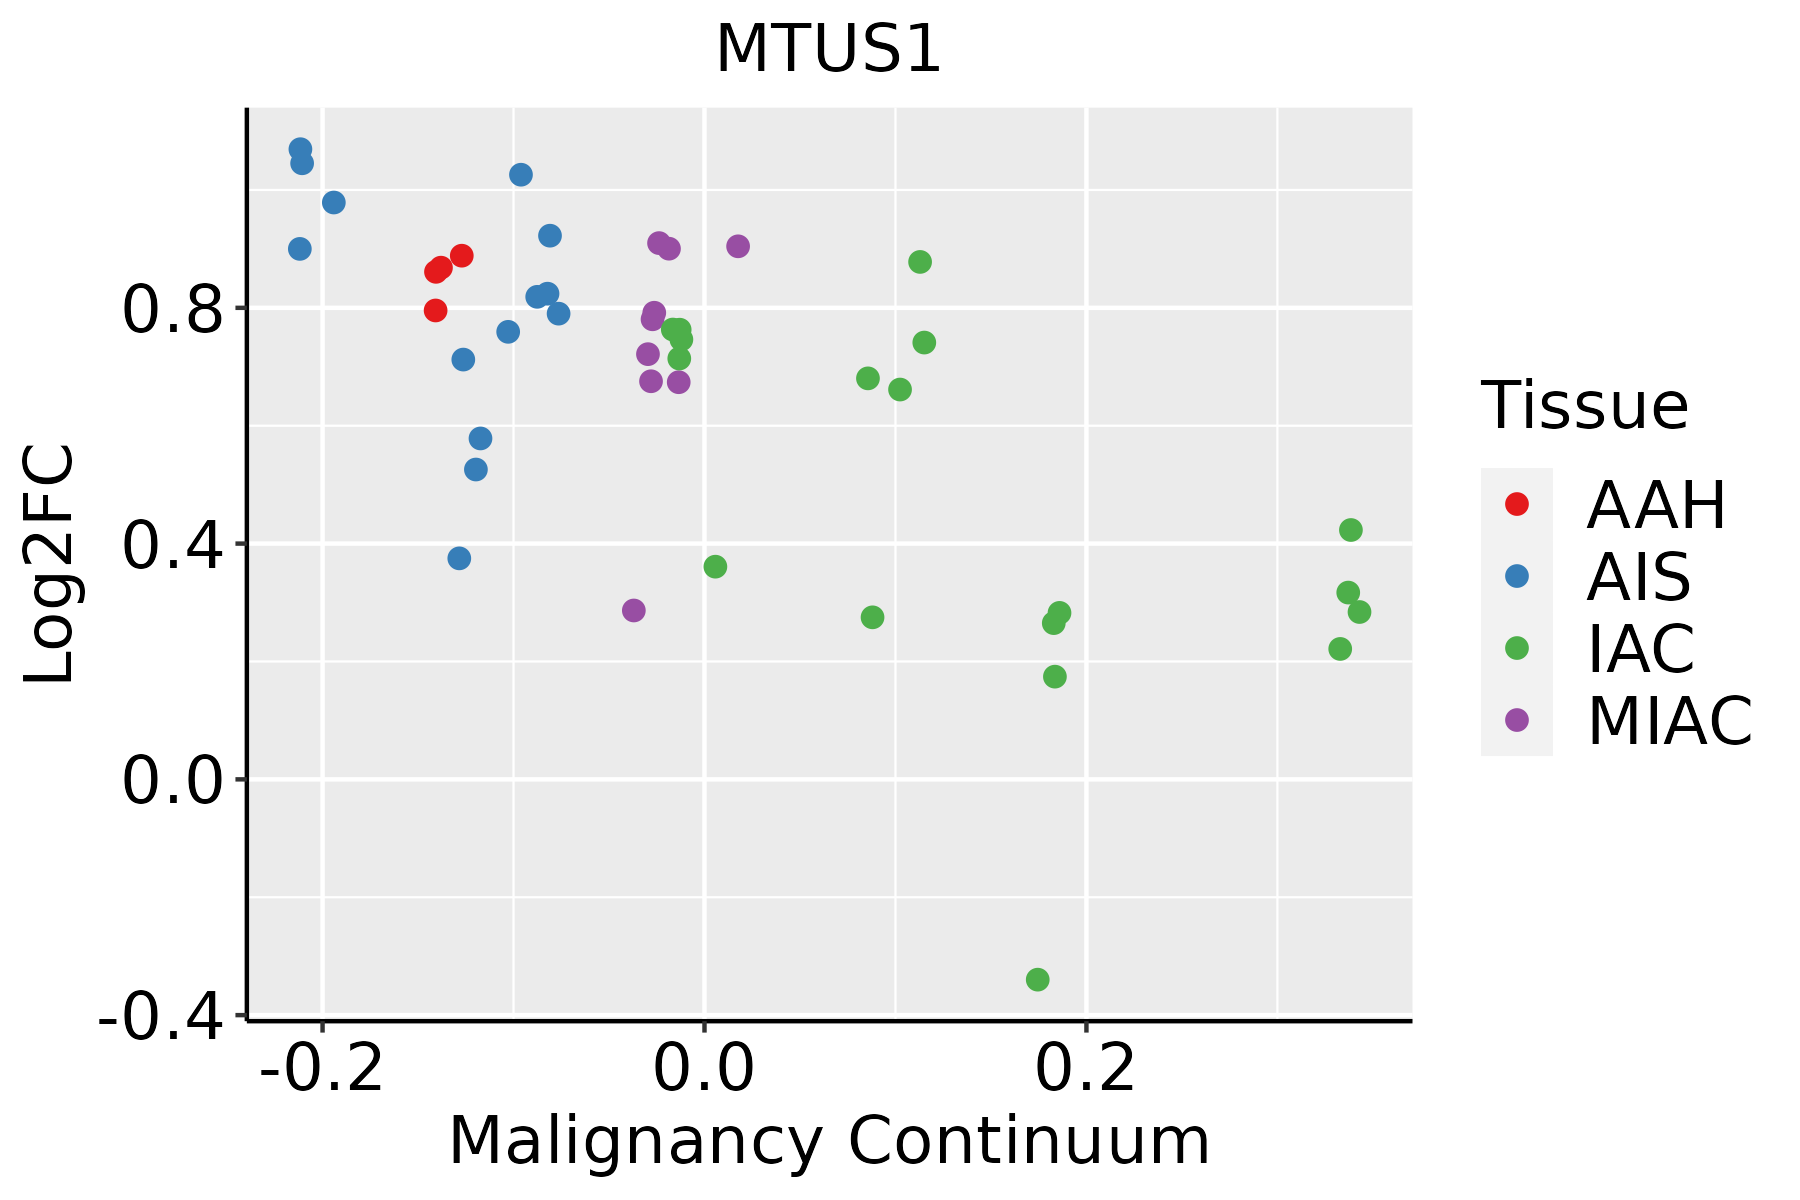 | AAH: Atypical adenomatous hyperplasia |
| AIS: Adenocarcinoma in situ | ||
| IAC: Invasive lung adenocarcinoma | ||
| MIA: Minimally invasive adenocarcinoma | ||
| Oral Cavity |  | EOLP: Erosive Oral lichen planus |
| LP: leukoplakia | ||
| NEOLP: Non-erosive oral lichen planus | ||
| OSCC: Oral squamous cell carcinoma | ||
| Prostate |  | BPH: Benign Prostatic Hyperplasia |
| Skin | 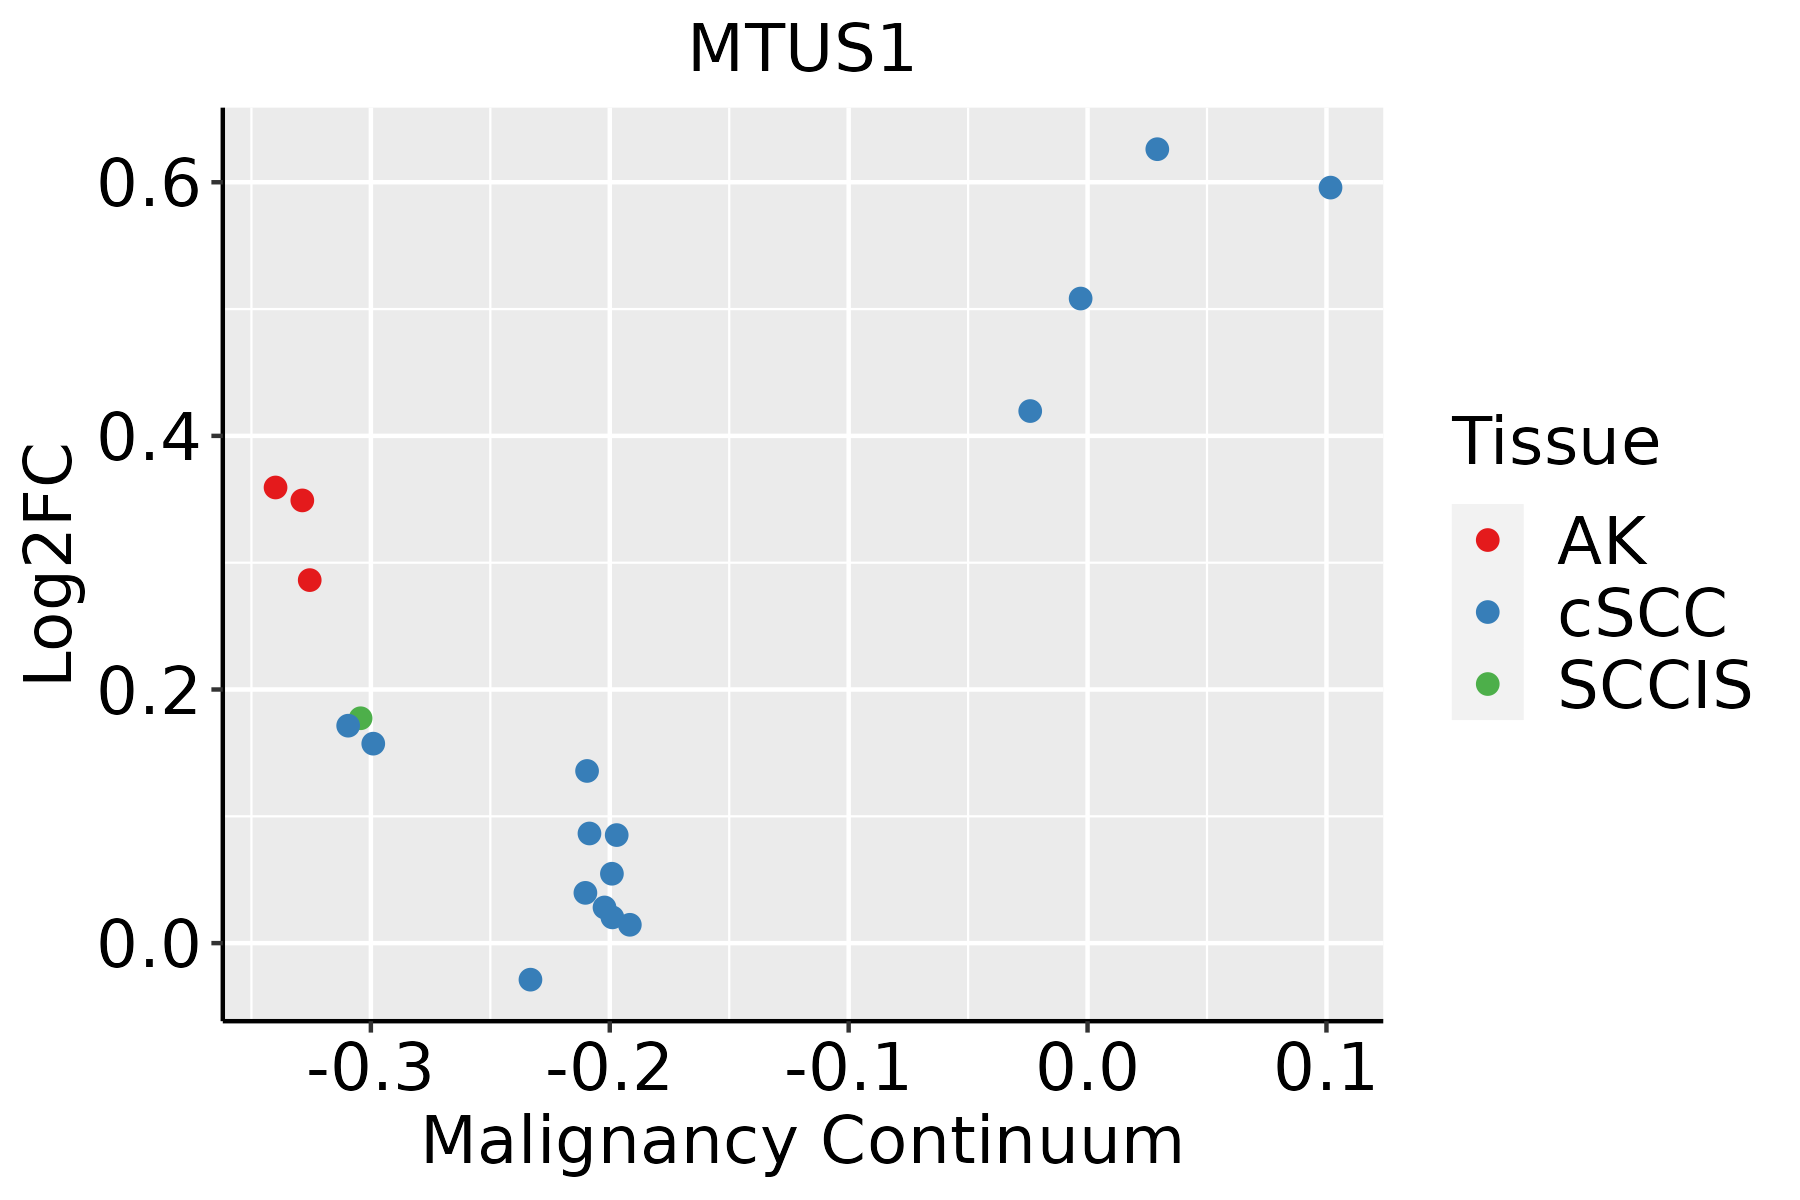 | AK: Actinic keratosis |
| cSCC: Cutaneous squamous cell carcinoma | ||
| SCCIS:squamous cell carcinoma in situ | ||
| Thyroid | 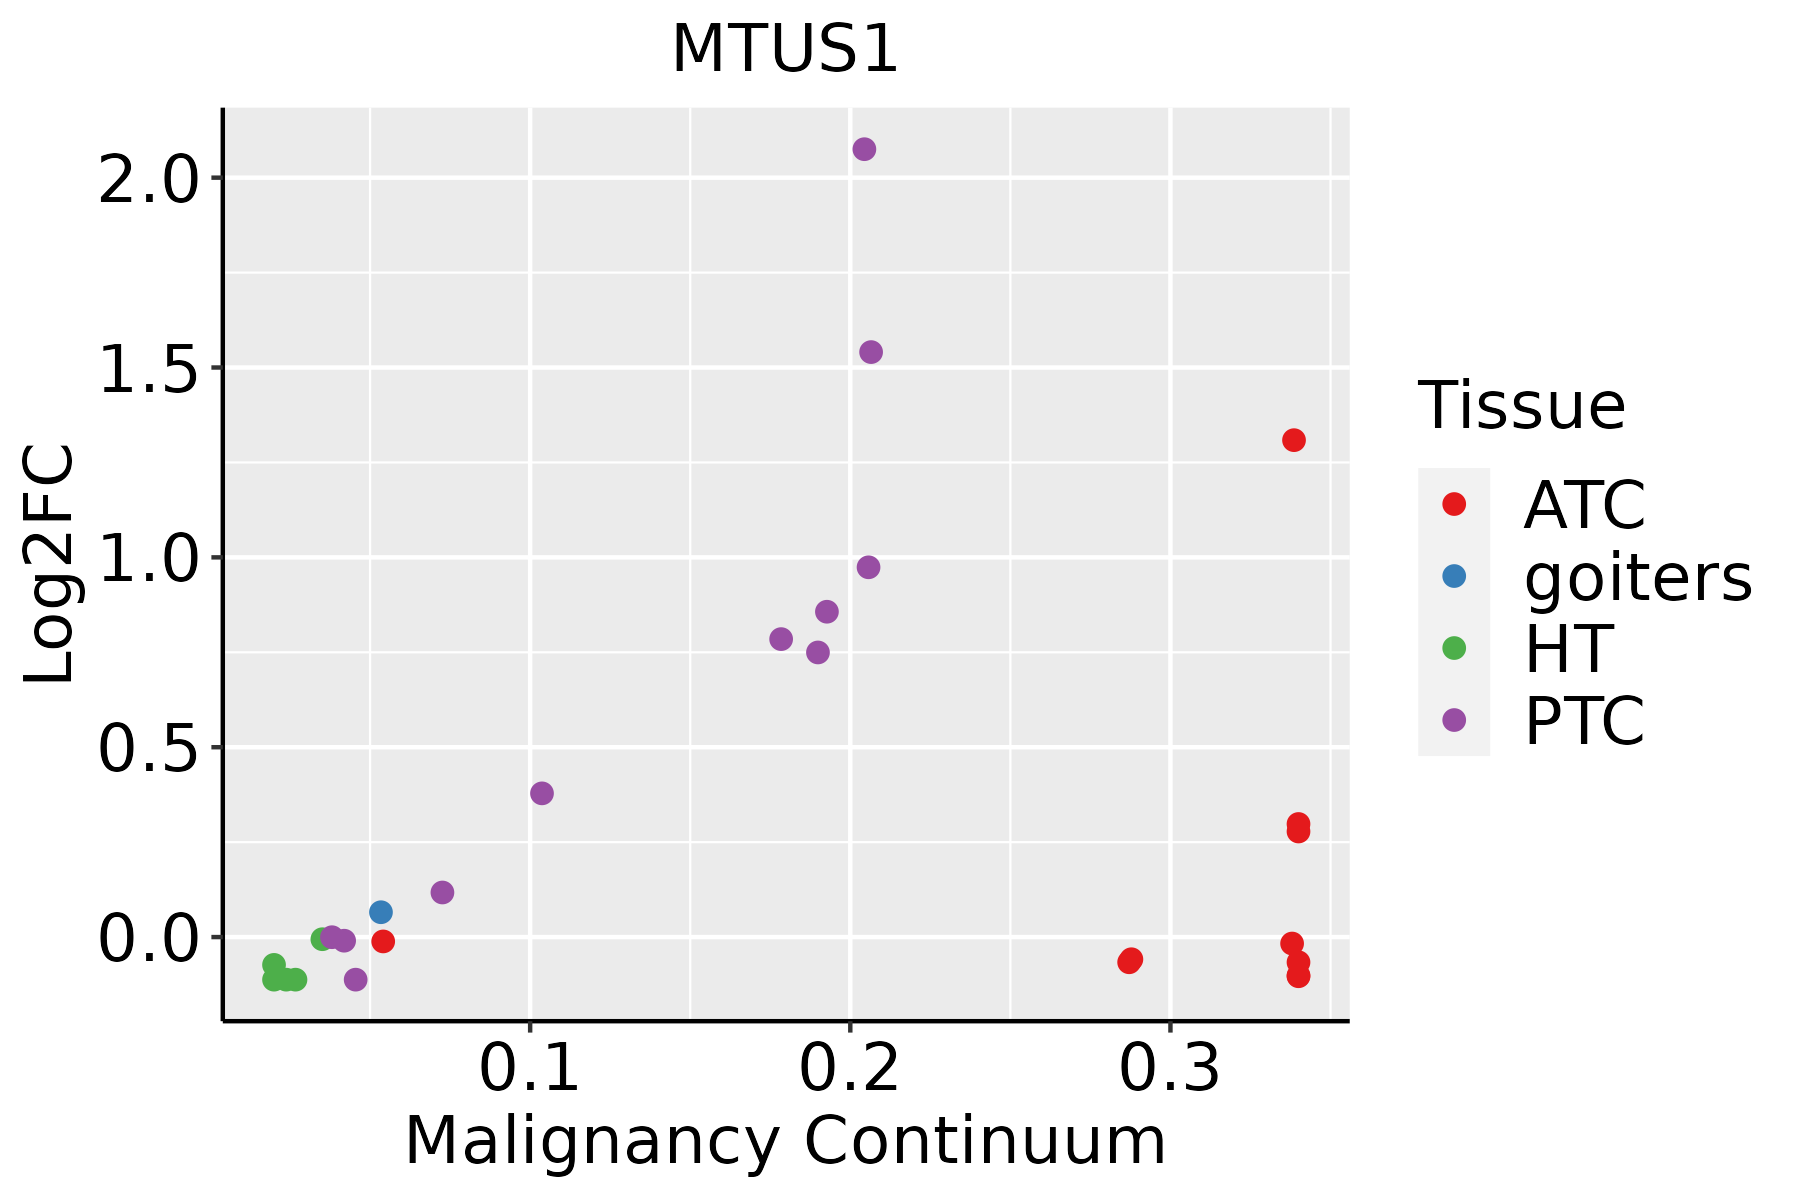 | ATC: Anaplastic thyroid cancer |
| HT: Hashimoto's thyroiditis | ||
| PTC: Papillary thyroid cancer |
| ∗log2FC in expression of this searched gene in stem-like cells from each diseased tissue sample relative to stem-like cells in normal samples in each tissue plotted against the malignancy continuum. Samples are colored based on if they are from different disease stage. |
Top |
Malignant transformation related pathway analysis |
| Find out the enriched GO biological processes and KEGG pathways involved in transition from healthy to precancer to cancer |
| Tissue | Disease Stage | Enriched GO biological Processes |
| Colorectum | AD |  |
| Colorectum | SER |  |
| Colorectum | MSS |  |
| Colorectum | MSI-H |  |
| Colorectum | FAP |  |
| ∗Top 15 enriched GO BP terms are showed in the bar plot of each disease state in each tissue. Each row represents a significant GO biological process which is colored according to the -log10(p.adjust). |
| Page: 1 2 3 4 5 6 7 8 9 |
| GO ID | Tissue | Disease Stage | Description | Gene Ratio | Bg Ratio | pvalue | p.adjust | Count |
| GO:00603267 | Cervix | CC | cell chemotaxis | 73/2311 | 310/18723 | 2.82e-08 | 1.96e-06 | 73 |
| GO:00975298 | Cervix | CC | myeloid leukocyte migration | 56/2311 | 220/18723 | 7.21e-08 | 4.15e-06 | 56 |
| GO:00305957 | Cervix | CC | leukocyte chemotaxis | 57/2311 | 230/18723 | 1.48e-07 | 7.07e-06 | 57 |
| GO:00509007 | Cervix | CC | leukocyte migration | 78/2311 | 369/18723 | 1.09e-06 | 3.80e-05 | 78 |
| GO:00026857 | Cervix | CC | regulation of leukocyte migration | 50/2311 | 210/18723 | 2.95e-06 | 8.31e-05 | 50 |
| GO:00026888 | Cervix | CC | regulation of leukocyte chemotaxis | 34/2311 | 122/18723 | 3.00e-06 | 8.38e-05 | 34 |
| GO:00509203 | Cervix | CC | regulation of chemotaxis | 51/2311 | 223/18723 | 8.03e-06 | 1.86e-04 | 51 |
| GO:00482464 | Cervix | CC | macrophage chemotaxis | 14/2311 | 38/18723 | 9.80e-05 | 1.27e-03 | 14 |
| GO:19055174 | Cervix | CC | macrophage migration | 16/2311 | 55/18723 | 7.23e-04 | 6.51e-03 | 16 |
| GO:19055212 | Cervix | CC | regulation of macrophage migration | 11/2311 | 41/18723 | 9.17e-03 | 4.62e-02 | 11 |
| GO:006032612 | Cervix | HSIL_HPV | cell chemotaxis | 36/737 | 310/18723 | 6.69e-09 | 8.80e-07 | 36 |
| GO:009752912 | Cervix | HSIL_HPV | myeloid leukocyte migration | 29/737 | 220/18723 | 1.19e-08 | 1.30e-06 | 29 |
| GO:003059512 | Cervix | HSIL_HPV | leukocyte chemotaxis | 29/737 | 230/18723 | 3.25e-08 | 2.70e-06 | 29 |
| GO:005090012 | Cervix | HSIL_HPV | leukocyte migration | 38/737 | 369/18723 | 6.67e-08 | 4.59e-06 | 38 |
| GO:000268512 | Cervix | HSIL_HPV | regulation of leukocyte migration | 25/737 | 210/18723 | 8.55e-07 | 4.16e-05 | 25 |
| GO:190551712 | Cervix | HSIL_HPV | macrophage migration | 11/737 | 55/18723 | 8.02e-06 | 2.84e-04 | 11 |
| GO:004824612 | Cervix | HSIL_HPV | macrophage chemotaxis | 9/737 | 38/18723 | 1.26e-05 | 4.05e-04 | 9 |
| GO:000268812 | Cervix | HSIL_HPV | regulation of leukocyte chemotaxis | 15/737 | 122/18723 | 9.01e-05 | 1.96e-03 | 15 |
| GO:19055211 | Cervix | HSIL_HPV | regulation of macrophage migration | 8/737 | 41/18723 | 1.67e-04 | 3.17e-03 | 8 |
| GO:005092011 | Cervix | HSIL_HPV | regulation of chemotaxis | 21/737 | 223/18723 | 2.05e-04 | 3.70e-03 | 21 |
| Page: 1 2 3 4 |
| Pathway ID | Tissue | Disease Stage | Description | Gene Ratio | Bg Ratio | pvalue | p.adjust | qvalue | Count |
| Page: 1 |
Top |
Cell-cell communication analysis |
| Identification of potential cell-cell interactions between two cell types and their ligand-receptor pairs for different disease states |
| Ligand | Receptor | LRpair | Pathway | Tissue | Disease Stage |
| Page: 1 |
Top |
Single-cell gene regulatory network inference analysis |
| Find out the significant the regulons (TFs) and the target genes of each regulon across cell types for different disease states |
| TF | Cell Type | Tissue | Disease Stage | Target Gene | RSS | Regulon Activity |
| ∗The dot plots of a searched regulon are shown for all cell subpopulations in each disease state of each tissue based on the regulon specific score inferred using pySCENIC and by calculating the average expression. |
| Page: 1 |
Top |
Somatic mutation of malignant transformation related genes |
| Annotation of somatic variants for genes involved in malignant transformation |
| Hugo Symbol | Variant Class | Variant Classification | dbSNP RS | HGVSc | HGVSp | HGVSp Short | SWISSPROT | BIOTYPE | SIFT | PolyPhen | Tumor Sample Barcode | Tissue | Histology | Sex | Age | Stage | Therapy Types | Drugs | Outcome |
| MTUS1 | SNV | Missense_Mutation | novel | c.262N>A | p.Asp88Asn | p.D88N | Q9ULD2 | protein_coding | deleterious(0.04) | benign(0.01) | TCGA-AN-A046-01 | Breast | breast invasive carcinoma | Female | >=65 | I/II | Unknown | Unknown | SD |
| MTUS1 | SNV | Missense_Mutation | novel | c.2840N>T | p.Arg947Leu | p.R947L | Q9ULD2 | protein_coding | deleterious(0) | benign(0.015) | TCGA-BH-A6R9-01 | Breast | breast invasive carcinoma | Female | <65 | I/II | Unknown | Unknown | SD |
| MTUS1 | insertion | Nonsense_Mutation | novel | c.3138_3139insATACTATAGATGTAAAGTAACGTCATACGGCTTCATCA | p.Ser1047IlefsTer3 | p.S1047Ifs*3 | Q9ULD2 | protein_coding | TCGA-A7-A0CG-01 | Breast | breast invasive carcinoma | Female | >=65 | I/II | Unknown | Unknown | SD | ||
| MTUS1 | insertion | In_Frame_Ins | novel | c.75_76insCTA | p.Asn25_Thr26insLeu | p.N25_T26insL | Q9ULD2 | protein_coding | TCGA-A7-A26I-01 | Breast | breast invasive carcinoma | Female | >=65 | I/II | Chemotherapy | cytoxan | SD | ||
| MTUS1 | insertion | Frame_Shift_Ins | novel | c.1690_1691insGTGCCTTAGTTATATTATGCCATTTAATGGGC | p.Asp564GlyfsTer18 | p.D564Gfs*18 | Q9ULD2 | protein_coding | TCGA-AO-A0JD-01 | Breast | breast invasive carcinoma | Female | <65 | III/IV | Chemotherapy | cyclophosphamide | SD | ||
| MTUS1 | insertion | Nonsense_Mutation | novel | c.918_919insGCCCGCCAGGACAAAAGGTGGGCTCGTCATTTGGACTGACTTGGG | p.Ala306_Leu307insAlaArgGlnAspLysArgTrpAlaArgHisLeuAspTerLeuGly | p.A306_L307insARQDKRWARHLD*LG | Q9ULD2 | protein_coding | TCGA-BH-A0BJ-01 | Breast | breast invasive carcinoma | Female | <65 | I/II | Chemotherapy | doxorubicin | SD | ||
| MTUS1 | deletion | Frame_Shift_Del | novel | c.3425_3459delGCCTGAAAGCTGTGTTAGAGATCAAGAATGAGAAA | p.Ser1142ThrfsTer23 | p.S1142Tfs*23 | Q9ULD2 | protein_coding | TCGA-BH-A0BL-01 | Breast | breast invasive carcinoma | Female | <65 | I/II | Chemotherapy | adriamycin | CR | ||
| MTUS1 | insertion | Frame_Shift_Ins | novel | c.1553_1554insTGTTTTTGGTA | p.Leu520PhefsTer30 | p.L520Ffs*30 | Q9ULD2 | protein_coding | TCGA-BH-A0BM-01 | Breast | breast invasive carcinoma | Female | <65 | I/II | Chemotherapy | adriamycin | SD | ||
| MTUS1 | insertion | Nonsense_Mutation | novel | c.1552_1553insATTATGAATGAGACTTTTGAATATGGTTCT | p.Ala518delinsAspTyrGluTerAspPheTerIleTrpPheSer | p.A518delinsDYE*DF*IWFS | Q9ULD2 | protein_coding | TCGA-BH-A0BM-01 | Breast | breast invasive carcinoma | Female | <65 | I/II | Chemotherapy | adriamycin | SD | ||
| MTUS1 | insertion | Frame_Shift_Ins | novel | c.1401_1402insCA | p.Lys468GlnfsTer6 | p.K468Qfs*6 | Q9ULD2 | protein_coding | TCGA-BH-A202-01 | Breast | breast invasive carcinoma | Female | <65 | I/II | Chemotherapy | carboplatin | CR |
| Page: 1 2 3 4 5 6 7 8 9 10 11 |
Top |
Related drugs of malignant transformation related genes |
| Identification of chemicals and drugs interact with genes involved in malignant transfromation |
| (DGIdb 4.0) |
| Entrez ID | Symbol | Category | Interaction Types | Drug Claim Name | Drug Name | PMIDs |
| Page: 1 |

Copyright 2023-Present -The University of Texas Health Science Center at Houston |