
|
|||||
|
 | |
| |
| |
| |
| |
| |
|
Gene: MTTP |
Gene summary for MTTP |
| Gene information | Species | Human | Gene symbol | MTTP | Gene ID | 4547 |
| Gene name | microsomal triglyceride transfer protein | |
| Gene Alias | ABL | |
| Cytomap | 4q23 | |
| Gene Type | protein-coding | GO ID | GO:0006464 | UniProtAcc | P55157 |
Top |
Malignant transformation analysis |
| Identification of the aberrant gene expression in precancerous and cancerous lesions by comparing the gene expression of stem-like cells in diseased tissues with normal stem cells |
| Entrez ID | Symbol | Replicates | Species | Organ | Tissue | Adj P-value | Log2FC | Malignancy |
| 4547 | MTTP | NAFLD1 | Human | Liver | NAFLD | 1.82e-09 | 7.44e-01 | -0.04 |
| 4547 | MTTP | S43 | Human | Liver | Cirrhotic | 4.33e-05 | -7.54e-02 | -0.0187 |
| 4547 | MTTP | HCC1_Meng | Human | Liver | HCC | 2.41e-83 | 4.58e-01 | 0.0246 |
| 4547 | MTTP | HCC2_Meng | Human | Liver | HCC | 1.07e-08 | -2.23e-01 | 0.0107 |
| 4547 | MTTP | cirrhotic1 | Human | Liver | Cirrhotic | 2.32e-08 | -2.21e-01 | 0.0202 |
| 4547 | MTTP | cirrhotic2 | Human | Liver | Cirrhotic | 1.90e-04 | -2.13e-01 | 0.0201 |
| 4547 | MTTP | cirrhotic3 | Human | Liver | Cirrhotic | 1.18e-02 | -2.20e-01 | 0.0215 |
| 4547 | MTTP | HCC1 | Human | Liver | HCC | 2.08e-05 | 3.49e+00 | 0.5336 |
| 4547 | MTTP | HCC2 | Human | Liver | HCC | 4.20e-45 | 5.89e+00 | 0.5341 |
| 4547 | MTTP | S014 | Human | Liver | HCC | 7.95e-20 | 1.36e+00 | 0.2254 |
| 4547 | MTTP | S015 | Human | Liver | HCC | 2.93e-24 | 2.09e+00 | 0.2375 |
| 4547 | MTTP | S016 | Human | Liver | HCC | 4.19e-23 | 1.30e+00 | 0.2243 |
| 4547 | MTTP | S027 | Human | Liver | HCC | 7.18e-03 | 5.84e-01 | 0.2446 |
| 4547 | MTTP | S028 | Human | Liver | HCC | 1.86e-20 | 1.19e+00 | 0.2503 |
| 4547 | MTTP | S029 | Human | Liver | HCC | 1.29e-19 | 1.27e+00 | 0.2581 |
| 4547 | MTTP | Pat01-B | Human | Stomach | GC | 7.96e-65 | 1.26e+00 | 0.5754 |
| 4547 | MTTP | Pat02-B | Human | Stomach | GC | 2.02e-07 | 2.49e-01 | 0.0368 |
| 4547 | MTTP | Pat03-B | Human | Stomach | GC | 3.76e-33 | 8.56e-01 | 0.3693 |
| 4547 | MTTP | Pat05-B | Human | Stomach | GC | 1.21e-02 | 2.41e-01 | -0.0353 |
| 4547 | MTTP | Pat17-B | Human | Stomach | GC | 1.39e-14 | 4.13e-01 | 0.3109 |
| Page: 1 2 |
| Tissue | Expression Dynamics | Abbreviation |
| GC | 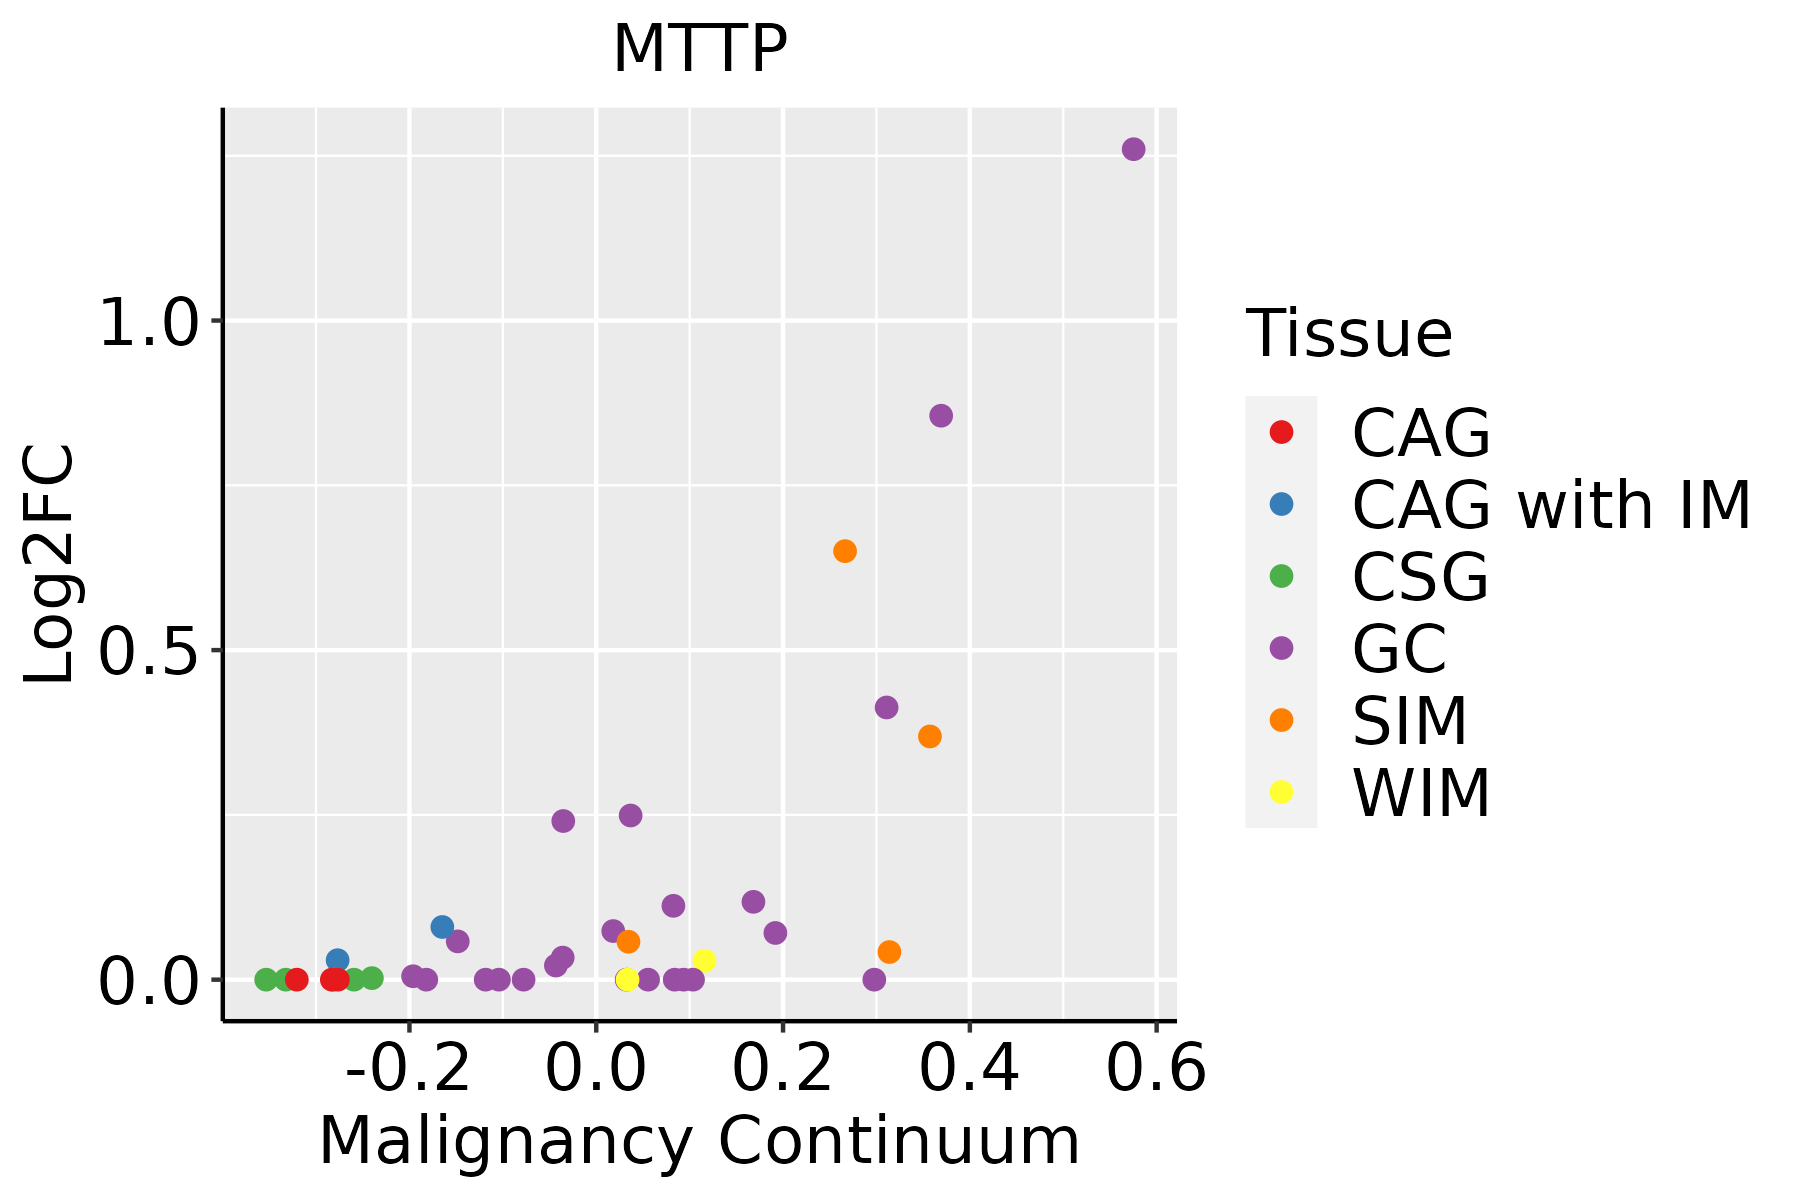 | CAG: Chronic atrophic gastritis |
| CAG with IM: Chronic atrophic gastritis with intestinal metaplasia | ||
| CSG: Chronic superficial gastritis | ||
| GC: Gastric cancer | ||
| SIM: Severe intestinal metaplasia | ||
| WIM: Wild intestinal metaplasia | ||
| Liver |  | HCC: Hepatocellular carcinoma |
| NAFLD: Non-alcoholic fatty liver disease |
| ∗log2FC in expression of this searched gene in stem-like cells from each diseased tissue sample relative to stem-like cells in normal samples in each tissue plotted against the malignancy continuum. Samples are colored based on if they are from different disease stage. |
Top |
Malignant transformation related pathway analysis |
| Find out the enriched GO biological processes and KEGG pathways involved in transition from healthy to precancer to cancer |
| Tissue | Disease Stage | Enriched GO biological Processes |
| Colorectum | AD |  |
| Colorectum | SER |  |
| Colorectum | MSS |  |
| Colorectum | MSI-H |  |
| Colorectum | FAP |  |
| ∗Top 15 enriched GO BP terms are showed in the bar plot of each disease state in each tissue. Each row represents a significant GO biological process which is colored according to the -log10(p.adjust). |
| Page: 1 2 3 4 5 6 7 8 9 |
| GO ID | Tissue | Disease Stage | Description | Gene Ratio | Bg Ratio | pvalue | p.adjust | Count |
| GO:00550883 | Liver | NAFLD | lipid homeostasis | 44/1882 | 167/18723 | 1.48e-09 | 2.54e-07 | 44 |
| GO:00066413 | Liver | NAFLD | triglyceride metabolic process | 29/1882 | 100/18723 | 9.51e-08 | 7.62e-06 | 29 |
| GO:00108765 | Liver | NAFLD | lipid localization | 79/1882 | 448/18723 | 4.75e-07 | 2.92e-05 | 79 |
| GO:00066392 | Liver | NAFLD | acylglycerol metabolic process | 32/1882 | 128/18723 | 8.82e-07 | 4.60e-05 | 32 |
| GO:00066382 | Liver | NAFLD | neutral lipid metabolic process | 32/1882 | 129/18723 | 1.06e-06 | 5.35e-05 | 32 |
| GO:00068694 | Liver | NAFLD | lipid transport | 71/1882 | 398/18723 | 1.16e-06 | 5.59e-05 | 71 |
| GO:00159183 | Liver | NAFLD | sterol transport | 32/1882 | 130/18723 | 1.27e-06 | 6.01e-05 | 32 |
| GO:00426323 | Liver | NAFLD | cholesterol homeostasis | 26/1882 | 96/18723 | 1.83e-06 | 7.86e-05 | 26 |
| GO:00550923 | Liver | NAFLD | sterol homeostasis | 26/1882 | 97/18723 | 2.26e-06 | 9.51e-05 | 26 |
| GO:00485115 | Liver | NAFLD | rhythmic process | 56/1882 | 298/18723 | 3.03e-06 | 1.23e-04 | 56 |
| GO:00718252 | Liver | NAFLD | protein-lipid complex subunit organization | 17/1882 | 50/18723 | 3.92e-06 | 1.54e-04 | 17 |
| GO:00718272 | Liver | NAFLD | plasma lipoprotein particle organization | 16/1882 | 46/18723 | 5.37e-06 | 1.95e-04 | 16 |
| GO:00076236 | Liver | NAFLD | circadian rhythm | 42/1882 | 210/18723 | 1.06e-05 | 3.34e-04 | 42 |
| GO:00343682 | Liver | NAFLD | protein-lipid complex remodeling | 12/1882 | 30/18723 | 1.58e-05 | 4.56e-04 | 12 |
| GO:00343692 | Liver | NAFLD | plasma lipoprotein particle remodeling | 12/1882 | 30/18723 | 1.58e-05 | 4.56e-04 | 12 |
| GO:00464863 | Liver | NAFLD | glycerolipid metabolic process | 66/1882 | 392/18723 | 1.94e-05 | 5.52e-04 | 66 |
| GO:00343672 | Liver | NAFLD | protein-containing complex remodeling | 12/1882 | 32/18723 | 3.40e-05 | 8.80e-04 | 12 |
| GO:00100387 | Liver | NAFLD | response to metal ion | 62/1882 | 373/18723 | 5.05e-05 | 1.19e-03 | 62 |
| GO:0015850 | Liver | NAFLD | organic hydroxy compound transport | 50/1882 | 284/18723 | 6.01e-05 | 1.32e-03 | 50 |
| GO:00650052 | Liver | NAFLD | protein-lipid complex assembly | 11/1882 | 31/18723 | 1.29e-04 | 2.47e-03 | 11 |
| Page: 1 2 3 4 5 6 |
| Pathway ID | Tissue | Disease Stage | Description | Gene Ratio | Bg Ratio | pvalue | p.adjust | qvalue | Count |
| hsa04975 | Stomach | GC | Fat digestion and absorption | 14/708 | 43/8465 | 5.71e-06 | 8.30e-05 | 5.84e-05 | 14 |
| hsa049751 | Stomach | GC | Fat digestion and absorption | 14/708 | 43/8465 | 5.71e-06 | 8.30e-05 | 5.84e-05 | 14 |
| hsa049752 | Stomach | SIM | Fat digestion and absorption | 12/465 | 43/8465 | 2.11e-06 | 3.05e-05 | 2.45e-05 | 12 |
| hsa049753 | Stomach | SIM | Fat digestion and absorption | 12/465 | 43/8465 | 2.11e-06 | 3.05e-05 | 2.45e-05 | 12 |
| Page: 1 |
Top |
Cell-cell communication analysis |
| Identification of potential cell-cell interactions between two cell types and their ligand-receptor pairs for different disease states |
| Ligand | Receptor | LRpair | Pathway | Tissue | Disease Stage |
| Page: 1 |
Top |
Single-cell gene regulatory network inference analysis |
| Find out the significant the regulons (TFs) and the target genes of each regulon across cell types for different disease states |
| TF | Cell Type | Tissue | Disease Stage | Target Gene | RSS | Regulon Activity |
| ∗The dot plots of a searched regulon are shown for all cell subpopulations in each disease state of each tissue based on the regulon specific score inferred using pySCENIC and by calculating the average expression. |
| Page: 1 |
Top |
Somatic mutation of malignant transformation related genes |
| Annotation of somatic variants for genes involved in malignant transformation |
| Hugo Symbol | Variant Class | Variant Classification | dbSNP RS | HGVSc | HGVSp | HGVSp Short | SWISSPROT | BIOTYPE | SIFT | PolyPhen | Tumor Sample Barcode | Tissue | Histology | Sex | Age | Stage | Therapy Types | Drugs | Outcome |
| MTTP | SNV | Missense_Mutation | novel | c.1261C>A | p.Leu421Ile | p.L421I | protein_coding | deleterious(0) | probably_damaging(1) | TCGA-AN-A046-01 | Breast | breast invasive carcinoma | Female | >=65 | I/II | Unknown | Unknown | SD | |
| MTTP | SNV | Missense_Mutation | c.2288N>G | p.Asp763Gly | p.D763G | protein_coding | deleterious(0) | probably_damaging(0.992) | TCGA-AR-A1AO-01 | Breast | breast invasive carcinoma | Female | <65 | I/II | Chemotherapy | doxorubicin | SD | ||
| MTTP | SNV | Missense_Mutation | c.2680G>A | p.Glu894Lys | p.E894K | protein_coding | deleterious(0) | possibly_damaging(0.777) | TCGA-B6-A0WZ-01 | Breast | breast invasive carcinoma | Female | <65 | I/II | Unknown | Unknown | PD | ||
| MTTP | SNV | Missense_Mutation | c.2119N>A | p.Asp707Asn | p.D707N | protein_coding | tolerated(0.06) | probably_damaging(0.988) | TCGA-C8-A12T-01 | Breast | breast invasive carcinoma | Female | <65 | I/II | Unknown | Unknown | SD | ||
| MTTP | SNV | Missense_Mutation | c.1933N>G | p.Thr645Ala | p.T645A | protein_coding | tolerated(0.08) | benign(0.182) | TCGA-C8-A26W-01 | Breast | breast invasive carcinoma | Female | <65 | I/II | Chemotherapy | doxorubicin | CR | ||
| MTTP | SNV | Missense_Mutation | novel | c.1994N>T | p.Ser665Leu | p.S665L | protein_coding | tolerated(0.62) | possibly_damaging(0.907) | TCGA-S3-A6ZG-01 | Breast | breast invasive carcinoma | Female | >=65 | I/II | Chemotherapy | doxorubicin | CR | |
| MTTP | insertion | Nonsense_Mutation | novel | c.1366_1367insATAGGGATAATAATTCTTTCTATTTATTGTAGGCTAG | p.Met456AsnfsTer11 | p.M456Nfs*11 | protein_coding | TCGA-A8-A09B-01 | Breast | breast invasive carcinoma | Female | <65 | III/IV | Chemotherapy | 5-fluorouracil | SD | |||
| MTTP | insertion | Nonsense_Mutation | novel | c.1127_1128insTTTATTCCTAGGAGAACACCCTTTGTAAATGTG | p.Lys376delinsAsnLeuPheLeuGlyGluHisProLeuTerMetTrp | p.K376delinsNLFLGEHPL*MW | protein_coding | TCGA-B6-A0RE-01 | Breast | breast invasive carcinoma | Female | <65 | I/II | Unknown | Unknown | SD | |||
| MTTP | insertion | In_Frame_Ins | novel | c.1637_1638insAGACACAGGAAAGATGGGAAAAGAGAT | p.Glu546_Val547insAspThrGlyLysMetGlyLysGluMet | p.E546_V547insDTGKMGKEM | protein_coding | TCGA-BH-A0GZ-01 | Breast | breast invasive carcinoma | Female | <65 | I/II | Hormone Therapy | arimidex | SD | |||
| MTTP | SNV | Missense_Mutation | novel | c.2008N>G | p.Leu670Val | p.L670V | protein_coding | deleterious(0.01) | possibly_damaging(0.555) | TCGA-C5-A2LZ-01 | Cervix | cervical & endocervical cancer | Female | >=65 | III/IV | Unknown | Unknown | PD |
| Page: 1 2 3 4 5 6 7 8 9 10 11 |
Top |
Related drugs of malignant transformation related genes |
| Identification of chemicals and drugs interact with genes involved in malignant transfromation |
| (DGIdb 4.0) |
| Entrez ID | Symbol | Category | Interaction Types | Drug Claim Name | Drug Name | PMIDs |
| 4547 | MTTP | DRUGGABLE GENOME | BMS-201038 | LOMITAPIDE MESYLATE | ||
| 4547 | MTTP | DRUGGABLE GENOME | LOMITAPIDE | LOMITAPIDE | ||
| 4547 | MTTP | DRUGGABLE GENOME | Granotapide | GRANOTAPIDE | ||
| 4547 | MTTP | DRUGGABLE GENOME | JNJ-16269110 | USISTAPIDE | ||
| 4547 | MTTP | DRUGGABLE GENOME | SLx-4090 | SLX-4090 | ||
| 4547 | MTTP | DRUGGABLE GENOME | pravastatin | PRAVASTATIN | 15136504 | |
| 4547 | MTTP | DRUGGABLE GENOME | Implitapide | IMPLITAPIDE | ||
| 4547 | MTTP | DRUGGABLE GENOME | IMPLITAPIDE | IMPLITAPIDE | ||
| 4547 | MTTP | DRUGGABLE GENOME | KD020 | |||
| 4547 | MTTP | DRUGGABLE GENOME | inhibitor | CHEMBL2105662 | LOMITAPIDE MESYLATE |
| Page: 1 2 |

Copyright 2023-Present -The University of Texas Health Science Center at Houston |