
|
|||||
|
 | |
| |
| |
| |
| |
| |
|
Gene: MTRR |
Gene summary for MTRR |
| Gene information | Species | Human | Gene symbol | MTRR | Gene ID | 4552 |
| Gene name | 5-methyltetrahydrofolate-homocysteine methyltransferase reductase | |
| Gene Alias | MSR | |
| Cytomap | 5p15.31 | |
| Gene Type | protein-coding | GO ID | GO:0000096 | UniProtAcc | Q9UBK8 |
Top |
Malignant transformation analysis |
| Identification of the aberrant gene expression in precancerous and cancerous lesions by comparing the gene expression of stem-like cells in diseased tissues with normal stem cells |
| Entrez ID | Symbol | Replicates | Species | Organ | Tissue | Adj P-value | Log2FC | Malignancy |
| 4552 | MTRR | LZE4T | Human | Esophagus | ESCC | 2.02e-03 | 1.26e-01 | 0.0811 |
| 4552 | MTRR | LZE7T | Human | Esophagus | ESCC | 3.66e-09 | 1.90e-01 | 0.0667 |
| 4552 | MTRR | LZE8T | Human | Esophagus | ESCC | 1.74e-03 | 1.13e-01 | 0.067 |
| 4552 | MTRR | LZE24T | Human | Esophagus | ESCC | 1.36e-10 | 1.76e-01 | 0.0596 |
| 4552 | MTRR | LZE6T | Human | Esophagus | ESCC | 2.63e-03 | 2.34e-01 | 0.0845 |
| 4552 | MTRR | P1T-E | Human | Esophagus | ESCC | 2.26e-05 | 1.64e-01 | 0.0875 |
| 4552 | MTRR | P2T-E | Human | Esophagus | ESCC | 1.12e-21 | 2.04e-01 | 0.1177 |
| 4552 | MTRR | P4T-E | Human | Esophagus | ESCC | 2.21e-08 | 1.78e-01 | 0.1323 |
| 4552 | MTRR | P5T-E | Human | Esophagus | ESCC | 1.49e-11 | 2.52e-01 | 0.1327 |
| 4552 | MTRR | P8T-E | Human | Esophagus | ESCC | 5.17e-15 | 1.99e-01 | 0.0889 |
| 4552 | MTRR | P9T-E | Human | Esophagus | ESCC | 7.69e-05 | 6.56e-02 | 0.1131 |
| 4552 | MTRR | P10T-E | Human | Esophagus | ESCC | 3.63e-18 | 3.23e-01 | 0.116 |
| 4552 | MTRR | P11T-E | Human | Esophagus | ESCC | 7.59e-11 | 3.51e-01 | 0.1426 |
| 4552 | MTRR | P12T-E | Human | Esophagus | ESCC | 3.42e-12 | 1.95e-01 | 0.1122 |
| 4552 | MTRR | P15T-E | Human | Esophagus | ESCC | 1.11e-12 | 8.68e-02 | 0.1149 |
| 4552 | MTRR | P16T-E | Human | Esophagus | ESCC | 1.47e-08 | 1.42e-01 | 0.1153 |
| 4552 | MTRR | P17T-E | Human | Esophagus | ESCC | 5.26e-03 | 2.23e-01 | 0.1278 |
| 4552 | MTRR | P19T-E | Human | Esophagus | ESCC | 5.03e-03 | 2.99e-01 | 0.1662 |
| 4552 | MTRR | P20T-E | Human | Esophagus | ESCC | 9.02e-19 | 2.59e-01 | 0.1124 |
| 4552 | MTRR | P21T-E | Human | Esophagus | ESCC | 1.21e-16 | 2.27e-01 | 0.1617 |
| Page: 1 2 3 4 |
| Tissue | Expression Dynamics | Abbreviation |
| Esophagus |  | ESCC: Esophageal squamous cell carcinoma |
| HGIN: High-grade intraepithelial neoplasias | ||
| LGIN: Low-grade intraepithelial neoplasias | ||
| Liver | 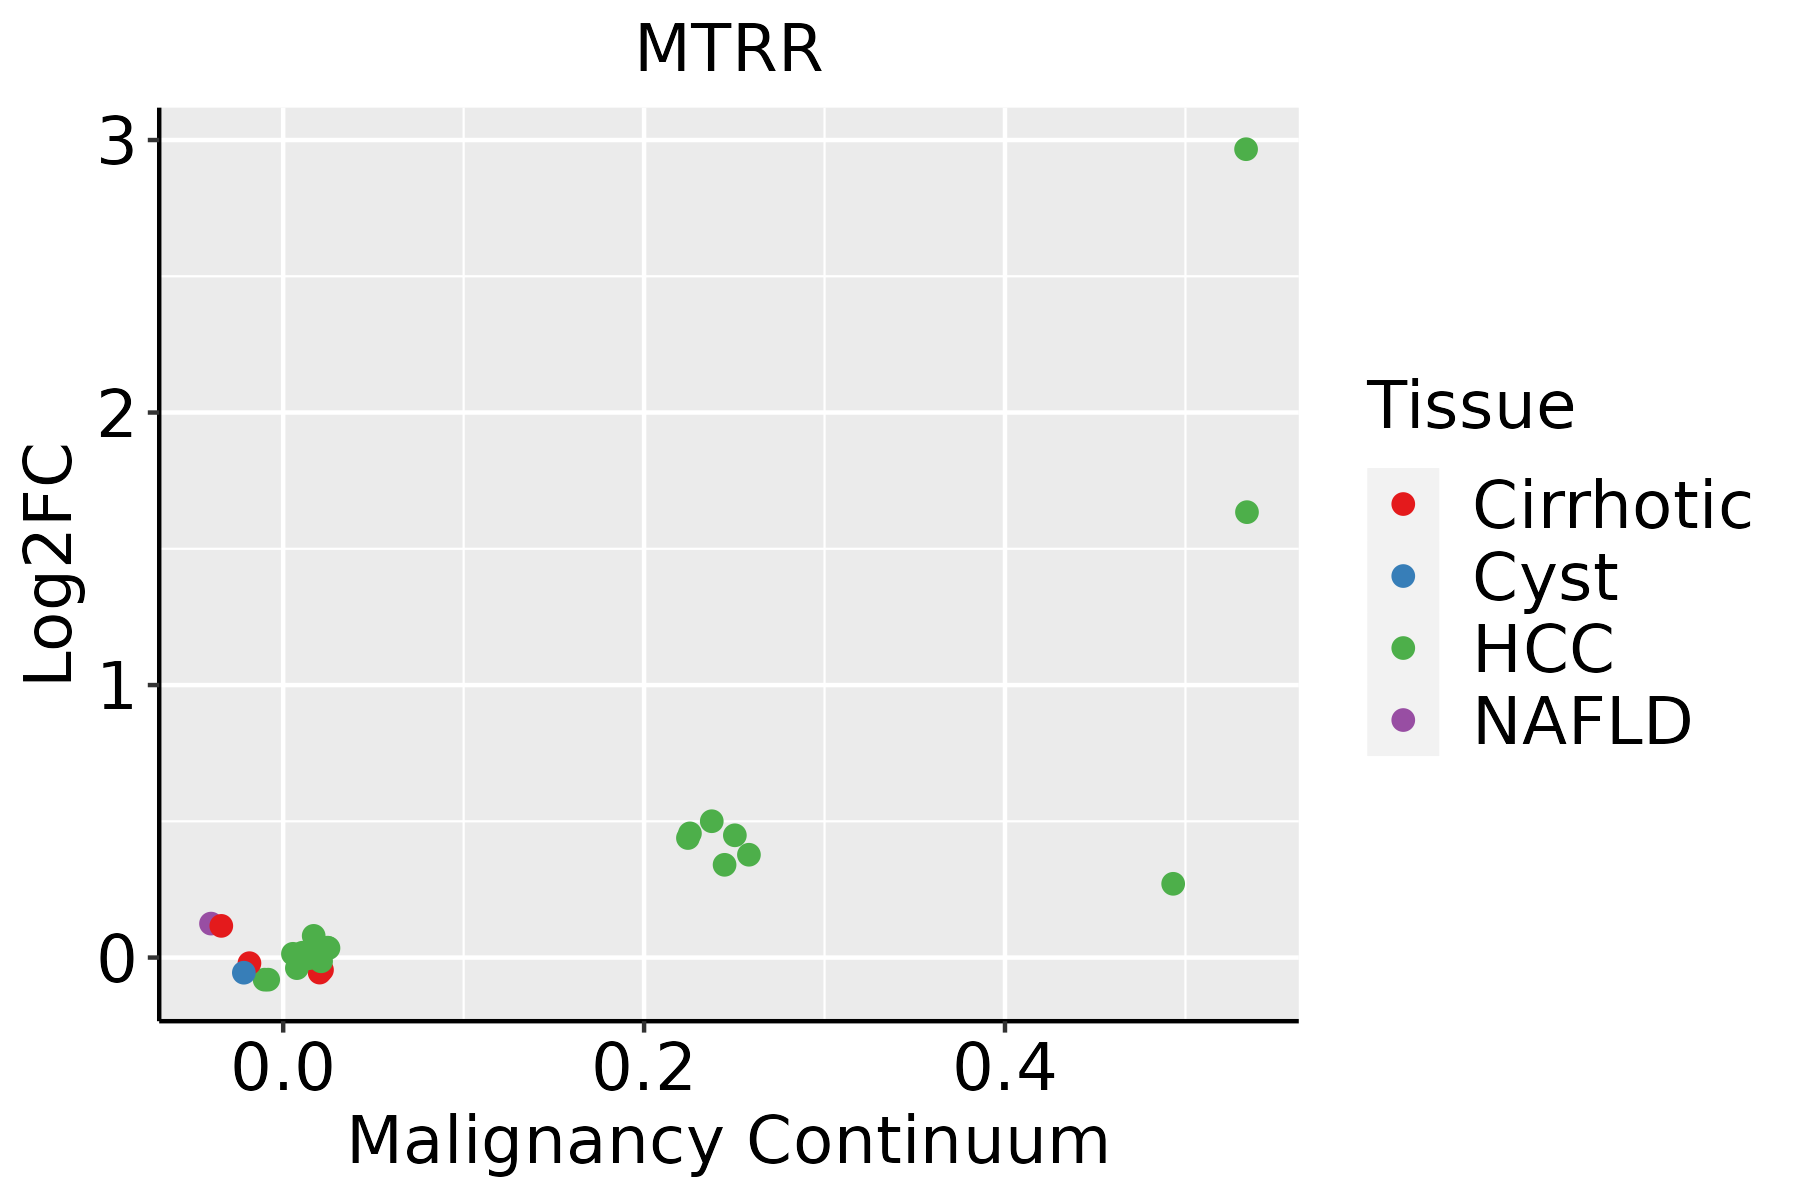 | HCC: Hepatocellular carcinoma |
| NAFLD: Non-alcoholic fatty liver disease |
| ∗log2FC in expression of this searched gene in stem-like cells from each diseased tissue sample relative to stem-like cells in normal samples in each tissue plotted against the malignancy continuum. Samples are colored based on if they are from different disease stage. |
Top |
Malignant transformation related pathway analysis |
| Find out the enriched GO biological processes and KEGG pathways involved in transition from healthy to precancer to cancer |
| Tissue | Disease Stage | Enriched GO biological Processes |
| Colorectum | AD |  |
| Colorectum | SER |  |
| Colorectum | MSS |  |
| Colorectum | MSI-H |  |
| Colorectum | FAP |  |
| ∗Top 15 enriched GO BP terms are showed in the bar plot of each disease state in each tissue. Each row represents a significant GO biological process which is colored according to the -log10(p.adjust). |
| Page: 1 2 3 4 5 6 7 8 9 |
| GO ID | Tissue | Disease Stage | Description | Gene Ratio | Bg Ratio | pvalue | p.adjust | Count |
| GO:00434143 | Esophagus | ESCC | macromolecule methylation | 199/8552 | 316/18723 | 3.44e-10 | 9.57e-09 | 199 |
| GO:00322592 | Esophagus | ESCC | methylation | 222/8552 | 364/18723 | 2.26e-09 | 5.09e-08 | 222 |
| GO:00067906 | Esophagus | ESCC | sulfur compound metabolic process | 201/8552 | 339/18723 | 2.64e-07 | 3.94e-06 | 201 |
| GO:00442725 | Esophagus | ESCC | sulfur compound biosynthetic process | 96/8552 | 148/18723 | 1.86e-06 | 2.16e-05 | 96 |
| GO:00065757 | Esophagus | ESCC | cellular modified amino acid metabolic process | 112/8552 | 188/18723 | 8.31e-05 | 6.06e-04 | 112 |
| GO:00086525 | Esophagus | ESCC | cellular amino acid biosynthetic process | 51/8552 | 76/18723 | 1.30e-04 | 8.88e-04 | 51 |
| GO:00067671 | Esophagus | ESCC | water-soluble vitamin metabolic process | 41/8552 | 59/18723 | 1.84e-04 | 1.17e-03 | 41 |
| GO:00463948 | Esophagus | ESCC | carboxylic acid biosynthetic process | 175/8552 | 314/18723 | 1.98e-04 | 1.26e-03 | 175 |
| GO:00067661 | Esophagus | ESCC | vitamin metabolic process | 67/8552 | 106/18723 | 2.03e-04 | 1.28e-03 | 67 |
| GO:00160538 | Esophagus | ESCC | organic acid biosynthetic process | 175/8552 | 316/18723 | 3.04e-04 | 1.82e-03 | 175 |
| GO:00425584 | Esophagus | ESCC | pteridine-containing compound metabolic process | 25/8552 | 33/18723 | 4.30e-04 | 2.43e-03 | 25 |
| GO:19016075 | Esophagus | ESCC | alpha-amino acid biosynthetic process | 45/8552 | 68/18723 | 5.13e-04 | 2.84e-03 | 45 |
| GO:00090674 | Esophagus | ESCC | aspartate family amino acid biosynthetic process | 17/8552 | 21/18723 | 1.03e-03 | 5.19e-03 | 17 |
| GO:00442827 | Esophagus | ESCC | small molecule catabolic process | 201/8552 | 376/18723 | 1.35e-03 | 6.41e-03 | 201 |
| GO:00436485 | Esophagus | ESCC | dicarboxylic acid metabolic process | 58/8552 | 96/18723 | 2.55e-03 | 1.09e-02 | 58 |
| GO:00067602 | Esophagus | ESCC | folic acid-containing compound metabolic process | 19/8552 | 26/18723 | 4.31e-03 | 1.71e-02 | 19 |
| GO:00090862 | Esophagus | ESCC | methionine biosynthetic process | 10/8552 | 12/18723 | 8.94e-03 | 3.12e-02 | 10 |
| GO:0006304 | Esophagus | ESCC | DNA modification | 68/8552 | 120/18723 | 9.95e-03 | 3.42e-02 | 68 |
| GO:00466551 | Esophagus | ESCC | folic acid metabolic process | 11/8552 | 14/18723 | 1.30e-02 | 4.27e-02 | 11 |
| GO:001605321 | Liver | HCC | organic acid biosynthetic process | 200/7958 | 316/18723 | 5.24e-14 | 3.22e-12 | 200 |
| Page: 1 2 3 |
| Pathway ID | Tissue | Disease Stage | Description | Gene Ratio | Bg Ratio | pvalue | p.adjust | qvalue | Count |
| Page: 1 |
Top |
Cell-cell communication analysis |
| Identification of potential cell-cell interactions between two cell types and their ligand-receptor pairs for different disease states |
| Ligand | Receptor | LRpair | Pathway | Tissue | Disease Stage |
| Page: 1 |
Top |
Single-cell gene regulatory network inference analysis |
| Find out the significant the regulons (TFs) and the target genes of each regulon across cell types for different disease states |
| TF | Cell Type | Tissue | Disease Stage | Target Gene | RSS | Regulon Activity |
| ∗The dot plots of a searched regulon are shown for all cell subpopulations in each disease state of each tissue based on the regulon specific score inferred using pySCENIC and by calculating the average expression. |
| Page: 1 |
Top |
Somatic mutation of malignant transformation related genes |
| Annotation of somatic variants for genes involved in malignant transformation |
| Hugo Symbol | Variant Class | Variant Classification | dbSNP RS | HGVSc | HGVSp | HGVSp Short | SWISSPROT | BIOTYPE | SIFT | PolyPhen | Tumor Sample Barcode | Tissue | Histology | Sex | Age | Stage | Therapy Types | Drugs | Outcome |
| MTRR | SNV | Missense_Mutation | rs201557658 | c.773N>T | p.Ser258Leu | p.S258L | Q9UBK8 | protein_coding | deleterious(0) | possibly_damaging(0.827) | TCGA-A7-A0CG-01 | Breast | breast invasive carcinoma | Female | >=65 | I/II | Unknown | Unknown | SD |
| MTRR | SNV | Missense_Mutation | rs779803224 | c.571N>C | p.Ser191Arg | p.S191R | Q9UBK8 | protein_coding | tolerated(0.27) | benign(0.054) | TCGA-AO-A1KS-01 | Breast | breast invasive carcinoma | Female | >=65 | I/II | Hormone Therapy | arimidex | SD |
| MTRR | SNV | Missense_Mutation | c.1282N>G | p.Leu428Val | p.L428V | Q9UBK8 | protein_coding | deleterious(0) | probably_damaging(1) | TCGA-E2-A14Y-01 | Breast | breast invasive carcinoma | Female | <65 | I/II | Chemotherapy | carboplatin | SD | |
| MTRR | insertion | Frame_Shift_Ins | novel | c.2001_2002insGCAGCCCCTCAATTTCTTTTTAAGGTGCCTGA | p.Leu668AlafsTer38 | p.L668Afs*38 | Q9UBK8 | protein_coding | TCGA-A8-A079-01 | Breast | breast invasive carcinoma | Female | >=65 | III/IV | Chemotherapy | 5-fluorouracil | SD | ||
| MTRR | deletion | Frame_Shift_Del | novel | c.447delN | p.Phe150SerfsTer11 | p.F150Sfs*11 | Q9UBK8 | protein_coding | TCGA-D8-A27V-01 | Breast | breast invasive carcinoma | Female | <65 | I/II | Hormone Therapy | tamoxiphen | SD | ||
| MTRR | SNV | Missense_Mutation | novel | c.540T>G | p.His180Gln | p.H180Q | Q9UBK8 | protein_coding | tolerated(0.57) | benign(0) | TCGA-2W-A8YY-01 | Cervix | cervical & endocervical cancer | Female | <65 | I/II | Chemotherapy | cisplatin | CR |
| MTRR | SNV | Missense_Mutation | novel | c.1339G>A | p.Ala447Thr | p.A447T | Q9UBK8 | protein_coding | tolerated(0.2) | benign(0.272) | TCGA-2W-A8YY-01 | Cervix | cervical & endocervical cancer | Female | <65 | I/II | Chemotherapy | cisplatin | CR |
| MTRR | SNV | Missense_Mutation | c.1978N>T | p.Gly660Cys | p.G660C | Q9UBK8 | protein_coding | tolerated(0.16) | probably_damaging(0.909) | TCGA-DS-A1OC-01 | Cervix | cervical & endocervical cancer | Female | <65 | I/II | Chemotherapy | gemcitabine | SD | |
| MTRR | SNV | Missense_Mutation | c.76N>A | p.Glu26Lys | p.E26K | Q9UBK8 | protein_coding | deleterious(0.04) | benign(0.005) | TCGA-EK-A2RO-01 | Cervix | cervical & endocervical cancer | Female | <65 | I/II | Unknown | Unknown | SD | |
| MTRR | SNV | Missense_Mutation | novel | c.1331N>C | p.Val444Ala | p.V444A | Q9UBK8 | protein_coding | deleterious(0) | possibly_damaging(0.674) | TCGA-AA-3947-01 | Colorectum | colon adenocarcinoma | Female | <65 | I/II | Unknown | Unknown | SD |
| Page: 1 2 3 4 5 6 7 8 9 10 |
Top |
Related drugs of malignant transformation related genes |
| Identification of chemicals and drugs interact with genes involved in malignant transfromation |
| (DGIdb 4.0) |
| Entrez ID | Symbol | Category | Interaction Types | Drug Claim Name | Drug Name | PMIDs |
| 4552 | MTRR | ENZYME, CLINICALLY ACTIONABLE, DRUGGABLE GENOME | folic acid | 22926161 | ||
| 4552 | MTRR | ENZYME, CLINICALLY ACTIONABLE, DRUGGABLE GENOME | VITAMIN B12 | 12807760 | ||
| 4552 | MTRR | ENZYME, CLINICALLY ACTIONABLE, DRUGGABLE GENOME | methotrexate | METHOTREXATE | 16013960,29743634,15797993,18368069 | |
| 4552 | MTRR | ENZYME, CLINICALLY ACTIONABLE, DRUGGABLE GENOME | vitamin b-complex, plain | 22926161 |
| Page: 1 |

Copyright 2023-Present -The University of Texas Health Science Center at Houston |