
|
|||||
|
 | |
| |
| |
| |
| |
| |
|
Gene: MTRNR2L10 |
Gene summary for MTRNR2L10 |
| Gene information | Species | Human | Gene symbol | MTRNR2L10 | Gene ID | 100463488 |
| Gene name | MT-RNR2 like 10 | |
| Gene Alias | HN10 | |
| Cytomap | Xp11.21 | |
| Gene Type | protein-coding | GO ID | GO:0006915 | UniProtAcc | P0CJ77 |
Top |
Malignant transformation analysis |
| Identification of the aberrant gene expression in precancerous and cancerous lesions by comparing the gene expression of stem-like cells in diseased tissues with normal stem cells |
| Entrez ID | Symbol | Replicates | Species | Organ | Tissue | Adj P-value | Log2FC | Malignancy |
| 100463488 | MTRNR2L10 | HTA11_2487_2000001011 | Human | Colorectum | SER | 3.87e-02 | 1.03e-01 | -0.1808 |
| 100463488 | MTRNR2L10 | HTA11_347_2000001011 | Human | Colorectum | AD | 4.14e-03 | 1.00e-01 | -0.1954 |
| 100463488 | MTRNR2L10 | HTA11_696_2000001011 | Human | Colorectum | AD | 1.07e-04 | 1.59e-01 | -0.1464 |
| 100463488 | MTRNR2L10 | HTA11_1391_2000001011 | Human | Colorectum | AD | 3.67e-03 | 1.33e-01 | -0.059 |
| 100463488 | MTRNR2L10 | HTA11_2992_2000001011 | Human | Colorectum | SER | 1.94e-06 | 2.83e-01 | -0.1706 |
| 100463488 | MTRNR2L10 | HTA11_5212_2000001011 | Human | Colorectum | AD | 1.00e-07 | 3.99e-01 | -0.2061 |
| 100463488 | MTRNR2L10 | HTA11_5216_2000001011 | Human | Colorectum | SER | 3.22e-05 | 3.05e-01 | -0.1462 |
| 100463488 | MTRNR2L10 | HTA11_99999965104_69814 | Human | Colorectum | MSS | 1.92e-55 | 1.33e+00 | 0.281 |
| 100463488 | MTRNR2L10 | GSM5252127_BPH283PrSF_Via | Human | Prostate | BPH | 1.48e-04 | 5.76e-01 | -0.1453 |
| 100463488 | MTRNR2L10 | GSM5252130_BPH340PrGF_Via | Human | Prostate | BPH | 5.20e-10 | 6.44e-01 | -0.1972 |
| 100463488 | MTRNR2L10 | GSM5252131_BPH340PrSF_Via | Human | Prostate | BPH | 1.03e-27 | 8.81e-01 | -0.2126 |
| 100463488 | MTRNR2L10 | GSM5252132_BPH389PrGF | Human | Prostate | BPH | 3.29e-39 | 2.91e+00 | -0.2247 |
| 100463488 | MTRNR2L10 | GSM5252133_BPH389PrSF | Human | Prostate | BPH | 3.75e-19 | 1.72e+00 | -0.2027 |
| 100463488 | MTRNR2L10 | GSM5252134_BPH511PrG_Fcol_3GEX | Human | Prostate | BPH | 3.18e-51 | -8.00e-01 | -0.1433 |
| 100463488 | MTRNR2L10 | GSM5252135_BPH511PrPUr_Fcol_3GEX | Human | Prostate | BPH | 1.07e-51 | -8.01e-01 | -0.1833 |
| 100463488 | MTRNR2L10 | GSM5252136_BPH556PrGA1_Fcol | Human | Prostate | BPH | 3.18e-51 | -8.00e-01 | -0.23 |
| 100463488 | MTRNR2L10 | GSM5252137_BPH556PrGA2_Fcol | Human | Prostate | BPH | 1.21e-52 | -8.01e-01 | -0.23 |
| 100463488 | MTRNR2L10 | 047563_1562-all-cells | Human | Prostate | BPH | 3.61e-52 | -8.01e-01 | 0.0791 |
| 100463488 | MTRNR2L10 | 048752_1579-all-cells | Human | Prostate | BPH | 2.75e-50 | -8.00e-01 | 0.1008 |
| 100463488 | MTRNR2L10 | 052095_1628-all-cells | Human | Prostate | BPH | 1.07e-51 | -7.99e-01 | 0.1032 |
| Page: 1 2 3 |
| Tissue | Expression Dynamics | Abbreviation |
| Colorectum (GSE201348) |  | FAP: Familial adenomatous polyposis |
| CRC: Colorectal cancer | ||
| Colorectum (HTA11) |  | AD: Adenomas |
| SER: Sessile serrated lesions | ||
| MSI-H: Microsatellite-high colorectal cancer | ||
| MSS: Microsatellite stable colorectal cancer | ||
| Prostate | 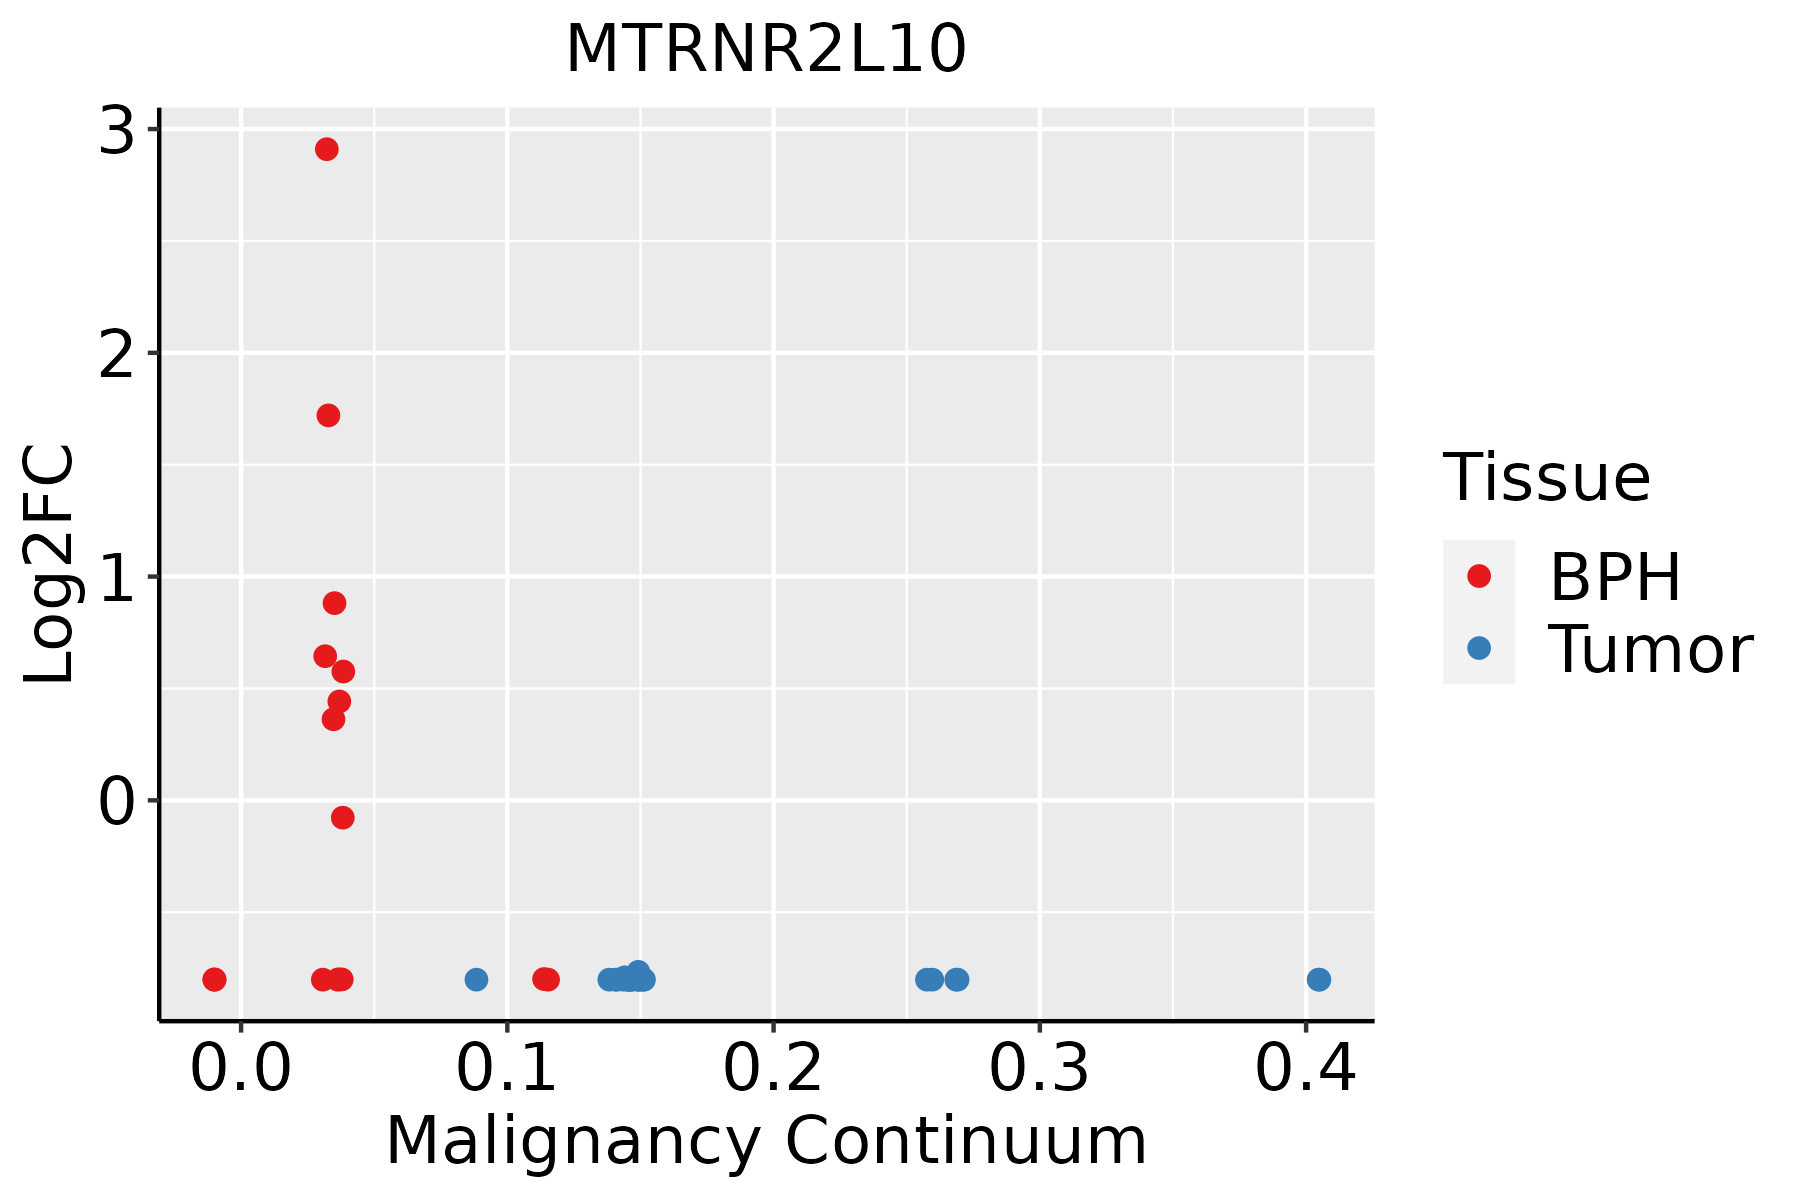 | BPH: Benign Prostatic Hyperplasia |
| ∗log2FC in expression of this searched gene in stem-like cells from each diseased tissue sample relative to stem-like cells in normal samples in each tissue plotted against the malignancy continuum. Samples are colored based on if they are from different disease stage. |
Top |
Malignant transformation related pathway analysis |
| Find out the enriched GO biological processes and KEGG pathways involved in transition from healthy to precancer to cancer |
| Tissue | Disease Stage | Enriched GO biological Processes |
| Colorectum | AD |  |
| Colorectum | SER |  |
| Colorectum | MSS |  |
| Colorectum | MSI-H |  |
| Colorectum | FAP |  |
| ∗Top 15 enriched GO BP terms are showed in the bar plot of each disease state in each tissue. Each row represents a significant GO biological process which is colored according to the -log10(p.adjust). |
| Page: 1 2 3 4 5 6 7 8 9 |
| GO ID | Tissue | Disease Stage | Description | Gene Ratio | Bg Ratio | pvalue | p.adjust | Count |
| Page: 1 |
| Pathway ID | Tissue | Disease Stage | Description | Gene Ratio | Bg Ratio | pvalue | p.adjust | qvalue | Count |
| Page: 1 |
Top |
Cell-cell communication analysis |
| Identification of potential cell-cell interactions between two cell types and their ligand-receptor pairs for different disease states |
| Ligand | Receptor | LRpair | Pathway | Tissue | Disease Stage |
| Page: 1 |
Top |
Single-cell gene regulatory network inference analysis |
| Find out the significant the regulons (TFs) and the target genes of each regulon across cell types for different disease states |
| TF | Cell Type | Tissue | Disease Stage | Target Gene | RSS | Regulon Activity |
| ∗The dot plots of a searched regulon are shown for all cell subpopulations in each disease state of each tissue based on the regulon specific score inferred using pySCENIC and by calculating the average expression. |
| Page: 1 |
Top |
Somatic mutation of malignant transformation related genes |
| Annotation of somatic variants for genes involved in malignant transformation |
| Hugo Symbol | Variant Class | Variant Classification | dbSNP RS | HGVSc | HGVSp | HGVSp Short | SWISSPROT | BIOTYPE | SIFT | PolyPhen | Tumor Sample Barcode | Tissue | Histology | Sex | Age | Stage | Therapy Types | Drugs | Outcome |
| MTRNR2L10 | SNV | Missense_Mutation | rs189821139 | c.58N>A | p.Ala20Thr | p.A20T | P0CJ77 | protein_coding | benign(0) | TCGA-A5-A2K3-01 | Endometrium | uterine corpus endometrioid carcinoma | Female | >=65 | I/II | Chemotherapy | carboplatin | SD | |
| MTRNR2L10 | SNV | Missense_Mutation | rs774382614 | c.11N>A | p.Arg4Gln | p.R4Q | P0CJ77 | protein_coding | benign(0) | TCGA-AJ-A5DW-01 | Endometrium | uterine corpus endometrioid carcinoma | Female | <65 | I/II | Unknown | Unknown | SD | |
| MTRNR2L10 | SNV | Missense_Mutation | rs757312501 | c.68G>A | p.Arg23Gln | p.R23Q | P0CJ77 | protein_coding | benign(0.412) | TCGA-EO-A22T-01 | Endometrium | uterine corpus endometrioid carcinoma | Female | <65 | I/II | Unknown | Unknown | SD |
| Page: 1 |
Top |
Related drugs of malignant transformation related genes |
| Identification of chemicals and drugs interact with genes involved in malignant transfromation |
| (DGIdb 4.0) |
| Entrez ID | Symbol | Category | Interaction Types | Drug Claim Name | Drug Name | PMIDs |
| Page: 1 |

Copyright 2023-Present -The University of Texas Health Science Center at Houston |