
|
|||||
|
 | |
| |
| |
| |
| |
| |
|
Gene: MTRF1L |
Gene summary for MTRF1L |
| Gene information | Species | Human | Gene symbol | MTRF1L | Gene ID | 54516 |
| Gene name | mitochondrial translation release factor 1 like | |
| Gene Alias | HMRF1L | |
| Cytomap | 6q25.2 | |
| Gene Type | protein-coding | GO ID | GO:0006412 | UniProtAcc | Q9UGC7 |
Top |
Malignant transformation analysis |
| Identification of the aberrant gene expression in precancerous and cancerous lesions by comparing the gene expression of stem-like cells in diseased tissues with normal stem cells |
| Entrez ID | Symbol | Replicates | Species | Organ | Tissue | Adj P-value | Log2FC | Malignancy |
| 54516 | MTRF1L | LZE4T | Human | Esophagus | ESCC | 1.69e-09 | 2.74e-01 | 0.0811 |
| 54516 | MTRF1L | LZE24T | Human | Esophagus | ESCC | 5.77e-10 | 2.65e-01 | 0.0596 |
| 54516 | MTRF1L | P1T-E | Human | Esophagus | ESCC | 4.53e-06 | 2.95e-01 | 0.0875 |
| 54516 | MTRF1L | P2T-E | Human | Esophagus | ESCC | 1.27e-07 | 2.05e-01 | 0.1177 |
| 54516 | MTRF1L | P4T-E | Human | Esophagus | ESCC | 5.41e-20 | 4.97e-01 | 0.1323 |
| 54516 | MTRF1L | P5T-E | Human | Esophagus | ESCC | 9.76e-13 | 3.21e-01 | 0.1327 |
| 54516 | MTRF1L | P8T-E | Human | Esophagus | ESCC | 9.13e-11 | 2.76e-01 | 0.0889 |
| 54516 | MTRF1L | P9T-E | Human | Esophagus | ESCC | 2.63e-06 | 1.69e-01 | 0.1131 |
| 54516 | MTRF1L | P10T-E | Human | Esophagus | ESCC | 1.58e-09 | 1.80e-01 | 0.116 |
| 54516 | MTRF1L | P11T-E | Human | Esophagus | ESCC | 6.78e-14 | 5.09e-01 | 0.1426 |
| 54516 | MTRF1L | P12T-E | Human | Esophagus | ESCC | 1.87e-09 | 2.07e-01 | 0.1122 |
| 54516 | MTRF1L | P15T-E | Human | Esophagus | ESCC | 2.11e-15 | 2.94e-01 | 0.1149 |
| 54516 | MTRF1L | P16T-E | Human | Esophagus | ESCC | 4.65e-10 | 2.74e-01 | 0.1153 |
| 54516 | MTRF1L | P17T-E | Human | Esophagus | ESCC | 3.30e-03 | 1.21e-01 | 0.1278 |
| 54516 | MTRF1L | P19T-E | Human | Esophagus | ESCC | 1.16e-05 | 3.82e-01 | 0.1662 |
| 54516 | MTRF1L | P20T-E | Human | Esophagus | ESCC | 6.74e-10 | 3.11e-01 | 0.1124 |
| 54516 | MTRF1L | P21T-E | Human | Esophagus | ESCC | 3.88e-25 | 5.41e-01 | 0.1617 |
| 54516 | MTRF1L | P22T-E | Human | Esophagus | ESCC | 1.80e-07 | 2.12e-01 | 0.1236 |
| 54516 | MTRF1L | P23T-E | Human | Esophagus | ESCC | 3.94e-14 | 3.73e-01 | 0.108 |
| 54516 | MTRF1L | P24T-E | Human | Esophagus | ESCC | 1.02e-10 | 2.91e-01 | 0.1287 |
| Page: 1 2 3 4 5 |
| Tissue | Expression Dynamics | Abbreviation |
| Esophagus | 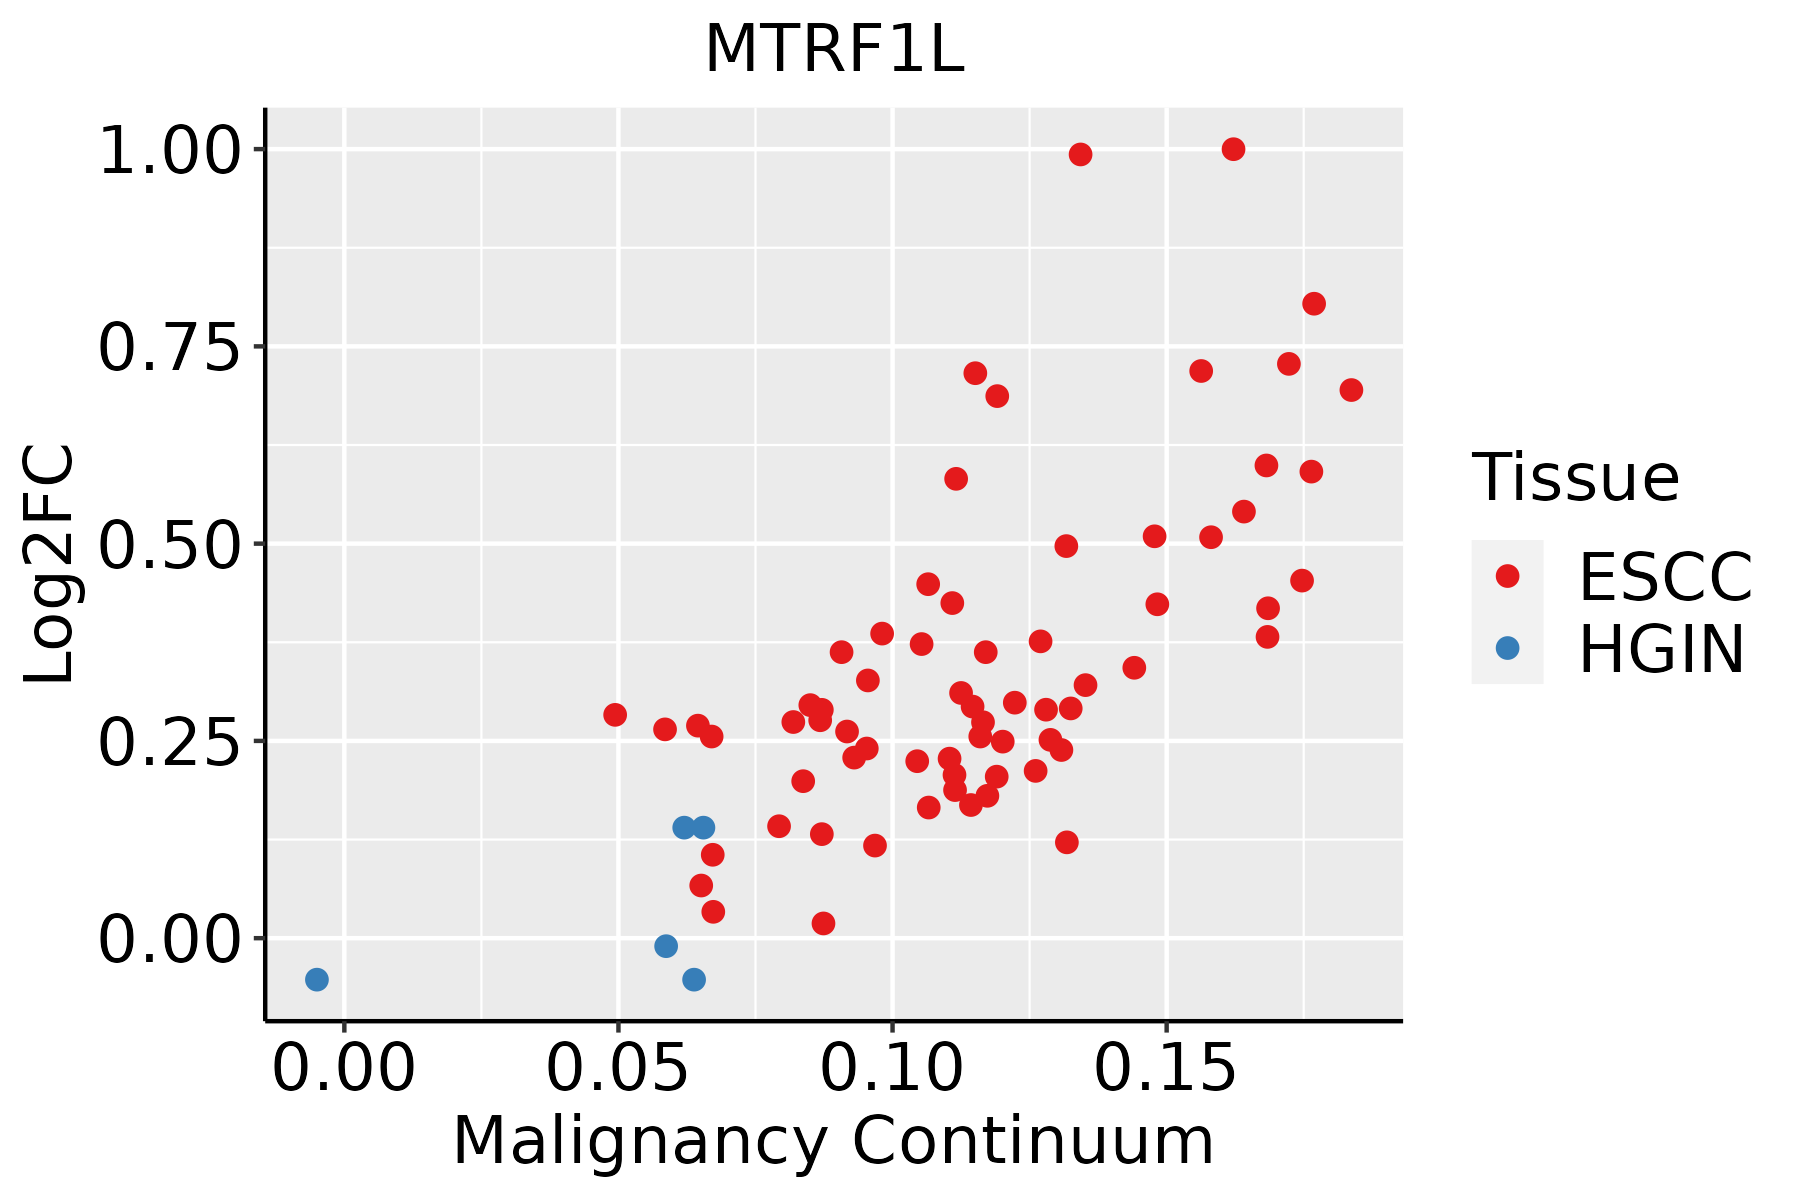 | ESCC: Esophageal squamous cell carcinoma |
| HGIN: High-grade intraepithelial neoplasias | ||
| LGIN: Low-grade intraepithelial neoplasias | ||
| Liver | 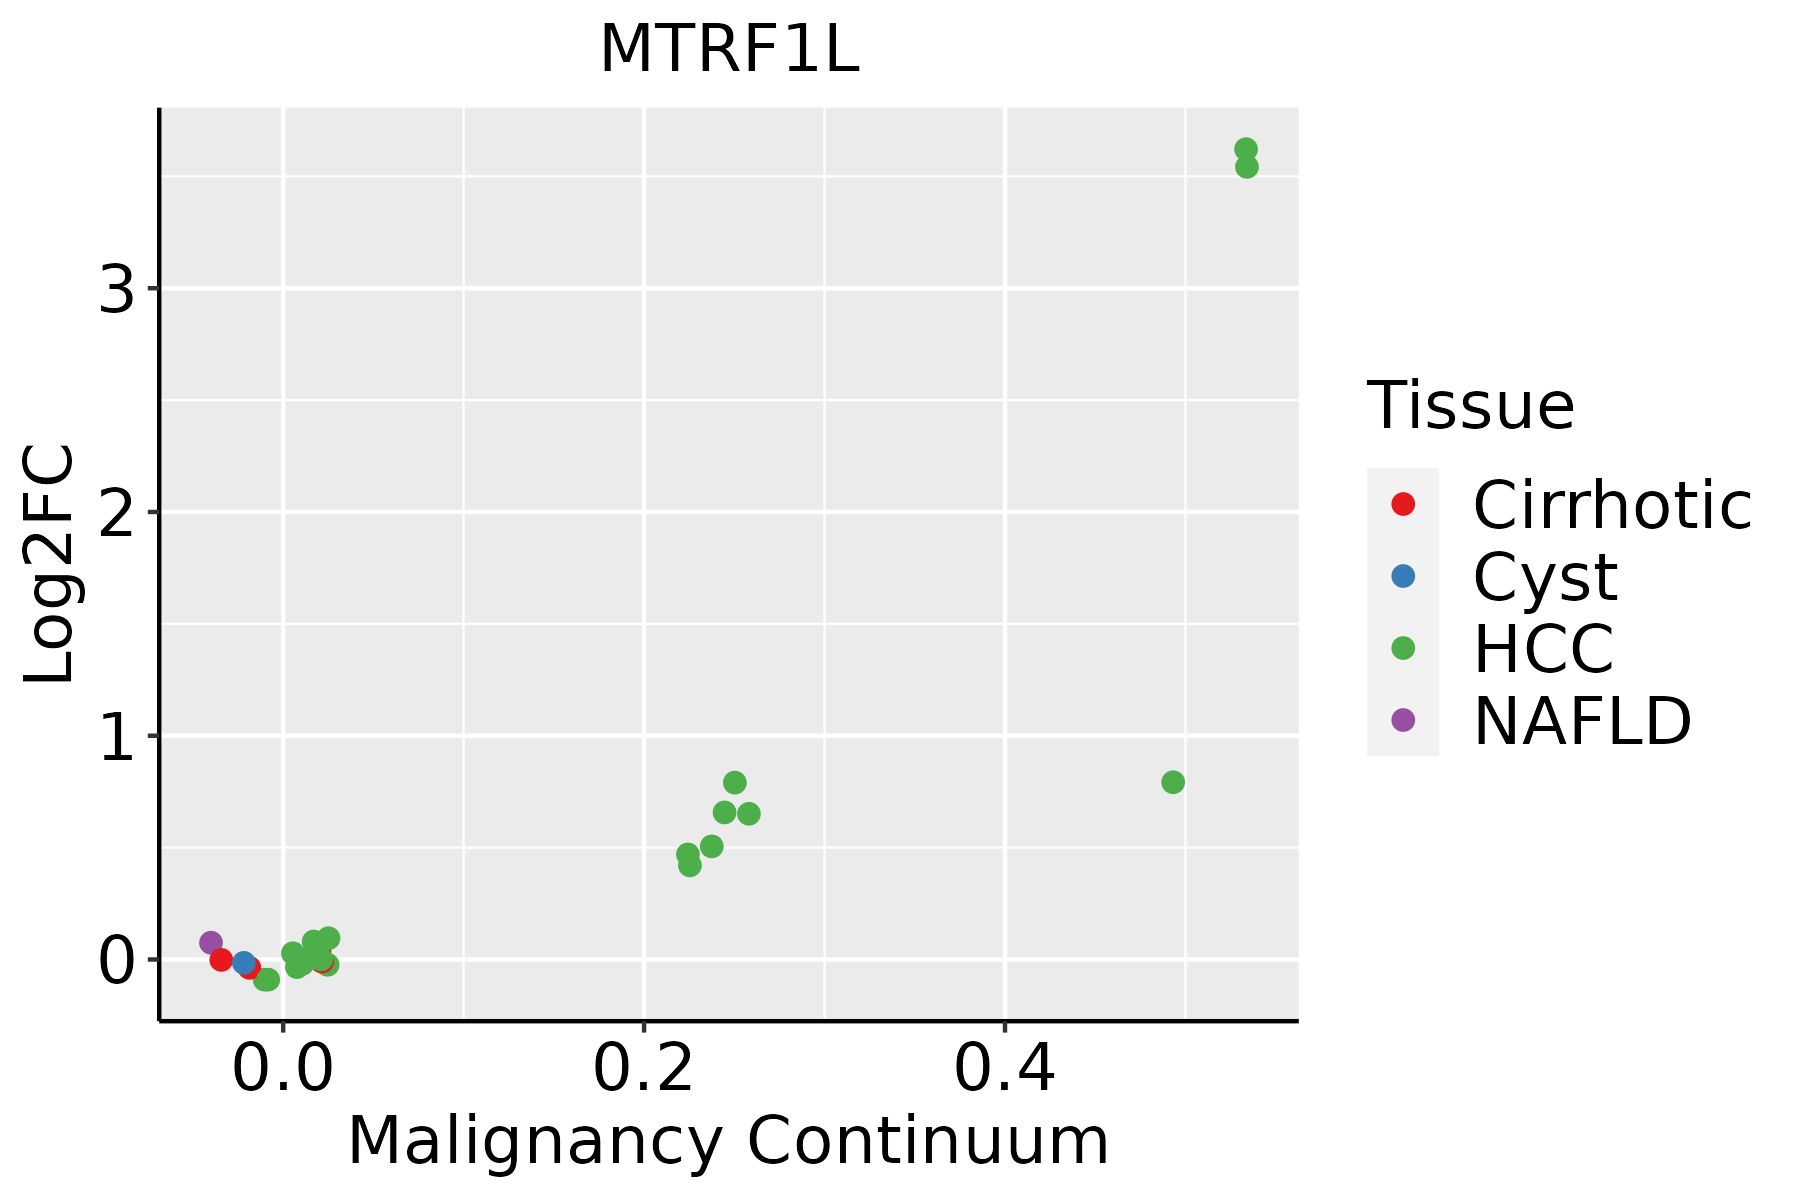 | HCC: Hepatocellular carcinoma |
| NAFLD: Non-alcoholic fatty liver disease | ||
| Oral Cavity | 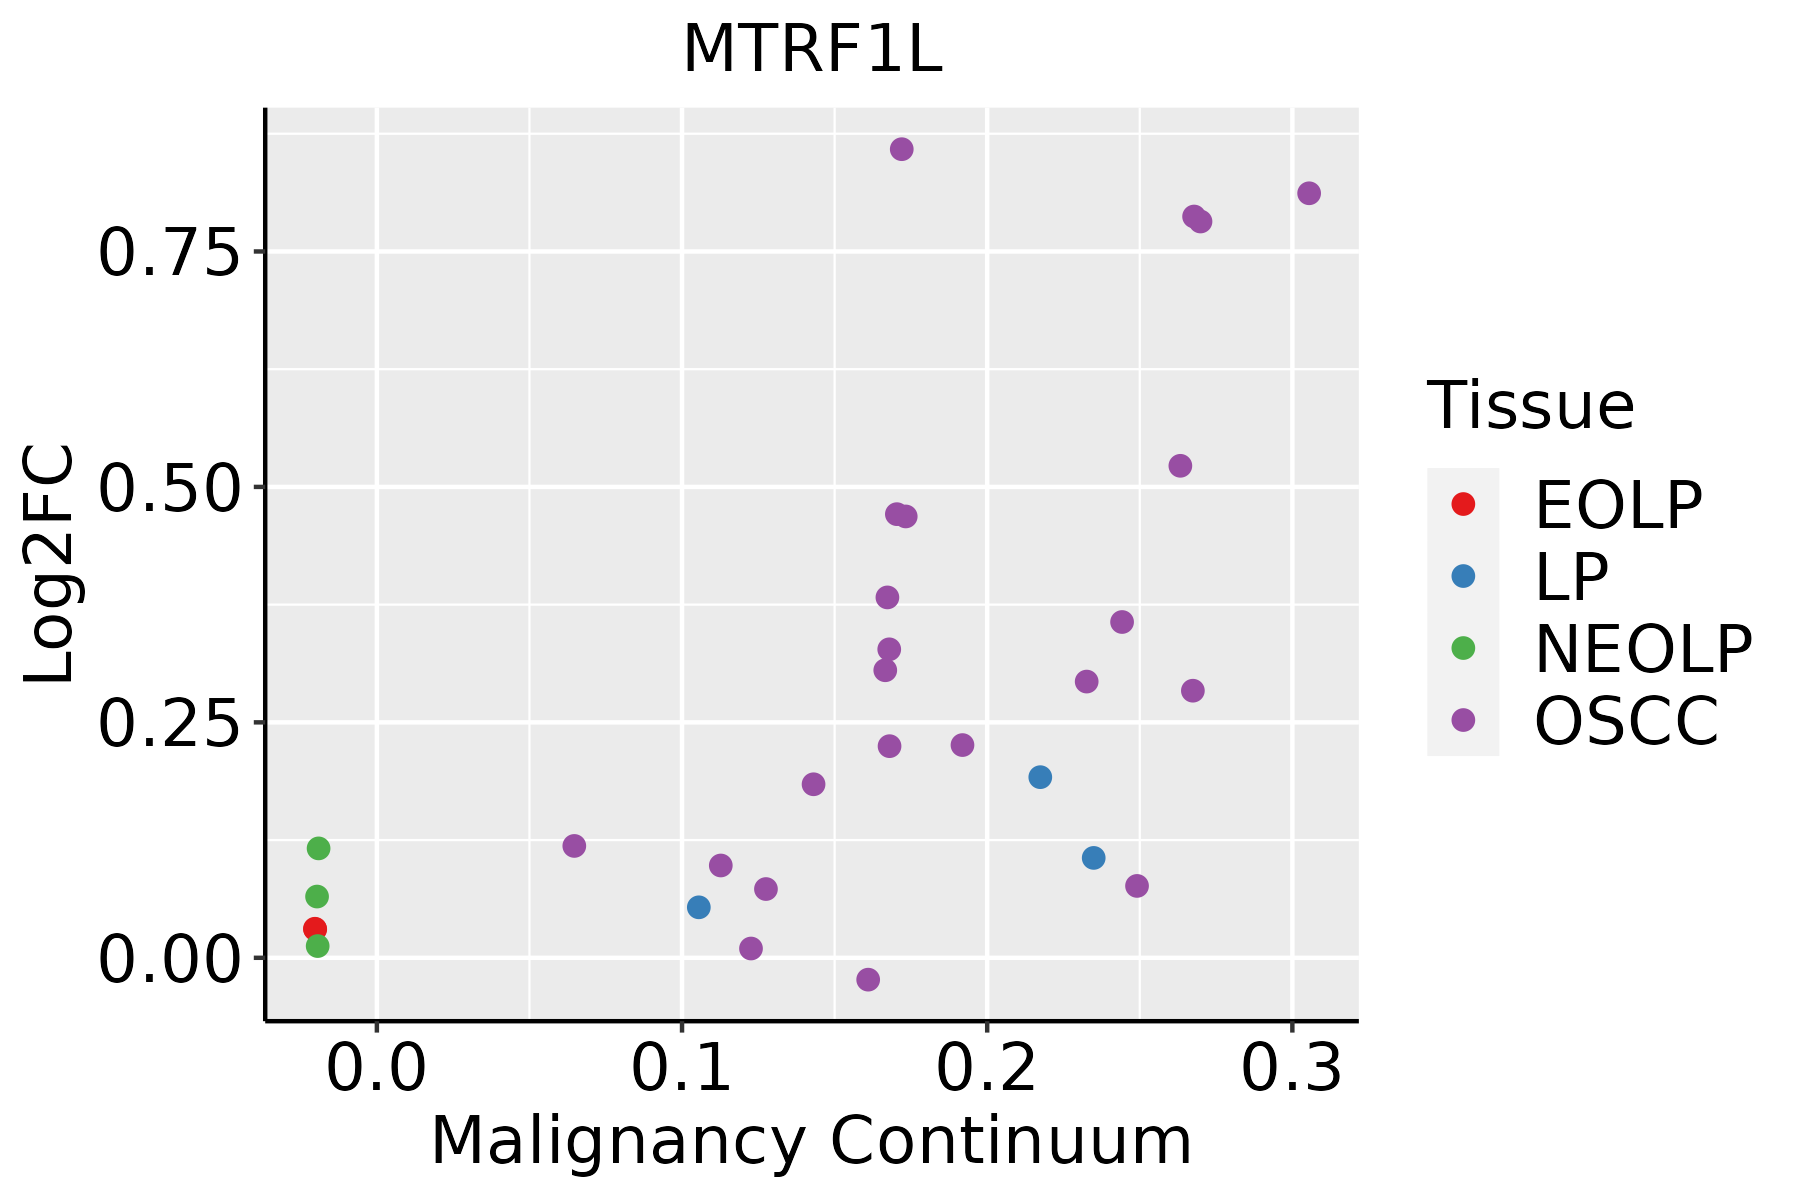 | EOLP: Erosive Oral lichen planus |
| LP: leukoplakia | ||
| NEOLP: Non-erosive oral lichen planus | ||
| OSCC: Oral squamous cell carcinoma | ||
| Thyroid |  | ATC: Anaplastic thyroid cancer |
| HT: Hashimoto's thyroiditis | ||
| PTC: Papillary thyroid cancer |
| ∗log2FC in expression of this searched gene in stem-like cells from each diseased tissue sample relative to stem-like cells in normal samples in each tissue plotted against the malignancy continuum. Samples are colored based on if they are from different disease stage. |
Top |
Malignant transformation related pathway analysis |
| Find out the enriched GO biological processes and KEGG pathways involved in transition from healthy to precancer to cancer |
| Tissue | Disease Stage | Enriched GO biological Processes |
| Colorectum | AD |  |
| Colorectum | SER |  |
| Colorectum | MSS |  |
| Colorectum | MSI-H |  |
| Colorectum | FAP |  |
| ∗Top 15 enriched GO BP terms are showed in the bar plot of each disease state in each tissue. Each row represents a significant GO biological process which is colored according to the -log10(p.adjust). |
| Page: 1 2 3 4 5 6 7 8 9 |
| GO ID | Tissue | Disease Stage | Description | Gene Ratio | Bg Ratio | pvalue | p.adjust | Count |
| GO:0022411111 | Esophagus | ESCC | cellular component disassembly | 305/8552 | 443/18723 | 1.94e-23 | 4.57e-21 | 305 |
| GO:014005313 | Esophagus | ESCC | mitochondrial gene expression | 93/8552 | 108/18723 | 1.96e-18 | 2.03e-16 | 93 |
| GO:003254314 | Esophagus | ESCC | mitochondrial translation | 68/8552 | 76/18723 | 1.02e-15 | 6.86e-14 | 68 |
| GO:003298416 | Esophagus | ESCC | protein-containing complex disassembly | 151/8552 | 224/18723 | 3.45e-11 | 1.15e-09 | 151 |
| GO:00436245 | Esophagus | ESCC | cellular protein complex disassembly | 78/8552 | 136/18723 | 4.00e-03 | 1.62e-02 | 78 |
| GO:002241112 | Liver | HCC | cellular component disassembly | 282/7958 | 443/18723 | 1.02e-19 | 1.38e-17 | 282 |
| GO:01400531 | Liver | HCC | mitochondrial gene expression | 82/7958 | 108/18723 | 1.49e-12 | 7.20e-11 | 82 |
| GO:00325431 | Liver | HCC | mitochondrial translation | 62/7958 | 76/18723 | 2.95e-12 | 1.34e-10 | 62 |
| GO:003298411 | Liver | HCC | protein-containing complex disassembly | 138/7958 | 224/18723 | 5.59e-09 | 1.46e-07 | 138 |
| GO:00436242 | Liver | HCC | cellular protein complex disassembly | 71/7958 | 136/18723 | 1.39e-02 | 4.95e-02 | 71 |
| GO:002241119 | Oral cavity | OSCC | cellular component disassembly | 283/7305 | 443/18723 | 9.57e-27 | 3.37e-24 | 283 |
| GO:01400533 | Oral cavity | OSCC | mitochondrial gene expression | 78/7305 | 108/18723 | 2.37e-12 | 9.86e-11 | 78 |
| GO:00325434 | Oral cavity | OSCC | mitochondrial translation | 59/7305 | 76/18723 | 7.21e-12 | 2.70e-10 | 59 |
| GO:003298410 | Oral cavity | OSCC | protein-containing complex disassembly | 136/7305 | 224/18723 | 3.42e-11 | 1.13e-09 | 136 |
| GO:0006415 | Oral cavity | OSCC | translational termination | 13/7305 | 18/18723 | 4.45e-03 | 1.79e-02 | 13 |
| GO:00436244 | Oral cavity | OSCC | cellular protein complex disassembly | 68/7305 | 136/18723 | 5.84e-03 | 2.24e-02 | 68 |
| GO:0022411113 | Thyroid | PTC | cellular component disassembly | 232/5968 | 443/18723 | 1.36e-19 | 1.75e-17 | 232 |
| GO:0032984110 | Thyroid | PTC | protein-containing complex disassembly | 114/5968 | 224/18723 | 2.26e-09 | 6.33e-08 | 114 |
| GO:00436247 | Thyroid | PTC | cellular protein complex disassembly | 64/5968 | 136/18723 | 1.49e-04 | 1.15e-03 | 64 |
| GO:01400536 | Thyroid | PTC | mitochondrial gene expression | 51/5968 | 108/18723 | 6.04e-04 | 3.83e-03 | 51 |
| Page: 1 2 |
| Pathway ID | Tissue | Disease Stage | Description | Gene Ratio | Bg Ratio | pvalue | p.adjust | qvalue | Count |
| Page: 1 |
Top |
Cell-cell communication analysis |
| Identification of potential cell-cell interactions between two cell types and their ligand-receptor pairs for different disease states |
| Ligand | Receptor | LRpair | Pathway | Tissue | Disease Stage |
| Page: 1 |
Top |
Single-cell gene regulatory network inference analysis |
| Find out the significant the regulons (TFs) and the target genes of each regulon across cell types for different disease states |
| TF | Cell Type | Tissue | Disease Stage | Target Gene | RSS | Regulon Activity |
| ∗The dot plots of a searched regulon are shown for all cell subpopulations in each disease state of each tissue based on the regulon specific score inferred using pySCENIC and by calculating the average expression. |
| Page: 1 |
Top |
Somatic mutation of malignant transformation related genes |
| Annotation of somatic variants for genes involved in malignant transformation |
| Hugo Symbol | Variant Class | Variant Classification | dbSNP RS | HGVSc | HGVSp | HGVSp Short | SWISSPROT | BIOTYPE | SIFT | PolyPhen | Tumor Sample Barcode | Tissue | Histology | Sex | Age | Stage | Therapy Types | Drugs | Outcome |
| MTRF1L | SNV | Missense_Mutation | novel | c.770C>A | p.Thr257Lys | p.T257K | Q9UGC7 | protein_coding | deleterious(0) | probably_damaging(1) | TCGA-D8-A1XM-01 | Breast | breast invasive carcinoma | Female | <65 | I/II | Unknown | Unknown | SD |
| MTRF1L | SNV | Missense_Mutation | c.630N>C | p.Lys210Asn | p.K210N | Q9UGC7 | protein_coding | deleterious(0) | possibly_damaging(0.632) | TCGA-E2-A14S-01 | Breast | breast invasive carcinoma | Female | >=65 | I/II | Chemotherapy | cytoxan | SD | |
| MTRF1L | SNV | Missense_Mutation | novel | c.719N>T | p.Arg240Ile | p.R240I | Q9UGC7 | protein_coding | deleterious(0) | probably_damaging(0.982) | TCGA-EW-A6SA-01 | Breast | breast invasive carcinoma | Male | <65 | I/II | Unknown | Unknown | SD |
| MTRF1L | SNV | Missense_Mutation | novel | c.1024N>G | p.Thr342Ala | p.T342A | Q9UGC7 | protein_coding | tolerated(0.07) | benign(0.003) | TCGA-FU-A3HZ-01 | Cervix | cervical & endocervical cancer | Female | <65 | I/II | Chemotherapy | cisplatin | CR |
| MTRF1L | SNV | Missense_Mutation | novel | c.1061A>T | p.Tyr354Phe | p.Y354F | Q9UGC7 | protein_coding | deleterious(0.02) | benign(0.081) | TCGA-AA-3862-01 | Colorectum | colon adenocarcinoma | Male | >=65 | I/II | Unknown | Unknown | SD |
| MTRF1L | SNV | Missense_Mutation | novel | c.966N>T | p.Glu322Asp | p.E322D | Q9UGC7 | protein_coding | deleterious(0.02) | probably_damaging(0.999) | TCGA-AA-3984-01 | Colorectum | colon adenocarcinoma | Female | <65 | I/II | Unknown | Unknown | SD |
| MTRF1L | SNV | Missense_Mutation | c.322N>T | p.Thr108Ser | p.T108S | Q9UGC7 | protein_coding | tolerated(0.68) | benign(0.082) | TCGA-AD-6895-01 | Colorectum | colon adenocarcinoma | Male | >=65 | III/IV | Unknown | Unknown | SD | |
| MTRF1L | deletion | Frame_Shift_Del | c.557delN | p.Gly186ValfsTer8 | p.G186Vfs*8 | Q9UGC7 | protein_coding | TCGA-AD-5900-01 | Colorectum | colon adenocarcinoma | Male | >=65 | I/II | Unknown | Unknown | SD | |||
| MTRF1L | insertion | Frame_Shift_Ins | novel | c.979_980insTTGGGAA | p.Tyr327PhefsTer4 | p.Y327Ffs*4 | Q9UGC7 | protein_coding | TCGA-AM-5820-01 | Colorectum | colon adenocarcinoma | Female | <65 | I/II | Unknown | Unknown | SD | ||
| MTRF1L | SNV | Missense_Mutation | novel | c.966N>T | p.Glu322Asp | p.E322D | Q9UGC7 | protein_coding | deleterious(0.02) | probably_damaging(0.999) | TCGA-A5-A0G2-01 | Endometrium | uterine corpus endometrioid carcinoma | Female | <65 | III/IV | Unknown | Unknown | SD |
| Page: 1 2 3 4 |
Top |
Related drugs of malignant transformation related genes |
| Identification of chemicals and drugs interact with genes involved in malignant transfromation |
| (DGIdb 4.0) |
| Entrez ID | Symbol | Category | Interaction Types | Drug Claim Name | Drug Name | PMIDs |
| 54516 | MTRF1L | NA | antidepressants |
| Page: 1 |

Copyright 2023-Present -The University of Texas Health Science Center at Houston |