
|
|||||
|
 | |
| |
| |
| |
| |
| |
|
Gene: MTR |
Gene summary for MTR |
| Gene information | Species | Human | Gene symbol | MTR | Gene ID | 4548 |
| Gene name | 5-methyltetrahydrofolate-homocysteine methyltransferase | |
| Gene Alias | HMAG | |
| Cytomap | 1q43 | |
| Gene Type | protein-coding | GO ID | GO:0000096 | UniProtAcc | Q99707 |
Top |
Malignant transformation analysis |
| Identification of the aberrant gene expression in precancerous and cancerous lesions by comparing the gene expression of stem-like cells in diseased tissues with normal stem cells |
| Entrez ID | Symbol | Replicates | Species | Organ | Tissue | Adj P-value | Log2FC | Malignancy |
| 4548 | MTR | LZE2T | Human | Esophagus | ESCC | 1.87e-05 | 4.84e-01 | 0.082 |
| 4548 | MTR | LZE4T | Human | Esophagus | ESCC | 8.46e-08 | 2.31e-01 | 0.0811 |
| 4548 | MTR | LZE7T | Human | Esophagus | ESCC | 1.42e-08 | 6.16e-01 | 0.0667 |
| 4548 | MTR | LZE24T | Human | Esophagus | ESCC | 1.01e-06 | 1.82e-01 | 0.0596 |
| 4548 | MTR | LZE21T | Human | Esophagus | ESCC | 4.49e-02 | 2.24e-01 | 0.0655 |
| 4548 | MTR | LZE6T | Human | Esophagus | ESCC | 6.39e-03 | 2.05e-01 | 0.0845 |
| 4548 | MTR | P1T-E | Human | Esophagus | ESCC | 5.47e-11 | 4.65e-01 | 0.0875 |
| 4548 | MTR | P2T-E | Human | Esophagus | ESCC | 1.94e-26 | 5.24e-01 | 0.1177 |
| 4548 | MTR | P4T-E | Human | Esophagus | ESCC | 1.36e-13 | 2.24e-01 | 0.1323 |
| 4548 | MTR | P5T-E | Human | Esophagus | ESCC | 2.98e-19 | 2.95e-01 | 0.1327 |
| 4548 | MTR | P8T-E | Human | Esophagus | ESCC | 2.77e-21 | 2.83e-01 | 0.0889 |
| 4548 | MTR | P9T-E | Human | Esophagus | ESCC | 2.52e-13 | 2.48e-01 | 0.1131 |
| 4548 | MTR | P10T-E | Human | Esophagus | ESCC | 2.74e-31 | 4.54e-01 | 0.116 |
| 4548 | MTR | P11T-E | Human | Esophagus | ESCC | 4.08e-11 | 3.98e-01 | 0.1426 |
| 4548 | MTR | P12T-E | Human | Esophagus | ESCC | 4.84e-18 | 2.90e-01 | 0.1122 |
| 4548 | MTR | P15T-E | Human | Esophagus | ESCC | 1.05e-17 | 3.90e-01 | 0.1149 |
| 4548 | MTR | P16T-E | Human | Esophagus | ESCC | 3.21e-34 | 5.28e-01 | 0.1153 |
| 4548 | MTR | P17T-E | Human | Esophagus | ESCC | 1.29e-04 | 2.39e-01 | 0.1278 |
| 4548 | MTR | P20T-E | Human | Esophagus | ESCC | 5.03e-10 | 2.02e-01 | 0.1124 |
| 4548 | MTR | P21T-E | Human | Esophagus | ESCC | 1.38e-15 | 2.62e-01 | 0.1617 |
| Page: 1 2 3 4 5 |
| Tissue | Expression Dynamics | Abbreviation |
| Esophagus | 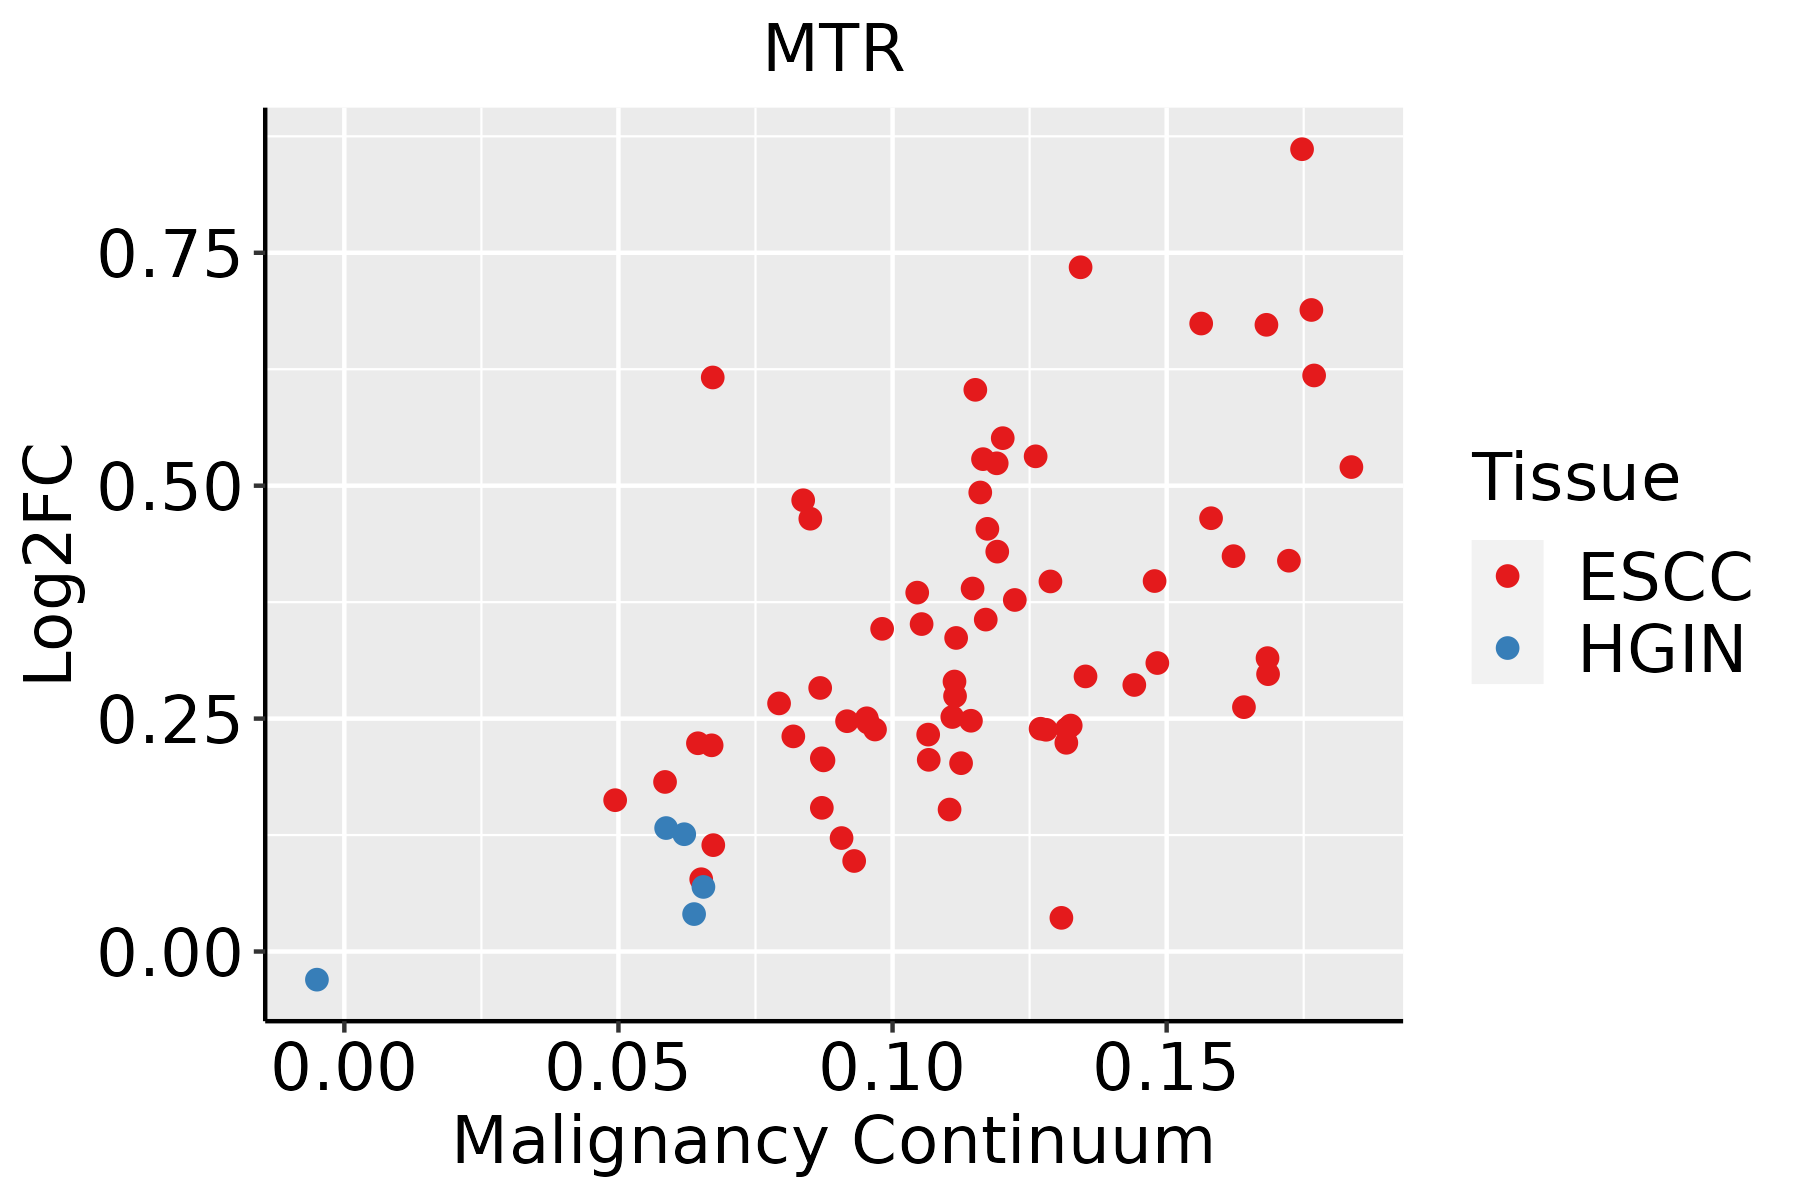 | ESCC: Esophageal squamous cell carcinoma |
| HGIN: High-grade intraepithelial neoplasias | ||
| LGIN: Low-grade intraepithelial neoplasias | ||
| Liver | 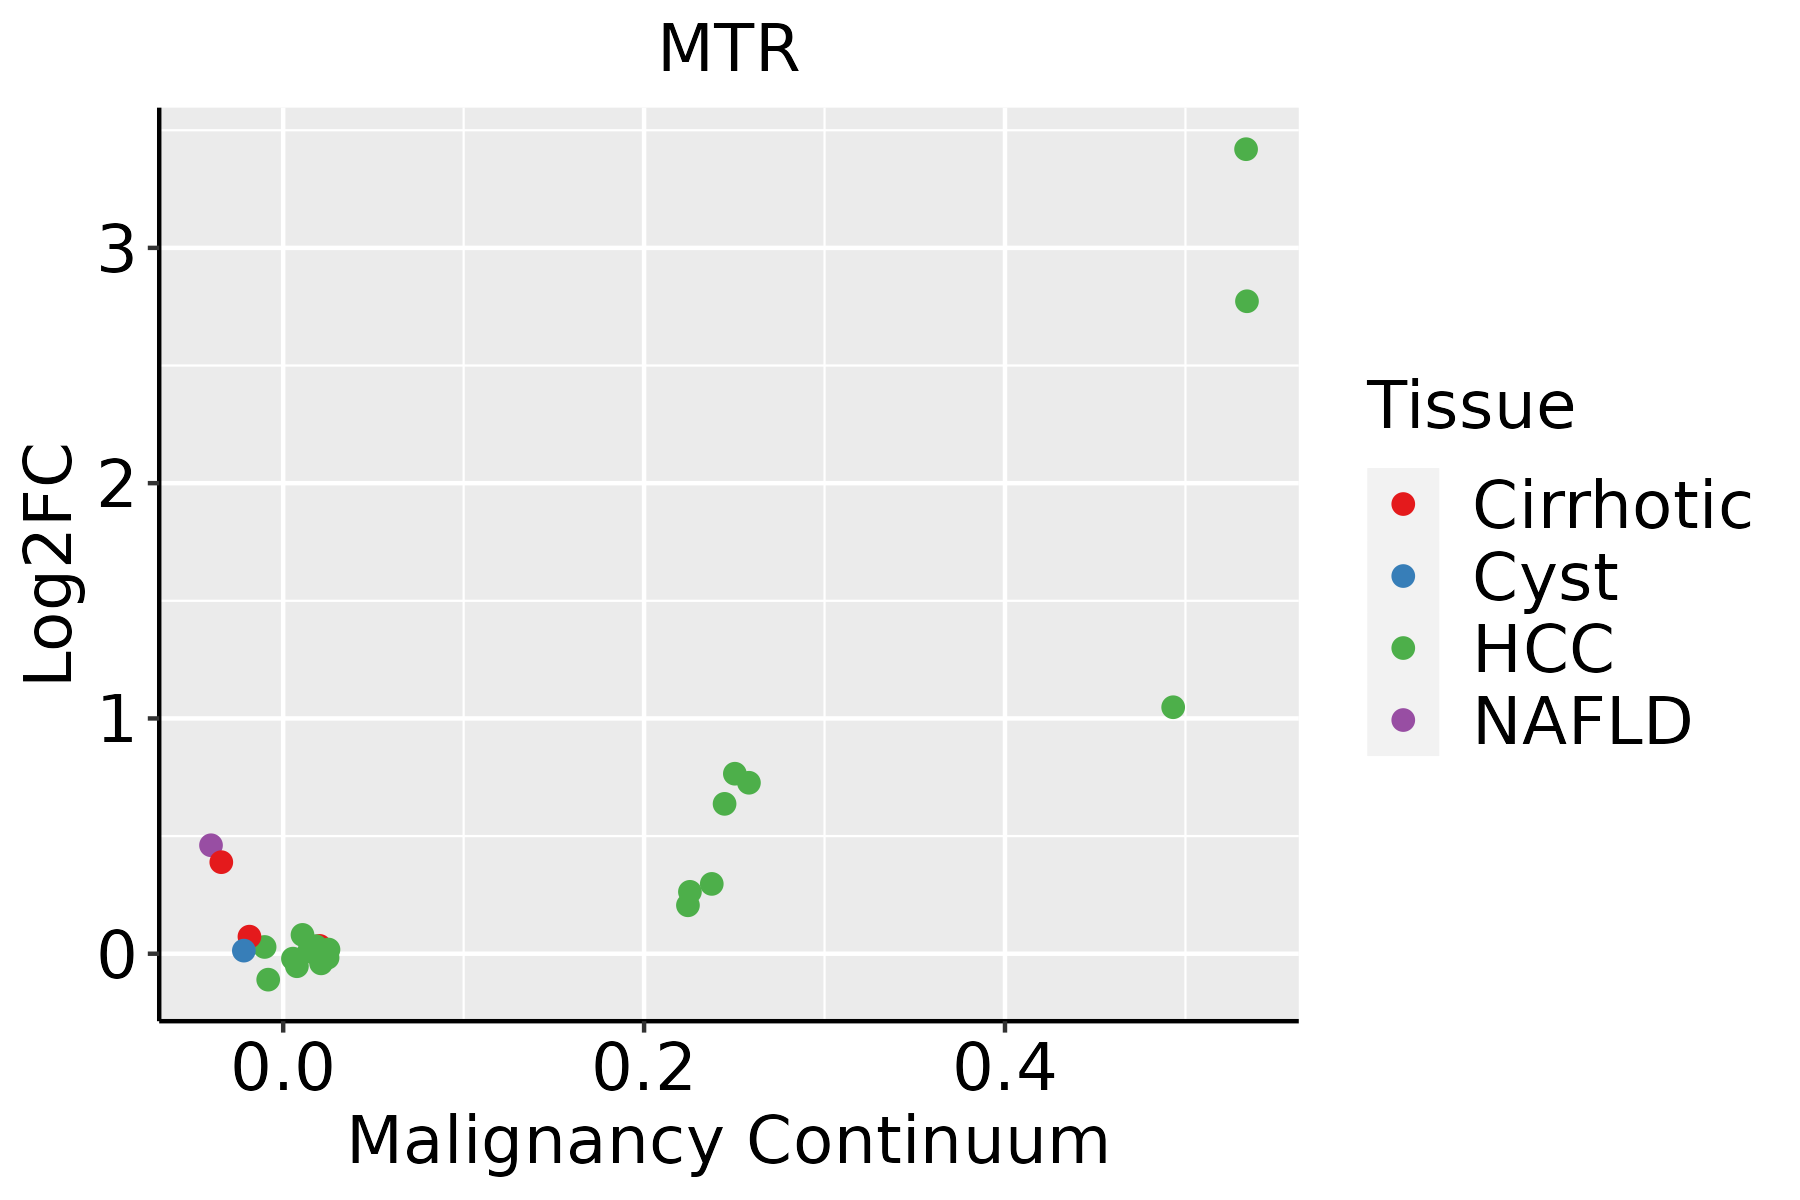 | HCC: Hepatocellular carcinoma |
| NAFLD: Non-alcoholic fatty liver disease | ||
| Prostate | 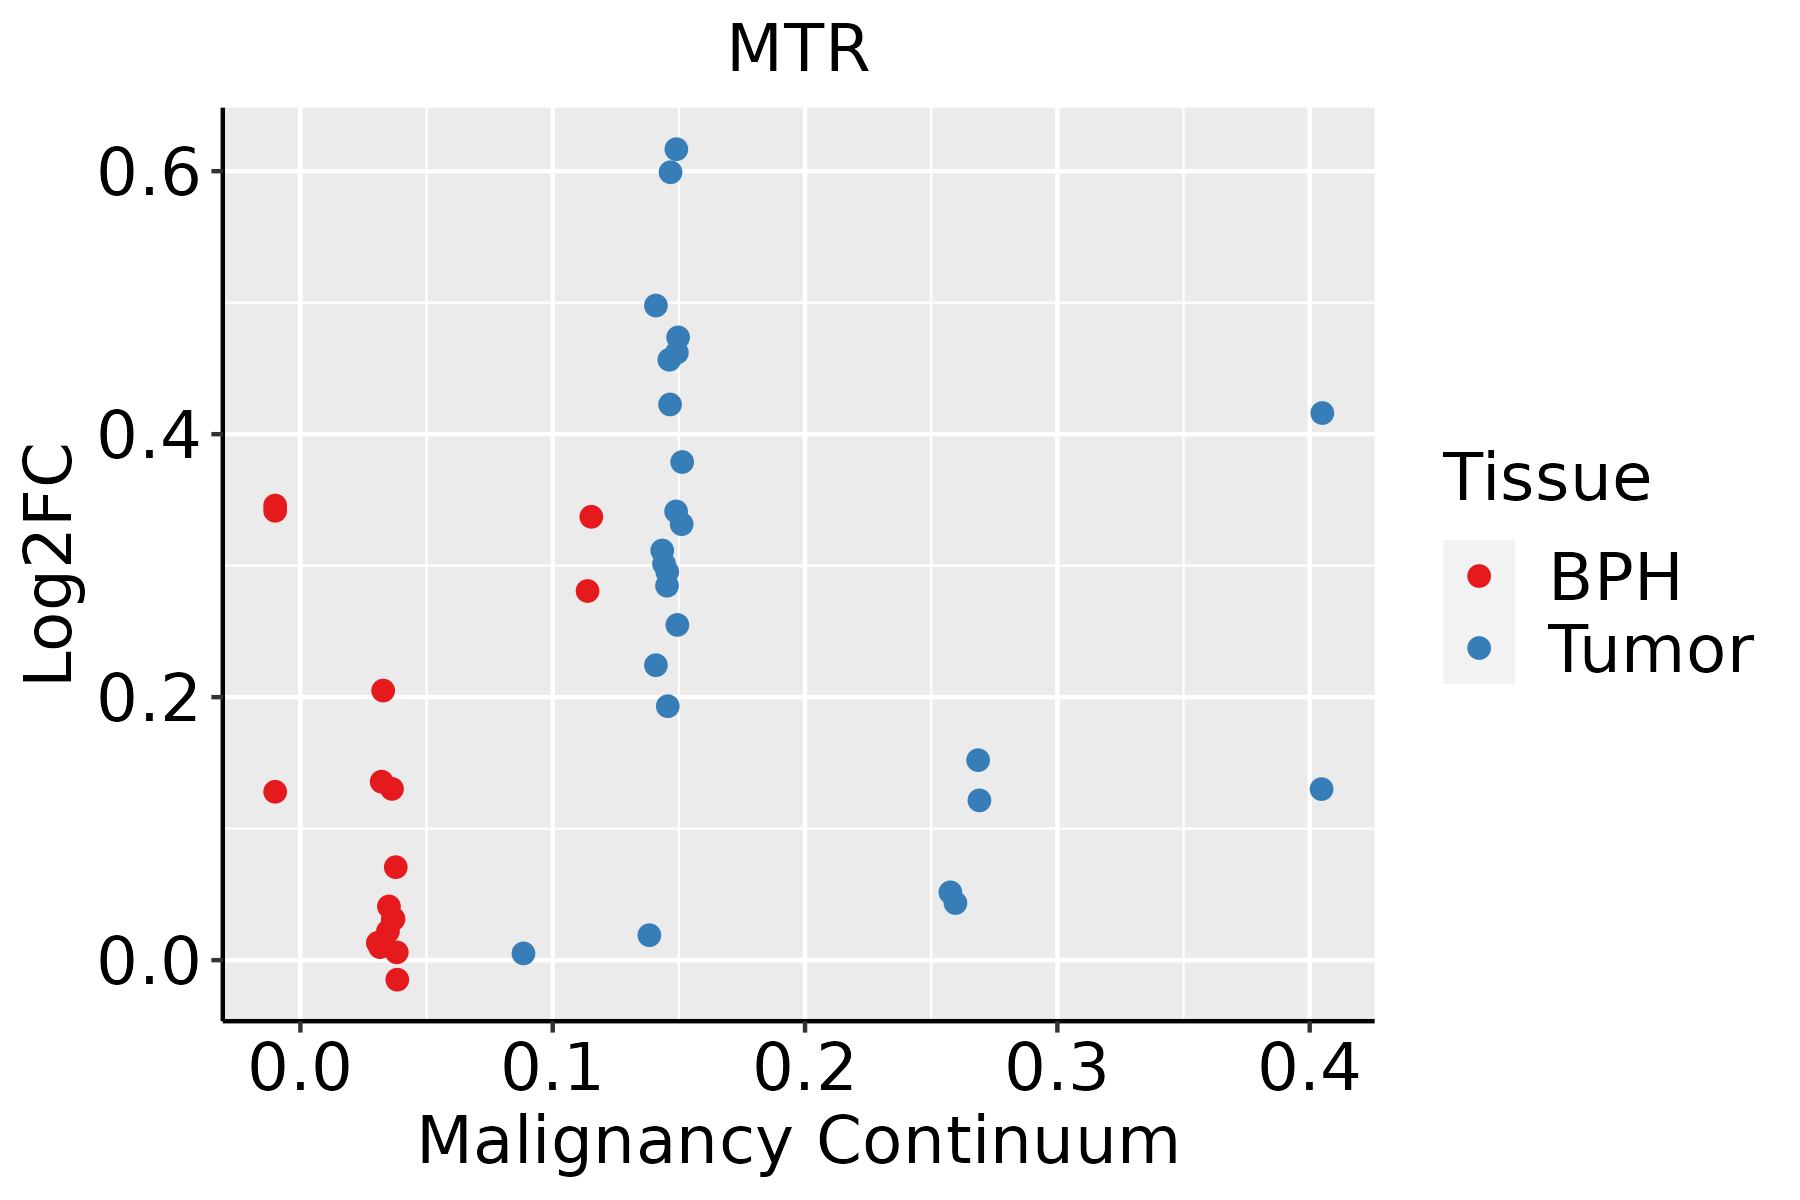 | BPH: Benign Prostatic Hyperplasia |
| Thyroid | 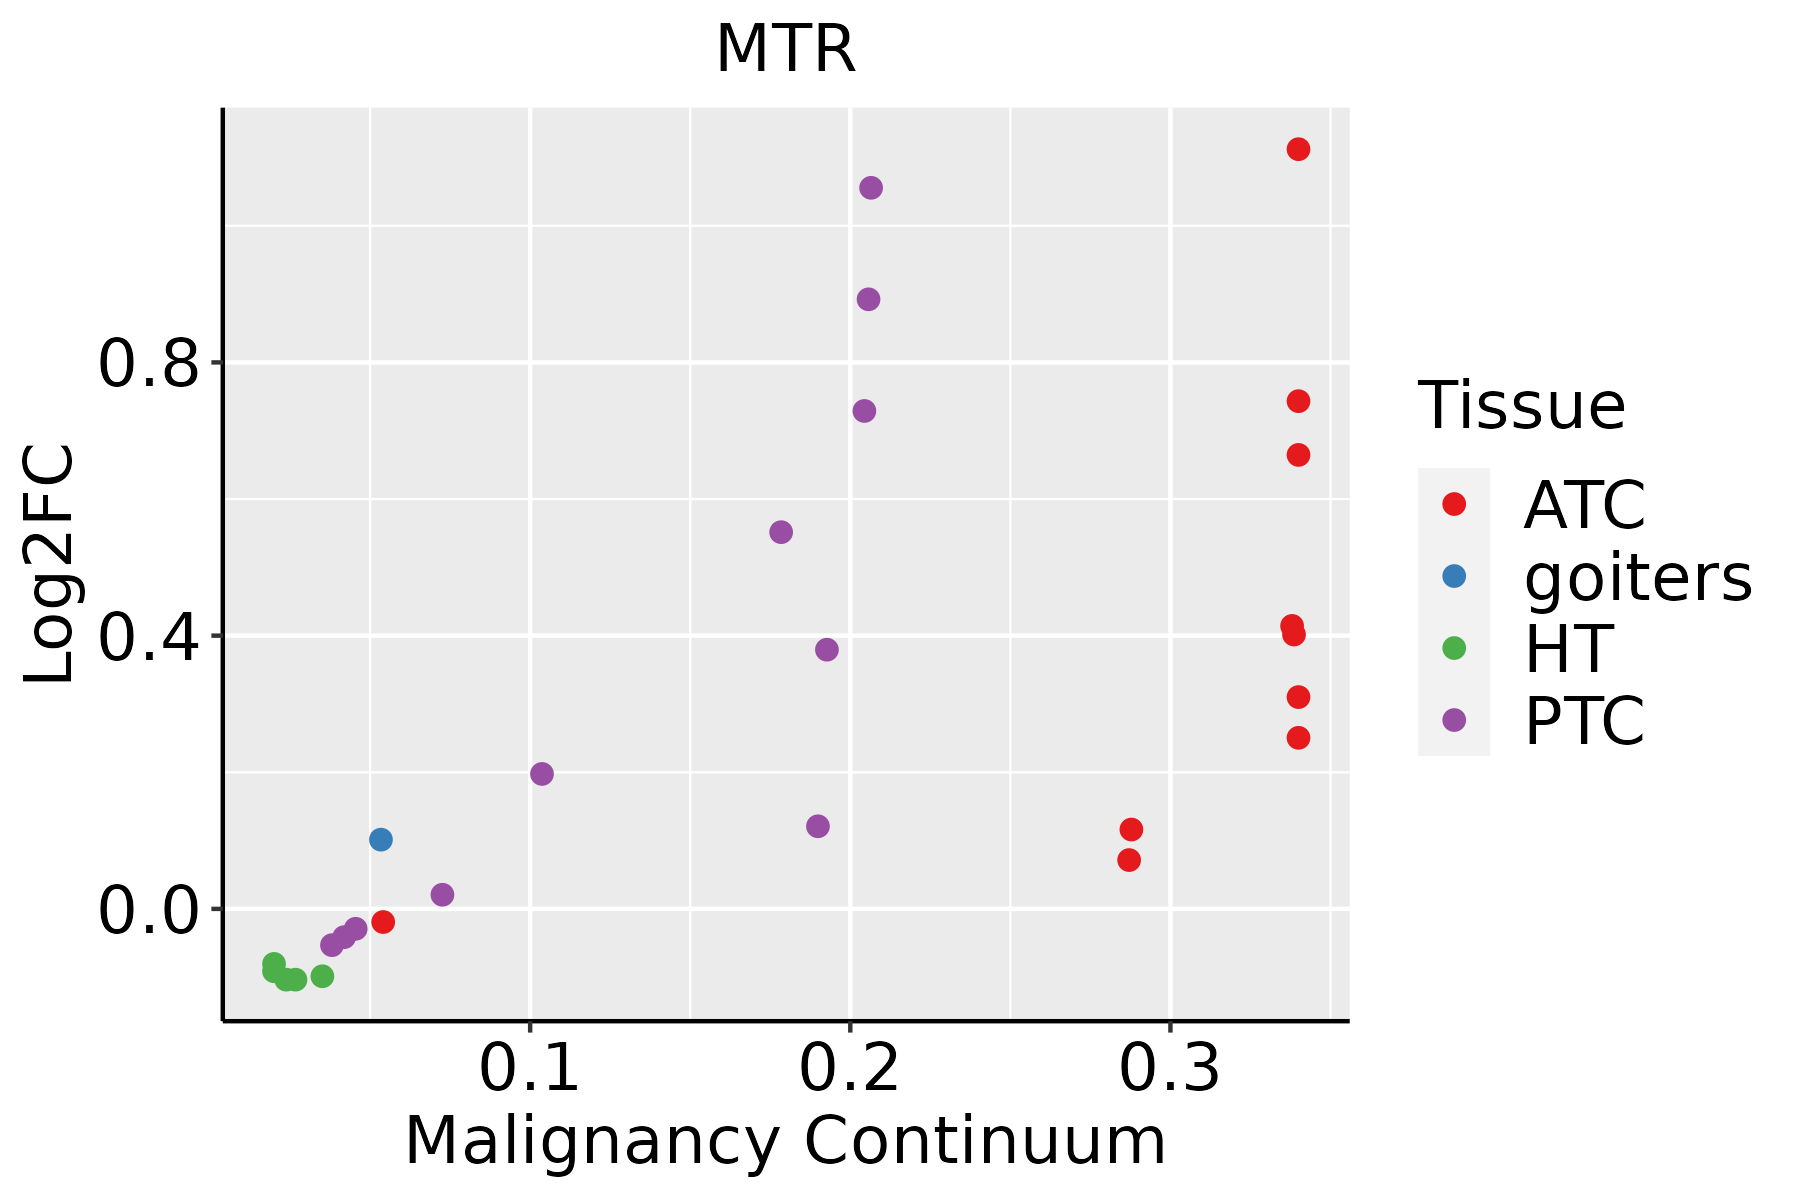 | ATC: Anaplastic thyroid cancer |
| HT: Hashimoto's thyroiditis | ||
| PTC: Papillary thyroid cancer |
| ∗log2FC in expression of this searched gene in stem-like cells from each diseased tissue sample relative to stem-like cells in normal samples in each tissue plotted against the malignancy continuum. Samples are colored based on if they are from different disease stage. |
Top |
Malignant transformation related pathway analysis |
| Find out the enriched GO biological processes and KEGG pathways involved in transition from healthy to precancer to cancer |
| Tissue | Disease Stage | Enriched GO biological Processes |
| Colorectum | AD |  |
| Colorectum | SER |  |
| Colorectum | MSS |  |
| Colorectum | MSI-H |  |
| Colorectum | FAP |  |
| ∗Top 15 enriched GO BP terms are showed in the bar plot of each disease state in each tissue. Each row represents a significant GO biological process which is colored according to the -log10(p.adjust). |
| Page: 1 2 3 4 5 6 7 8 9 |
| GO ID | Tissue | Disease Stage | Description | Gene Ratio | Bg Ratio | pvalue | p.adjust | Count |
| GO:0008380 | Colorectum | AD | RNA splicing | 169/3918 | 434/18723 | 3.59e-18 | 2.04e-15 | 169 |
| GO:0000377 | Colorectum | AD | RNA splicing, via transesterification reactions with bulged adenosine as nucleophile | 130/3918 | 320/18723 | 5.88e-16 | 2.16e-13 | 130 |
| GO:0000398 | Colorectum | AD | mRNA splicing, via spliceosome | 130/3918 | 320/18723 | 5.88e-16 | 2.16e-13 | 130 |
| GO:0000375 | Colorectum | AD | RNA splicing, via transesterification reactions | 131/3918 | 324/18723 | 7.11e-16 | 2.22e-13 | 131 |
| GO:0006401 | Colorectum | AD | RNA catabolic process | 102/3918 | 278/18723 | 8.64e-10 | 6.76e-08 | 102 |
| GO:0022613 | Colorectum | AD | ribonucleoprotein complex biogenesis | 151/3918 | 463/18723 | 1.96e-09 | 1.39e-07 | 151 |
| GO:0044270 | Colorectum | AD | cellular nitrogen compound catabolic process | 147/3918 | 451/18723 | 3.35e-09 | 2.23e-07 | 147 |
| GO:0046700 | Colorectum | AD | heterocycle catabolic process | 145/3918 | 445/18723 | 4.37e-09 | 2.84e-07 | 145 |
| GO:0034655 | Colorectum | AD | nucleobase-containing compound catabolic process | 133/3918 | 407/18723 | 1.56e-08 | 9.12e-07 | 133 |
| GO:0019439 | Colorectum | AD | aromatic compound catabolic process | 146/3918 | 467/18723 | 7.48e-08 | 3.84e-06 | 146 |
| GO:1901361 | Colorectum | AD | organic cyclic compound catabolic process | 153/3918 | 495/18723 | 8.23e-08 | 4.18e-06 | 153 |
| GO:0042254 | Colorectum | AD | ribosome biogenesis | 84/3918 | 299/18723 | 1.82e-03 | 1.50e-02 | 84 |
| GO:00083802 | Colorectum | MSS | RNA splicing | 159/3467 | 434/18723 | 1.75e-19 | 1.22e-16 | 159 |
| GO:00003772 | Colorectum | MSS | RNA splicing, via transesterification reactions with bulged adenosine as nucleophile | 121/3467 | 320/18723 | 2.52e-16 | 8.27e-14 | 121 |
| GO:00003982 | Colorectum | MSS | mRNA splicing, via spliceosome | 121/3467 | 320/18723 | 2.52e-16 | 8.27e-14 | 121 |
| GO:00003752 | Colorectum | MSS | RNA splicing, via transesterification reactions | 122/3467 | 324/18723 | 2.75e-16 | 8.58e-14 | 122 |
| GO:00064012 | Colorectum | MSS | RNA catabolic process | 102/3467 | 278/18723 | 5.07e-13 | 1.02e-10 | 102 |
| GO:00226132 | Colorectum | MSS | ribonucleoprotein complex biogenesis | 144/3467 | 463/18723 | 2.76e-11 | 3.67e-09 | 144 |
| GO:00442702 | Colorectum | MSS | cellular nitrogen compound catabolic process | 141/3467 | 451/18723 | 2.95e-11 | 3.83e-09 | 141 |
| GO:00467002 | Colorectum | MSS | heterocycle catabolic process | 139/3467 | 445/18723 | 4.37e-11 | 5.05e-09 | 139 |
| Page: 1 2 3 4 5 6 7 8 9 10 11 12 13 14 15 |
| Pathway ID | Tissue | Disease Stage | Description | Gene Ratio | Bg Ratio | pvalue | p.adjust | qvalue | Count |
| hsa0123023 | Esophagus | ESCC | Biosynthesis of amino acids | 49/4205 | 75/8465 | 4.35e-03 | 1.12e-02 | 5.74e-03 | 49 |
| hsa0123033 | Esophagus | ESCC | Biosynthesis of amino acids | 49/4205 | 75/8465 | 4.35e-03 | 1.12e-02 | 5.74e-03 | 49 |
| hsa0123021 | Liver | HCC | Biosynthesis of amino acids | 53/4020 | 75/8465 | 3.79e-05 | 2.11e-04 | 1.18e-04 | 53 |
| hsa006702 | Liver | HCC | One carbon pool by folate | 17/4020 | 20/8465 | 6.04e-04 | 2.50e-03 | 1.39e-03 | 17 |
| hsa002702 | Liver | HCC | Cysteine and methionine metabolism | 35/4020 | 52/8465 | 3.03e-03 | 9.94e-03 | 5.53e-03 | 35 |
| hsa0123031 | Liver | HCC | Biosynthesis of amino acids | 53/4020 | 75/8465 | 3.79e-05 | 2.11e-04 | 1.18e-04 | 53 |
| hsa0067011 | Liver | HCC | One carbon pool by folate | 17/4020 | 20/8465 | 6.04e-04 | 2.50e-03 | 1.39e-03 | 17 |
| hsa002703 | Liver | HCC | Cysteine and methionine metabolism | 35/4020 | 52/8465 | 3.03e-03 | 9.94e-03 | 5.53e-03 | 35 |
| Page: 1 |
Top |
Cell-cell communication analysis |
| Identification of potential cell-cell interactions between two cell types and their ligand-receptor pairs for different disease states |
| Ligand | Receptor | LRpair | Pathway | Tissue | Disease Stage |
| Page: 1 |
Top |
Single-cell gene regulatory network inference analysis |
| Find out the significant the regulons (TFs) and the target genes of each regulon across cell types for different disease states |
| TF | Cell Type | Tissue | Disease Stage | Target Gene | RSS | Regulon Activity |
| ∗The dot plots of a searched regulon are shown for all cell subpopulations in each disease state of each tissue based on the regulon specific score inferred using pySCENIC and by calculating the average expression. |
| Page: 1 |
Top |
Somatic mutation of malignant transformation related genes |
| Annotation of somatic variants for genes involved in malignant transformation |
| Hugo Symbol | Variant Class | Variant Classification | dbSNP RS | HGVSc | HGVSp | HGVSp Short | SWISSPROT | BIOTYPE | SIFT | PolyPhen | Tumor Sample Barcode | Tissue | Histology | Sex | Age | Stage | Therapy Types | Drugs | Outcome |
| MTR | SNV | Missense_Mutation | c.1733N>T | p.Ser578Phe | p.S578F | Q99707 | protein_coding | deleterious(0) | probably_damaging(1) | TCGA-A2-A0SX-01 | Breast | breast invasive carcinoma | Female | <65 | I/II | Chemotherapy | adriamycin | PD | |
| MTR | SNV | Missense_Mutation | c.1957N>A | p.Gln653Lys | p.Q653K | Q99707 | protein_coding | tolerated(0.58) | benign(0) | TCGA-A2-A0SX-01 | Breast | breast invasive carcinoma | Female | <65 | I/II | Chemotherapy | adriamycin | PD | |
| MTR | SNV | Missense_Mutation | rs866499126 | c.3481G>A | p.Ala1161Thr | p.A1161T | Q99707 | protein_coding | tolerated(0.1) | benign(0.001) | TCGA-A2-A4S1-01 | Breast | breast invasive carcinoma | Female | >=65 | I/II | Unknown | Unknown | SD |
| MTR | SNV | Missense_Mutation | c.10N>A | p.Ala4Thr | p.A4T | Q99707 | protein_coding | tolerated_low_confidence(0.88) | benign(0) | TCGA-B6-A0IN-01 | Breast | breast invasive carcinoma | Female | <65 | I/II | Unknown | Unknown | PD | |
| MTR | SNV | Missense_Mutation | c.1961G>C | p.Gly654Ala | p.G654A | Q99707 | protein_coding | tolerated(0.26) | benign(0.001) | TCGA-B6-A0RU-01 | Breast | breast invasive carcinoma | Female | <65 | I/II | Unknown | Unknown | PD | |
| MTR | insertion | In_Frame_Ins | novel | c.1162_1163insGCATCTTCCTAG | p.Lys388delinsSerIlePheLeuGlu | p.K388delinsSIFLE | Q99707 | protein_coding | TCGA-AN-A04C-01 | Breast | breast invasive carcinoma | Female | <65 | I/II | Unknown | Unknown | SD | ||
| MTR | insertion | Nonsense_Mutation | novel | c.1164_1165insAATTGTTTCTAAAATATTCTTGTTGTAAT | p.Leu389AsnfsTer4 | p.L389Nfs*4 | Q99707 | protein_coding | TCGA-AN-A04C-01 | Breast | breast invasive carcinoma | Female | <65 | I/II | Unknown | Unknown | SD | ||
| MTR | deletion | Frame_Shift_Del | novel | c.92delT | p.Met31ArgfsTer10 | p.M31Rfs*10 | Q99707 | protein_coding | TCGA-EW-A2FV-01 | Breast | breast invasive carcinoma | Female | <65 | III/IV | Chemotherapy | docetaxel | SD | ||
| MTR | SNV | Missense_Mutation | novel | c.461N>G | p.Ser154Cys | p.S154C | Q99707 | protein_coding | deleterious(0) | probably_damaging(1) | TCGA-EK-A2PM-01 | Cervix | cervical & endocervical cancer | Female | >=65 | I/II | Unknown | Unknown | SD |
| MTR | SNV | Missense_Mutation | c.1649N>C | p.His550Pro | p.H550P | Q99707 | protein_coding | deleterious(0) | probably_damaging(1) | TCGA-UC-A7PF-01 | Cervix | cervical & endocervical cancer | Female | <65 | I/II | Unknown | Unknown | SD |
| Page: 1 2 3 4 5 6 7 8 9 10 11 12 13 14 15 |
Top |
Related drugs of malignant transformation related genes |
| Identification of chemicals and drugs interact with genes involved in malignant transfromation |
| (DGIdb 4.0) |
| Entrez ID | Symbol | Category | Interaction Types | Drug Claim Name | Drug Name | PMIDs |
| 4548 | MTR | ENZYME, DRUGGABLE GENOME | ENZYME INHIBITOR | 15148588 | ||
| 4548 | MTR | ENZYME, DRUGGABLE GENOME | carboplatin | CARBOPLATIN | 21605004,29662106,19159907 | |
| 4548 | MTR | ENZYME, DRUGGABLE GENOME | benazepril | BENAZEPRIL | 15148588 | |
| 4548 | MTR | ENZYME, DRUGGABLE GENOME | cisplatin | CISPLATIN | 21605004,29662106,19159907 |
| Page: 1 |

Copyright 2023-Present -The University of Texas Health Science Center at Houston |