
|
|||||
|
 | |
| |
| |
| |
| |
| |
|
Gene: MTPAP |
Gene summary for MTPAP |
| Gene information | Species | Human | Gene symbol | MTPAP | Gene ID | 55149 |
| Gene name | mitochondrial poly(A) polymerase | |
| Gene Alias | PAPD1 | |
| Cytomap | 10p11.23 | |
| Gene Type | protein-coding | GO ID | GO:0000956 | UniProtAcc | Q9NVV4 |
Top |
Malignant transformation analysis |
| Identification of the aberrant gene expression in precancerous and cancerous lesions by comparing the gene expression of stem-like cells in diseased tissues with normal stem cells |
| Entrez ID | Symbol | Replicates | Species | Organ | Tissue | Adj P-value | Log2FC | Malignancy |
| 55149 | MTPAP | C04 | Human | Oral cavity | OSCC | 2.12e-05 | 4.01e-01 | 0.2633 |
| 55149 | MTPAP | C30 | Human | Oral cavity | OSCC | 1.42e-14 | 6.12e-01 | 0.3055 |
| 55149 | MTPAP | C38 | Human | Oral cavity | OSCC | 1.88e-03 | 5.71e-01 | 0.172 |
| 55149 | MTPAP | C43 | Human | Oral cavity | OSCC | 4.92e-04 | 1.24e-01 | 0.1704 |
| 55149 | MTPAP | C46 | Human | Oral cavity | OSCC | 9.70e-05 | 2.03e-01 | 0.1673 |
| 55149 | MTPAP | C57 | Human | Oral cavity | OSCC | 2.57e-02 | 2.35e-01 | 0.1679 |
| 55149 | MTPAP | C08 | Human | Oral cavity | OSCC | 1.52e-03 | 8.84e-02 | 0.1919 |
| 55149 | MTPAP | SYSMH1 | Human | Oral cavity | OSCC | 4.65e-03 | 6.35e-02 | 0.1127 |
| 55149 | MTPAP | SYSMH2 | Human | Oral cavity | OSCC | 2.60e-10 | 1.95e-01 | 0.2326 |
| 55149 | MTPAP | SYSMH3 | Human | Oral cavity | OSCC | 1.85e-12 | 3.11e-01 | 0.2442 |
| 55149 | MTPAP | SYSMH6 | Human | Oral cavity | OSCC | 1.76e-02 | 7.42e-02 | 0.1275 |
| Page: 1 |
| Tissue | Expression Dynamics | Abbreviation |
| Oral Cavity | 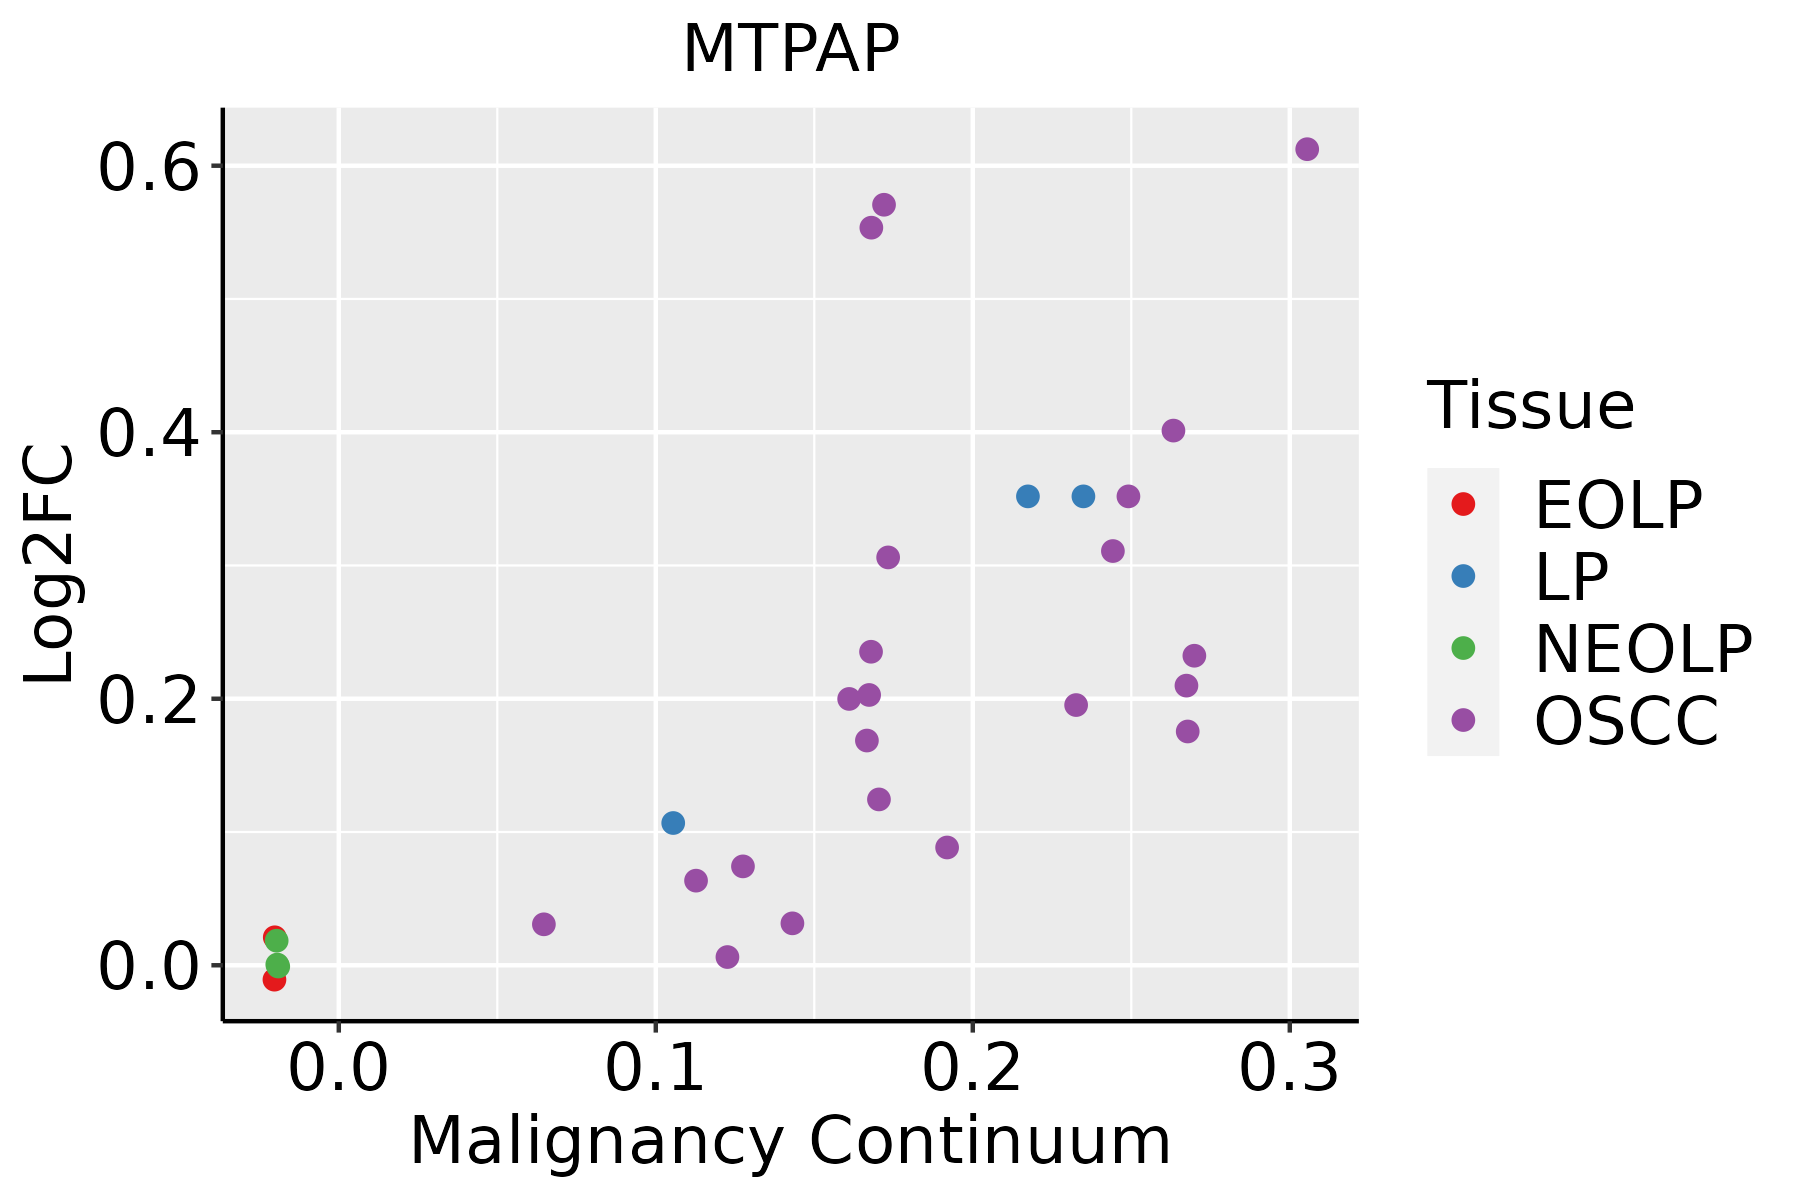 | EOLP: Erosive Oral lichen planus |
| LP: leukoplakia | ||
| NEOLP: Non-erosive oral lichen planus | ||
| OSCC: Oral squamous cell carcinoma |
| ∗log2FC in expression of this searched gene in stem-like cells from each diseased tissue sample relative to stem-like cells in normal samples in each tissue plotted against the malignancy continuum. Samples are colored based on if they are from different disease stage. |
Top |
Malignant transformation related pathway analysis |
| Find out the enriched GO biological processes and KEGG pathways involved in transition from healthy to precancer to cancer |
| Tissue | Disease Stage | Enriched GO biological Processes |
| Colorectum | AD |  |
| Colorectum | SER |  |
| Colorectum | MSS |  |
| Colorectum | MSI-H |  |
| Colorectum | FAP |  |
| ∗Top 15 enriched GO BP terms are showed in the bar plot of each disease state in each tissue. Each row represents a significant GO biological process which is colored according to the -log10(p.adjust). |
| Page: 1 2 3 4 5 6 7 8 9 |
| GO ID | Tissue | Disease Stage | Description | Gene Ratio | Bg Ratio | pvalue | p.adjust | Count |
| GO:000640118 | Oral cavity | OSCC | RNA catabolic process | 184/7305 | 278/18723 | 2.71e-20 | 4.19e-18 | 184 |
| GO:000640218 | Oral cavity | OSCC | mRNA catabolic process | 156/7305 | 232/18723 | 2.13e-18 | 2.37e-16 | 156 |
| GO:003465517 | Oral cavity | OSCC | nucleobase-containing compound catabolic process | 244/7305 | 407/18723 | 5.38e-18 | 5.49e-16 | 244 |
| GO:004670015 | Oral cavity | OSCC | heterocycle catabolic process | 254/7305 | 445/18723 | 5.07e-15 | 3.31e-13 | 254 |
| GO:004427016 | Oral cavity | OSCC | cellular nitrogen compound catabolic process | 256/7305 | 451/18723 | 9.67e-15 | 5.88e-13 | 256 |
| GO:001943915 | Oral cavity | OSCC | aromatic compound catabolic process | 263/7305 | 467/18723 | 1.49e-14 | 8.84e-13 | 263 |
| GO:190136115 | Oral cavity | OSCC | organic cyclic compound catabolic process | 272/7305 | 495/18723 | 2.73e-13 | 1.36e-11 | 272 |
| GO:000095610 | Oral cavity | OSCC | nuclear-transcribed mRNA catabolic process | 81/7305 | 112/18723 | 7.95e-13 | 3.70e-11 | 81 |
| GO:00311242 | Oral cavity | OSCC | mRNA 3'-end processing | 49/7305 | 62/18723 | 1.40e-10 | 4.14e-09 | 49 |
| GO:00311232 | Oral cavity | OSCC | RNA 3'-end processing | 75/7305 | 116/18723 | 1.93e-08 | 3.79e-07 | 75 |
| GO:00063782 | Oral cavity | OSCC | mRNA polyadenylation | 34/7305 | 44/18723 | 2.63e-07 | 4.10e-06 | 34 |
| GO:00436312 | Oral cavity | OSCC | RNA polyadenylation | 34/7305 | 45/18723 | 6.73e-07 | 9.53e-06 | 34 |
| GO:00083341 | Oral cavity | OSCC | histone mRNA metabolic process | 12/7305 | 17/18723 | 8.40e-03 | 3.05e-02 | 12 |
| Page: 1 |
| Pathway ID | Tissue | Disease Stage | Description | Gene Ratio | Bg Ratio | pvalue | p.adjust | qvalue | Count |
| Page: 1 |
Top |
Cell-cell communication analysis |
| Identification of potential cell-cell interactions between two cell types and their ligand-receptor pairs for different disease states |
| Ligand | Receptor | LRpair | Pathway | Tissue | Disease Stage |
| Page: 1 |
Top |
Single-cell gene regulatory network inference analysis |
| Find out the significant the regulons (TFs) and the target genes of each regulon across cell types for different disease states |
| TF | Cell Type | Tissue | Disease Stage | Target Gene | RSS | Regulon Activity |
| ∗The dot plots of a searched regulon are shown for all cell subpopulations in each disease state of each tissue based on the regulon specific score inferred using pySCENIC and by calculating the average expression. |
| Page: 1 |
Top |
Somatic mutation of malignant transformation related genes |
| Annotation of somatic variants for genes involved in malignant transformation |
| Hugo Symbol | Variant Class | Variant Classification | dbSNP RS | HGVSc | HGVSp | HGVSp Short | SWISSPROT | BIOTYPE | SIFT | PolyPhen | Tumor Sample Barcode | Tissue | Histology | Sex | Age | Stage | Therapy Types | Drugs | Outcome |
| MTPAP | SNV | Missense_Mutation | c.1675N>C | p.Glu559Gln | p.E559Q | Q9NVV4 | protein_coding | tolerated(0.09) | benign(0.189) | TCGA-A2-A25A-01 | Breast | breast invasive carcinoma | Female | <65 | I/II | Unspecific | Cytoxan | SD | |
| MTPAP | SNV | Missense_Mutation | c.1420C>G | p.Leu474Val | p.L474V | Q9NVV4 | protein_coding | deleterious(0) | probably_damaging(0.929) | TCGA-C8-A1HM-01 | Breast | breast invasive carcinoma | Female | >=65 | I/II | Chemotherapy | doxorubicin | CR | |
| MTPAP | insertion | Nonsense_Mutation | novel | c.19_20insATTTATAAAATTGTCTCTTGAAACTGAGGA | p.Gly7delinsAspLeuTerAsnCysLeuLeuLysLeuArgArg | p.G7delinsDL*NCLLKLRR | Q9NVV4 | protein_coding | TCGA-A2-A0D1-01 | Breast | breast invasive carcinoma | Female | >=65 | I/II | Chemotherapy | taxotere | SD | ||
| MTPAP | insertion | Frame_Shift_Ins | novel | c.1016_1017insAGGG | p.Leu340GlyfsTer31 | p.L340Gfs*31 | Q9NVV4 | protein_coding | TCGA-A8-A07U-01 | Breast | breast invasive carcinoma | Female | >=65 | III/IV | Chemotherapy | 5-fluorouracil | SD | ||
| MTPAP | insertion | Nonsense_Mutation | novel | c.1009_1010insGATACAAAGAAAA | p.Ser337Ter | p.S337* | Q9NVV4 | protein_coding | TCGA-AR-A0U0-01 | Breast | breast invasive carcinoma | Female | >=65 | I/II | Unknown | Unknown | SD | ||
| MTPAP | insertion | Frame_Shift_Ins | novel | c.1287_1288insA | p.Pro430ThrfsTer17 | p.P430Tfs*17 | Q9NVV4 | protein_coding | TCGA-E9-A2JS-01 | Breast | breast invasive carcinoma | Female | >=65 | I/II | Chemotherapy | cyclophosphamide | PD | ||
| MTPAP | SNV | Missense_Mutation | novel | c.606G>T | p.Glu202Asp | p.E202D | Q9NVV4 | protein_coding | deleterious(0.01) | probably_damaging(0.946) | TCGA-2W-A8YY-01 | Cervix | cervical & endocervical cancer | Female | <65 | I/II | Chemotherapy | cisplatin | CR |
| MTPAP | SNV | Missense_Mutation | c.827C>T | p.Ser276Leu | p.S276L | Q9NVV4 | protein_coding | deleterious(0) | possibly_damaging(0.714) | TCGA-R2-A69V-01 | Cervix | cervical & endocervical cancer | Female | <65 | I/II | Chemotherapy | cisplatin | SD | |
| MTPAP | SNV | Missense_Mutation | c.740N>G | p.Phe247Cys | p.F247C | Q9NVV4 | protein_coding | deleterious(0) | benign(0.269) | TCGA-AA-3854-01 | Colorectum | colon adenocarcinoma | Female | >=65 | I/II | Unknown | Unknown | SD | |
| MTPAP | SNV | Missense_Mutation | novel | c.562G>A | p.Asp188Asn | p.D188N | Q9NVV4 | protein_coding | tolerated(0.15) | benign(0.009) | TCGA-AA-3877-01 | Colorectum | colon adenocarcinoma | Female | >=65 | I/II | Unknown | Unknown | SD |
| Page: 1 2 3 4 5 6 7 8 |
Top |
Related drugs of malignant transformation related genes |
| Identification of chemicals and drugs interact with genes involved in malignant transfromation |
| (DGIdb 4.0) |
| Entrez ID | Symbol | Category | Interaction Types | Drug Claim Name | Drug Name | PMIDs |
| Page: 1 |

Copyright 2023-Present -The University of Texas Health Science Center at Houston |