
|
|||||
|
 | |
| |
| |
| |
| |
| |
|
Gene: MTMR3 |
Gene summary for MTMR3 |
| Gene information | Species | Human | Gene symbol | MTMR3 | Gene ID | 8897 |
| Gene name | myotubularin related protein 3 | |
| Gene Alias | FYVE-DSP1 | |
| Cytomap | 22q12.2 | |
| Gene Type | protein-coding | GO ID | GO:0000045 | UniProtAcc | Q13615 |
Top |
Malignant transformation analysis |
| Identification of the aberrant gene expression in precancerous and cancerous lesions by comparing the gene expression of stem-like cells in diseased tissues with normal stem cells |
| Entrez ID | Symbol | Replicates | Species | Organ | Tissue | Adj P-value | Log2FC | Malignancy |
| 8897 | MTMR3 | CCI_1 | Human | Cervix | CC | 1.42e-03 | 8.62e-01 | 0.528 |
| 8897 | MTMR3 | CCI_2 | Human | Cervix | CC | 2.58e-08 | 8.59e-01 | 0.5249 |
| 8897 | MTMR3 | CCI_3 | Human | Cervix | CC | 2.72e-18 | 1.03e+00 | 0.516 |
| 8897 | MTMR3 | CCII_1 | Human | Cervix | CC | 3.21e-02 | 2.65e-01 | 0.3249 |
| 8897 | MTMR3 | HTA11_3410_2000001011 | Human | Colorectum | AD | 4.48e-21 | -7.02e-01 | 0.0155 |
| 8897 | MTMR3 | HTA11_2487_2000001011 | Human | Colorectum | SER | 3.33e-07 | -5.93e-01 | -0.1808 |
| 8897 | MTMR3 | HTA11_1938_2000001011 | Human | Colorectum | AD | 1.75e-03 | -5.23e-01 | -0.0811 |
| 8897 | MTMR3 | HTA11_78_2000001011 | Human | Colorectum | AD | 7.08e-03 | -4.74e-01 | -0.1088 |
| 8897 | MTMR3 | HTA11_3361_2000001011 | Human | Colorectum | AD | 1.99e-04 | -5.64e-01 | -0.1207 |
| 8897 | MTMR3 | HTA11_696_2000001011 | Human | Colorectum | AD | 8.00e-12 | -4.94e-01 | -0.1464 |
| 8897 | MTMR3 | HTA11_866_2000001011 | Human | Colorectum | AD | 2.91e-12 | -4.44e-01 | -0.1001 |
| 8897 | MTMR3 | HTA11_1391_2000001011 | Human | Colorectum | AD | 1.46e-06 | -4.90e-01 | -0.059 |
| 8897 | MTMR3 | HTA11_866_3004761011 | Human | Colorectum | AD | 1.71e-13 | -6.40e-01 | 0.096 |
| 8897 | MTMR3 | HTA11_8622_2000001021 | Human | Colorectum | SER | 1.89e-03 | -6.82e-01 | 0.0528 |
| 8897 | MTMR3 | HTA11_10711_2000001011 | Human | Colorectum | AD | 1.20e-08 | -6.16e-01 | 0.0338 |
| 8897 | MTMR3 | HTA11_7696_3000711011 | Human | Colorectum | AD | 8.82e-21 | -6.15e-01 | 0.0674 |
| 8897 | MTMR3 | HTA11_6818_2000001021 | Human | Colorectum | AD | 1.46e-09 | -7.18e-01 | 0.0588 |
| 8897 | MTMR3 | HTA11_99999970781_79442 | Human | Colorectum | MSS | 1.48e-27 | -6.47e-01 | 0.294 |
| 8897 | MTMR3 | HTA11_99999965104_69814 | Human | Colorectum | MSS | 9.27e-04 | -5.22e-01 | 0.281 |
| 8897 | MTMR3 | HTA11_99999971662_82457 | Human | Colorectum | MSS | 2.45e-24 | -6.34e-01 | 0.3859 |
| Page: 1 2 3 4 5 6 7 |
| Tissue | Expression Dynamics | Abbreviation |
| Cervix | 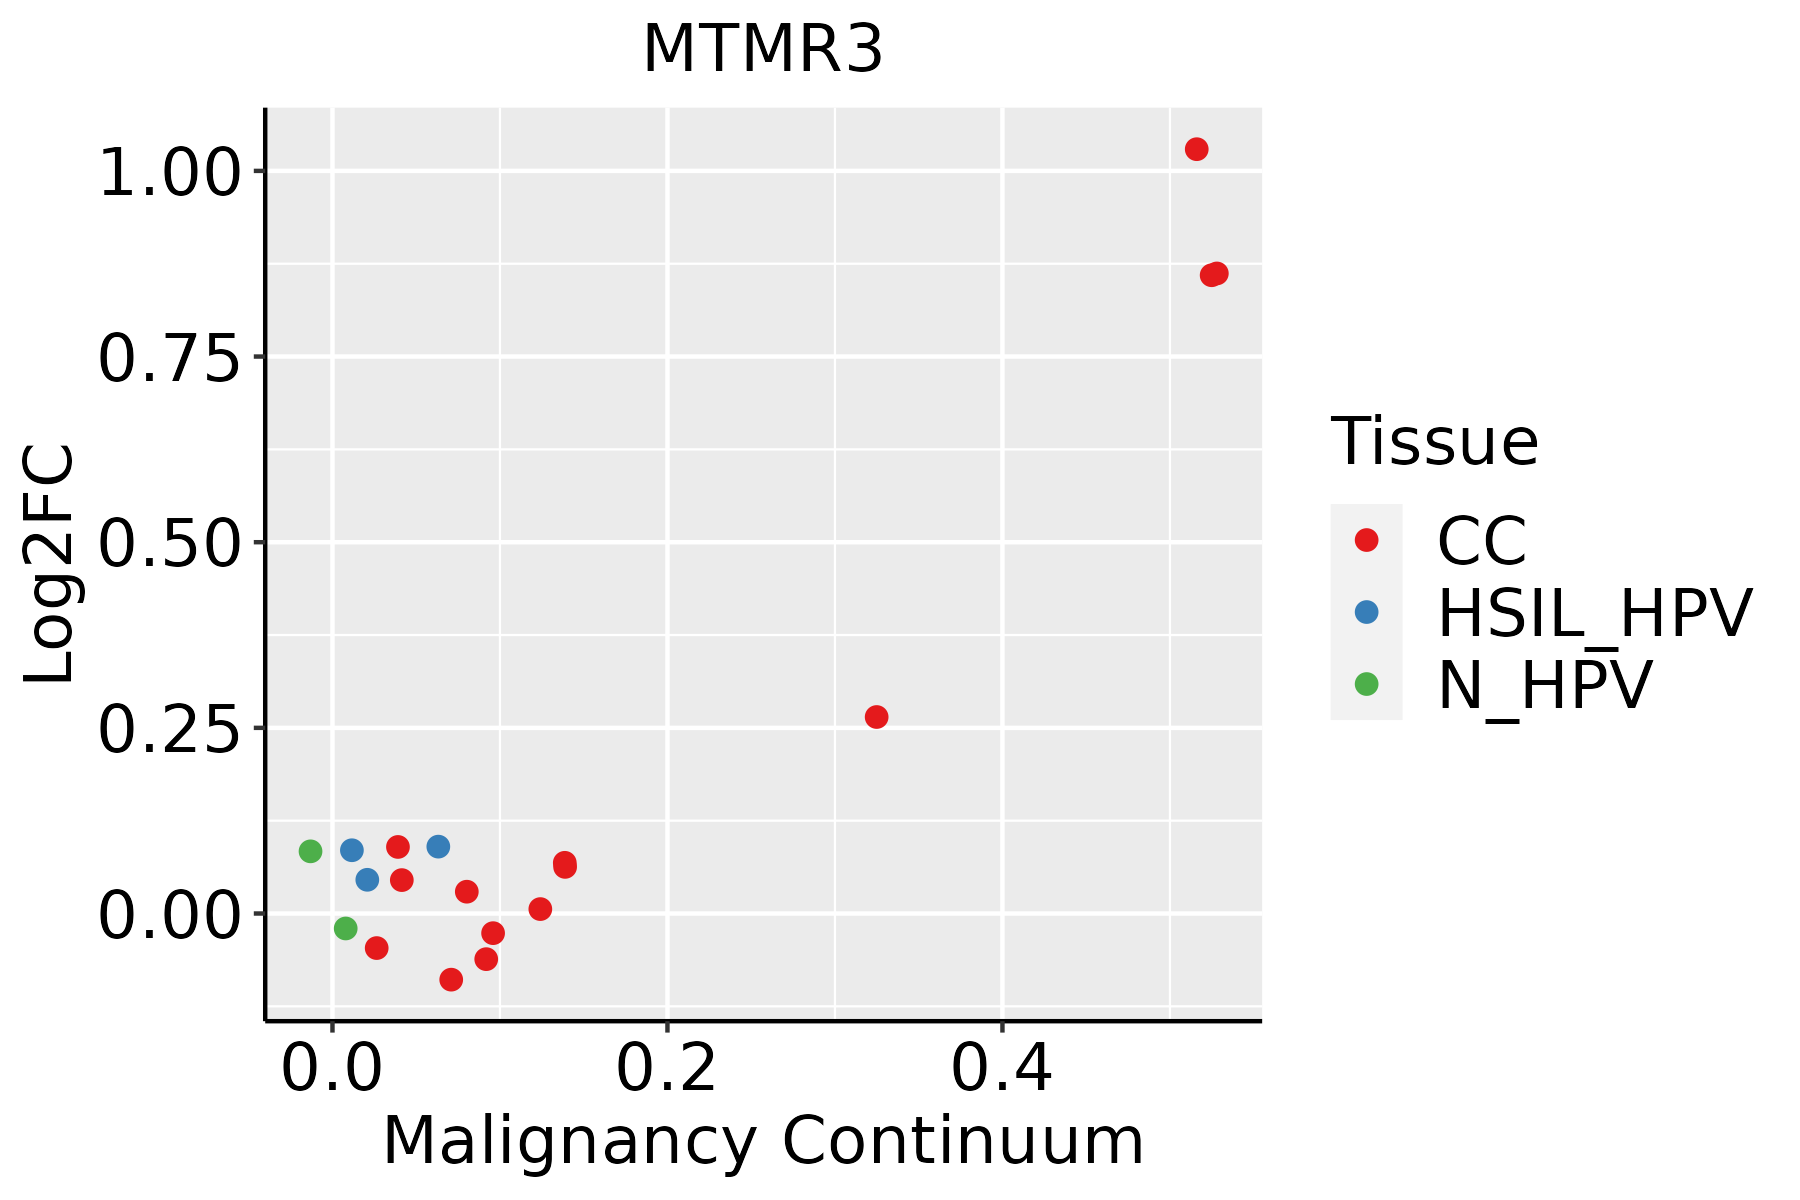 | CC: Cervix cancer |
| HSIL_HPV: HPV-infected high-grade squamous intraepithelial lesions | ||
| N_HPV: HPV-infected normal cervix | ||
| Colorectum (GSE201348) |  | FAP: Familial adenomatous polyposis |
| CRC: Colorectal cancer | ||
| Colorectum (HTA11) | 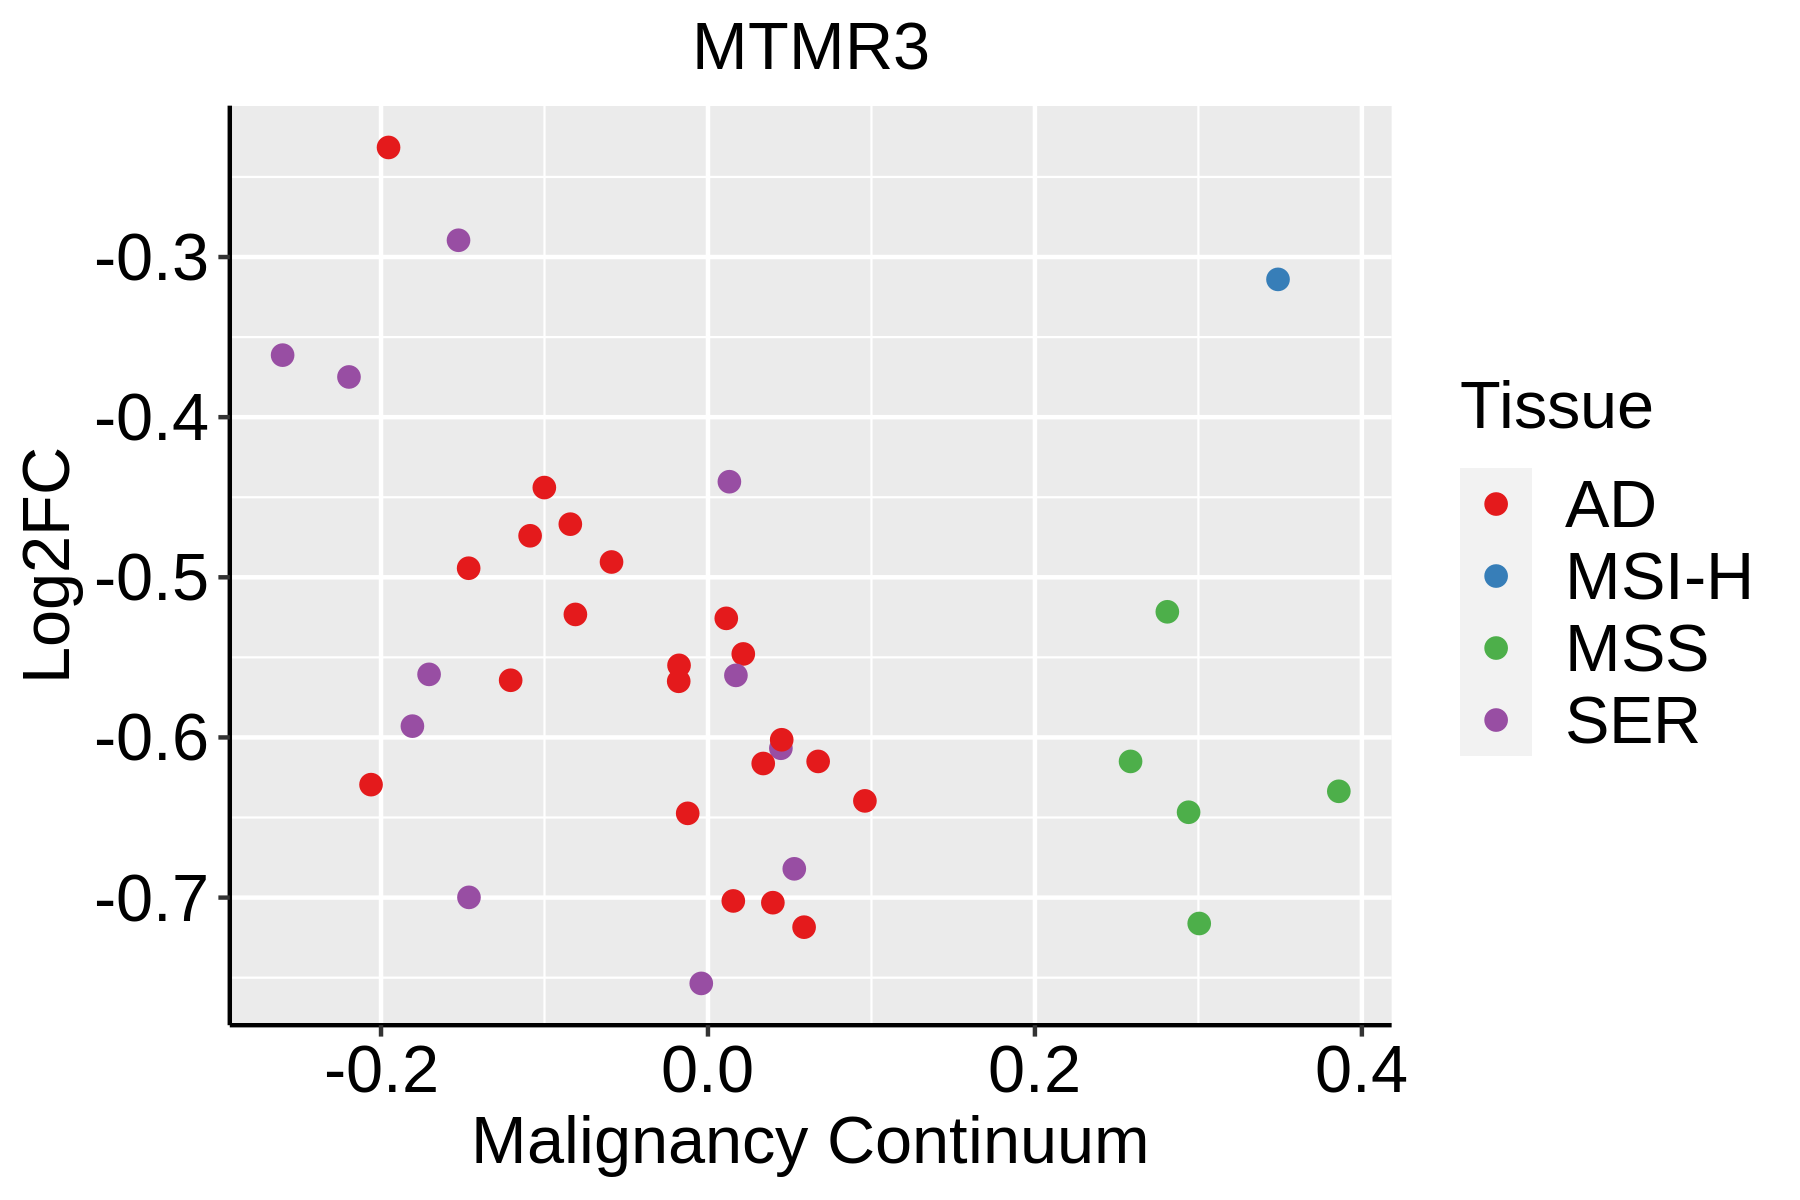 | AD: Adenomas |
| SER: Sessile serrated lesions | ||
| MSI-H: Microsatellite-high colorectal cancer | ||
| MSS: Microsatellite stable colorectal cancer | ||
| Esophagus | 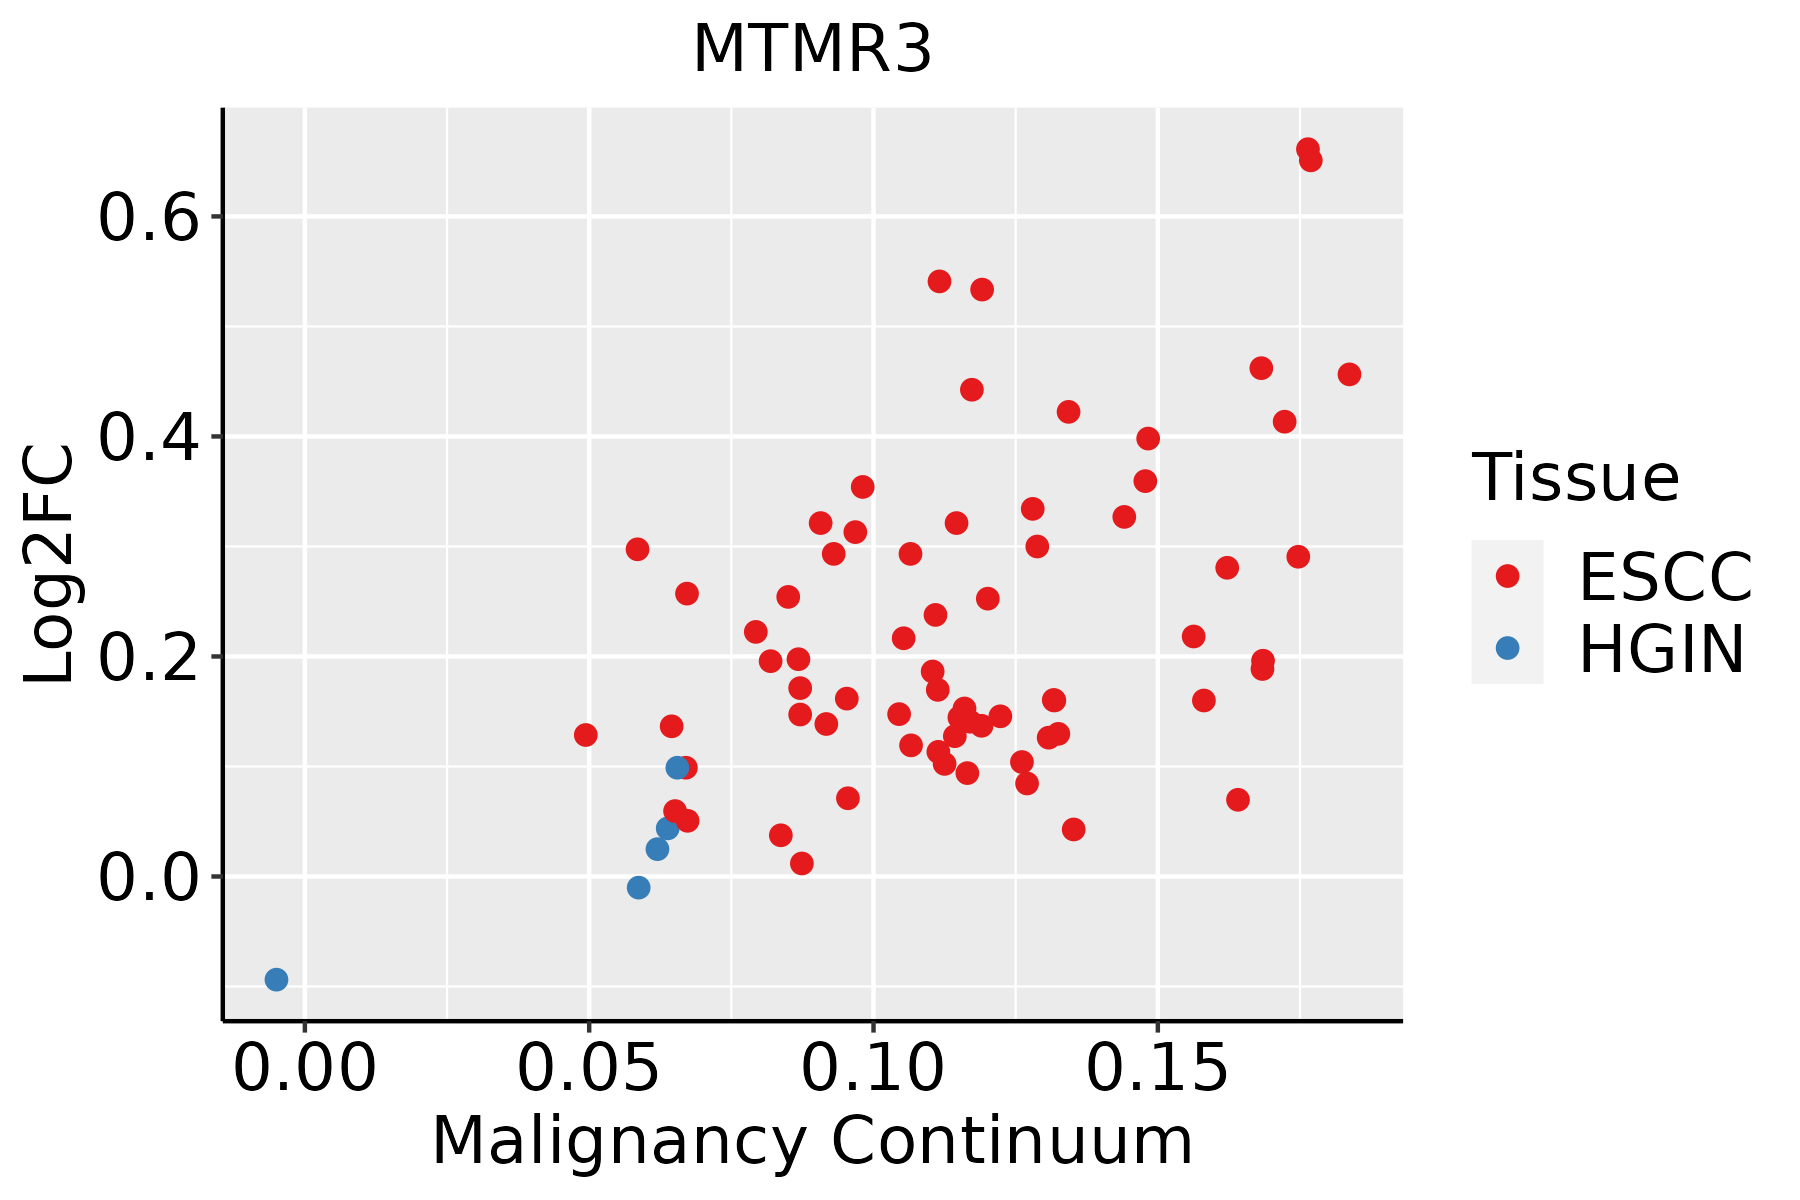 | ESCC: Esophageal squamous cell carcinoma |
| HGIN: High-grade intraepithelial neoplasias | ||
| LGIN: Low-grade intraepithelial neoplasias | ||
| Lung |  | AAH: Atypical adenomatous hyperplasia |
| AIS: Adenocarcinoma in situ | ||
| IAC: Invasive lung adenocarcinoma | ||
| MIA: Minimally invasive adenocarcinoma |
| ∗log2FC in expression of this searched gene in stem-like cells from each diseased tissue sample relative to stem-like cells in normal samples in each tissue plotted against the malignancy continuum. Samples are colored based on if they are from different disease stage. |
Top |
Malignant transformation related pathway analysis |
| Find out the enriched GO biological processes and KEGG pathways involved in transition from healthy to precancer to cancer |
| Tissue | Disease Stage | Enriched GO biological Processes |
| Colorectum | AD |  |
| Colorectum | SER |  |
| Colorectum | MSS |  |
| Colorectum | MSI-H |  |
| Colorectum | FAP |  |
| ∗Top 15 enriched GO BP terms are showed in the bar plot of each disease state in each tissue. Each row represents a significant GO biological process which is colored according to the -log10(p.adjust). |
| Page: 1 2 3 4 5 6 7 8 9 |
| GO ID | Tissue | Disease Stage | Description | Gene Ratio | Bg Ratio | pvalue | p.adjust | Count |
| GO:007149610 | Cervix | CC | cellular response to external stimulus | 78/2311 | 320/18723 | 1.82e-09 | 1.98e-07 | 78 |
| GO:00316689 | Cervix | CC | cellular response to extracellular stimulus | 59/2311 | 246/18723 | 3.03e-07 | 1.24e-05 | 59 |
| GO:003166710 | Cervix | CC | response to nutrient levels | 92/2311 | 474/18723 | 5.80e-06 | 1.42e-04 | 92 |
| GO:00092678 | Cervix | CC | cellular response to starvation | 39/2311 | 156/18723 | 1.04e-05 | 2.32e-04 | 39 |
| GO:00425948 | Cervix | CC | response to starvation | 46/2311 | 197/18723 | 1.24e-05 | 2.59e-04 | 46 |
| GO:00316698 | Cervix | CC | cellular response to nutrient levels | 49/2311 | 215/18723 | 1.32e-05 | 2.68e-04 | 49 |
| GO:00064708 | Cervix | CC | protein dephosphorylation | 60/2311 | 281/18723 | 1.33e-05 | 2.68e-04 | 60 |
| GO:00162367 | Cervix | CC | macroautophagy | 58/2311 | 291/18723 | 1.40e-04 | 1.70e-03 | 58 |
| GO:003530310 | Cervix | CC | regulation of dephosphorylation | 31/2311 | 128/18723 | 1.52e-04 | 1.83e-03 | 31 |
| GO:00105067 | Cervix | CC | regulation of autophagy | 61/2311 | 317/18723 | 2.61e-04 | 2.87e-03 | 61 |
| GO:19021153 | Cervix | CC | regulation of organelle assembly | 40/2311 | 186/18723 | 2.92e-04 | 3.15e-03 | 40 |
| GO:00163117 | Cervix | CC | dephosphorylation | 73/2311 | 417/18723 | 1.23e-03 | 9.87e-03 | 73 |
| GO:00000452 | Cervix | CC | autophagosome assembly | 21/2311 | 99/18723 | 8.67e-03 | 4.46e-02 | 21 |
| GO:0010506 | Colorectum | AD | regulation of autophagy | 111/3918 | 317/18723 | 3.57e-09 | 2.35e-07 | 111 |
| GO:0016236 | Colorectum | AD | macroautophagy | 103/3918 | 291/18723 | 6.76e-09 | 4.15e-07 | 103 |
| GO:0031667 | Colorectum | AD | response to nutrient levels | 138/3918 | 474/18723 | 1.22e-05 | 2.68e-04 | 138 |
| GO:0016311 | Colorectum | AD | dephosphorylation | 123/3918 | 417/18723 | 1.84e-05 | 3.82e-04 | 123 |
| GO:0006470 | Colorectum | AD | protein dephosphorylation | 88/3918 | 281/18723 | 2.56e-05 | 4.89e-04 | 88 |
| GO:0035303 | Colorectum | AD | regulation of dephosphorylation | 46/3918 | 128/18723 | 6.20e-05 | 1.04e-03 | 46 |
| GO:0030258 | Colorectum | AD | lipid modification | 67/3918 | 212/18723 | 1.66e-04 | 2.27e-03 | 67 |
| Page: 1 2 3 4 5 6 7 |
| Pathway ID | Tissue | Disease Stage | Description | Gene Ratio | Bg Ratio | pvalue | p.adjust | qvalue | Count |
| hsa04140 | Colorectum | AD | Autophagy - animal | 49/2092 | 141/8465 | 4.58e-03 | 2.20e-02 | 1.40e-02 | 49 |
| hsa041401 | Colorectum | AD | Autophagy - animal | 49/2092 | 141/8465 | 4.58e-03 | 2.20e-02 | 1.40e-02 | 49 |
| hsa041402 | Colorectum | SER | Autophagy - animal | 39/1580 | 141/8465 | 5.43e-03 | 3.28e-02 | 2.38e-02 | 39 |
| hsa041403 | Colorectum | SER | Autophagy - animal | 39/1580 | 141/8465 | 5.43e-03 | 3.28e-02 | 2.38e-02 | 39 |
| hsa041404 | Colorectum | MSS | Autophagy - animal | 45/1875 | 141/8465 | 4.42e-03 | 1.90e-02 | 1.16e-02 | 45 |
| hsa041405 | Colorectum | MSS | Autophagy - animal | 45/1875 | 141/8465 | 4.42e-03 | 1.90e-02 | 1.16e-02 | 45 |
| hsa04070 | Colorectum | CRC | Phosphatidylinositol signaling system | 25/1091 | 97/8465 | 4.27e-04 | 4.60e-03 | 3.12e-03 | 25 |
| hsa00562 | Colorectum | CRC | Inositol phosphate metabolism | 18/1091 | 73/8465 | 4.38e-03 | 2.52e-02 | 1.71e-02 | 18 |
| hsa040701 | Colorectum | CRC | Phosphatidylinositol signaling system | 25/1091 | 97/8465 | 4.27e-04 | 4.60e-03 | 3.12e-03 | 25 |
| hsa005621 | Colorectum | CRC | Inositol phosphate metabolism | 18/1091 | 73/8465 | 4.38e-03 | 2.52e-02 | 1.71e-02 | 18 |
| hsa0414010 | Esophagus | ESCC | Autophagy - animal | 101/4205 | 141/8465 | 7.60e-08 | 6.21e-07 | 3.18e-07 | 101 |
| hsa0414015 | Esophagus | ESCC | Autophagy - animal | 101/4205 | 141/8465 | 7.60e-08 | 6.21e-07 | 3.18e-07 | 101 |
| hsa041407 | Lung | IAC | Autophagy - animal | 28/1053 | 141/8465 | 7.64e-03 | 3.03e-02 | 2.01e-02 | 28 |
| hsa0414012 | Lung | IAC | Autophagy - animal | 28/1053 | 141/8465 | 7.64e-03 | 3.03e-02 | 2.01e-02 | 28 |
| hsa0414022 | Lung | AIS | Autophagy - animal | 26/961 | 141/8465 | 8.23e-03 | 3.71e-02 | 2.37e-02 | 26 |
| hsa0414032 | Lung | AIS | Autophagy - animal | 26/961 | 141/8465 | 8.23e-03 | 3.71e-02 | 2.37e-02 | 26 |
| Page: 1 |
Top |
Cell-cell communication analysis |
| Identification of potential cell-cell interactions between two cell types and their ligand-receptor pairs for different disease states |
| Ligand | Receptor | LRpair | Pathway | Tissue | Disease Stage |
| Page: 1 |
Top |
Single-cell gene regulatory network inference analysis |
| Find out the significant the regulons (TFs) and the target genes of each regulon across cell types for different disease states |
| TF | Cell Type | Tissue | Disease Stage | Target Gene | RSS | Regulon Activity |
| ∗The dot plots of a searched regulon are shown for all cell subpopulations in each disease state of each tissue based on the regulon specific score inferred using pySCENIC and by calculating the average expression. |
| Page: 1 |
Top |
Somatic mutation of malignant transformation related genes |
| Annotation of somatic variants for genes involved in malignant transformation |
| Hugo Symbol | Variant Class | Variant Classification | dbSNP RS | HGVSc | HGVSp | HGVSp Short | SWISSPROT | BIOTYPE | SIFT | PolyPhen | Tumor Sample Barcode | Tissue | Histology | Sex | Age | Stage | Therapy Types | Drugs | Outcome |
| MTMR3 | SNV | Missense_Mutation | novel | c.1646N>C | p.Asn549Thr | p.N549T | Q13615 | protein_coding | deleterious(0) | probably_damaging(0.998) | TCGA-D8-A1JA-01 | Breast | breast invasive carcinoma | Female | <65 | III/IV | Chemotherapy | adriamycin | PD |
| MTMR3 | SNV | Missense_Mutation | c.2074A>G | p.Ile692Val | p.I692V | Q13615 | protein_coding | tolerated(0.06) | possibly_damaging(0.569) | TCGA-D8-A1XK-01 | Breast | breast invasive carcinoma | Female | <65 | I/II | Chemotherapy | doxorubicine+cyclophosphamide | SD | |
| MTMR3 | SNV | Missense_Mutation | c.2170G>A | p.Glu724Lys | p.E724K | Q13615 | protein_coding | tolerated_low_confidence(0.35) | benign(0.01) | TCGA-E2-A10C-01 | Breast | breast invasive carcinoma | Female | <65 | I/II | Chemotherapy | cytoxan | SD | |
| MTMR3 | SNV | Missense_Mutation | novel | c.1067G>A | p.Arg356Gln | p.R356Q | Q13615 | protein_coding | deleterious(0.01) | probably_damaging(0.956) | TCGA-OL-A5RZ-01 | Breast | breast invasive carcinoma | Female | <65 | I/II | Chemotherapy | doxorubicin | CR |
| MTMR3 | insertion | Frame_Shift_Ins | novel | c.2329_2330insAACCTACTGTATTCCTCTCAGTCAGAAGCCGTAT | p.Ser777LysfsTer40 | p.S777Kfs*40 | Q13615 | protein_coding | TCGA-BH-A0E7-01 | Breast | breast invasive carcinoma | Female | >=65 | I/II | Hormone Therapy | arimidex | SD | ||
| MTMR3 | insertion | Frame_Shift_Ins | novel | c.2247_2248insGTGTTTCTCAGTGGATGGCAAAGTAGCA | p.Leu750ValfsTer27 | p.L750Vfs*27 | Q13615 | protein_coding | TCGA-E9-A1NI-01 | Breast | breast invasive carcinoma | Female | <65 | I/II | Chemotherapy | doxorubicin | CR | ||
| MTMR3 | deletion | Frame_Shift_Del | novel | c.2061delG | p.Gln688ArgfsTer16 | p.Q688Rfs*16 | Q13615 | protein_coding | TCGA-EW-A2FV-01 | Breast | breast invasive carcinoma | Female | <65 | III/IV | Chemotherapy | docetaxel | SD | ||
| MTMR3 | SNV | Missense_Mutation | c.1835N>C | p.Arg612Thr | p.R612T | Q13615 | protein_coding | deleterious(0) | probably_damaging(0.98) | TCGA-EK-A2R7-01 | Cervix | cervical & endocervical cancer | Female | <65 | I/II | Unknown | Unknown | SD | |
| MTMR3 | SNV | Missense_Mutation | c.1819C>T | p.Arg607Trp | p.R607W | Q13615 | protein_coding | deleterious(0) | probably_damaging(0.987) | TCGA-Q1-A5R2-01 | Cervix | cervical & endocervical cancer | Female | <65 | I/II | Chemotherapy | cisplatin | PR | |
| MTMR3 | SNV | Missense_Mutation | rs755680177 | c.2875N>A | p.Ala959Thr | p.A959T | Q13615 | protein_coding | tolerated_low_confidence(0.32) | benign(0) | TCGA-AA-3663-01 | Colorectum | colon adenocarcinoma | Male | <65 | I/II | Unknown | Unknown | SD |
| Page: 1 2 3 4 5 6 7 8 9 |
Top |
Related drugs of malignant transformation related genes |
| Identification of chemicals and drugs interact with genes involved in malignant transfromation |
| (DGIdb 4.0) |
| Entrez ID | Symbol | Category | Interaction Types | Drug Claim Name | Drug Name | PMIDs |
| Page: 1 |

Copyright 2023-Present -The University of Texas Health Science Center at Houston |