Schematic overview of the cellular and molecular mechanisms involved in the cancer progression, including the proposed cellular and molecular mechanisms in cancer cells trajectory. AT1: alveolar type 1 cells; AT2: alveolar type 2 cells; AAH: atypical adenomatous hyperplasia; AIS: adenocarcinoma in situ; MIA: minimally invasive adenocarcinoma; IA: invasive adenocarcinoma; EMT: epithelial-mesenchymal transition

Home

Download

Statistics

Help

Contact

Center for Computational Systems Medicine
leaf

Gene summary

leaf

Malignant transformation analysis

leaf

Malignant transformation related pathway analysis

leaf

Cell-cell communication analysis

leaf

Single-cell gene regulatory network inference analysis

leaf

Somatic mutation of malignant transformation related genes

leaf

Related drugs of malignant transformation related genes

Gene: MTMR2

Gene summary for MTMR2

check button Gene summary.

Gene informationSpeciesHuman
Gene symbol

MTMR2

Gene ID

8898

Gene namemyotubularin related protein 2
Gene AliasCMT4B
Cytomap11q21
Gene Typeprotein-coding
GO ID

GO:0002090

UniProtAcc

A0A024R3B7


Top

Malignant transformation analysis

check button Identification of the aberrant gene expression in precancerous and cancerous lesions by comparing the gene expression of stem-like cells in diseased tissues with normal stem cells
check button Malignant transformation involving gene list.
Entrez IDSymbolReplicatesSpeciesOrganTissueAdj P-valueLog2FCMalignancy
8898MTMR2LZE4THumanEsophagusESCC3.61e-031.55e-010.0811
8898MTMR2LZE7THumanEsophagusESCC4.47e-041.81e-010.0667
8898MTMR2LZE24THumanEsophagusESCC3.76e-073.35e-010.0596
8898MTMR2P2T-EHumanEsophagusESCC1.54e-201.99e-010.1177
8898MTMR2P4T-EHumanEsophagusESCC2.27e-245.42e-010.1323
8898MTMR2P5T-EHumanEsophagusESCC2.81e-142.05e-010.1327
8898MTMR2P8T-EHumanEsophagusESCC1.56e-106.75e-020.0889
8898MTMR2P9T-EHumanEsophagusESCC5.38e-051.73e-010.1131
8898MTMR2P10T-EHumanEsophagusESCC3.00e-192.03e-010.116
8898MTMR2P11T-EHumanEsophagusESCC4.45e-063.85e-010.1426
8898MTMR2P12T-EHumanEsophagusESCC7.26e-193.45e-010.1122
8898MTMR2P15T-EHumanEsophagusESCC8.24e-122.27e-010.1149
8898MTMR2P16T-EHumanEsophagusESCC3.81e-133.48e-010.1153
8898MTMR2P17T-EHumanEsophagusESCC1.72e-073.33e-010.1278
8898MTMR2P19T-EHumanEsophagusESCC9.85e-104.78e-010.1662
8898MTMR2P20T-EHumanEsophagusESCC5.48e-121.71e-010.1124
8898MTMR2P21T-EHumanEsophagusESCC1.92e-234.25e-010.1617
8898MTMR2P22T-EHumanEsophagusESCC2.68e-121.66e-010.1236
8898MTMR2P23T-EHumanEsophagusESCC1.22e-071.95e-010.108
8898MTMR2P24T-EHumanEsophagusESCC7.85e-082.02e-010.1287
Page: 1 2 3 4 

check button Transcriptomic changes along malignancy continuum.
TissueExpression DynamicsAbbreviation
EsophagusThe image shows the transcriptomic changes along malignancy continuum.log2FC in expression of this searched gene in stem-like cells from each diseased tissue sample relative to stem-like cells in normal samples in each tissue plotted against the malignancy continuum. Samples are colored based on if they are from different disease stage.
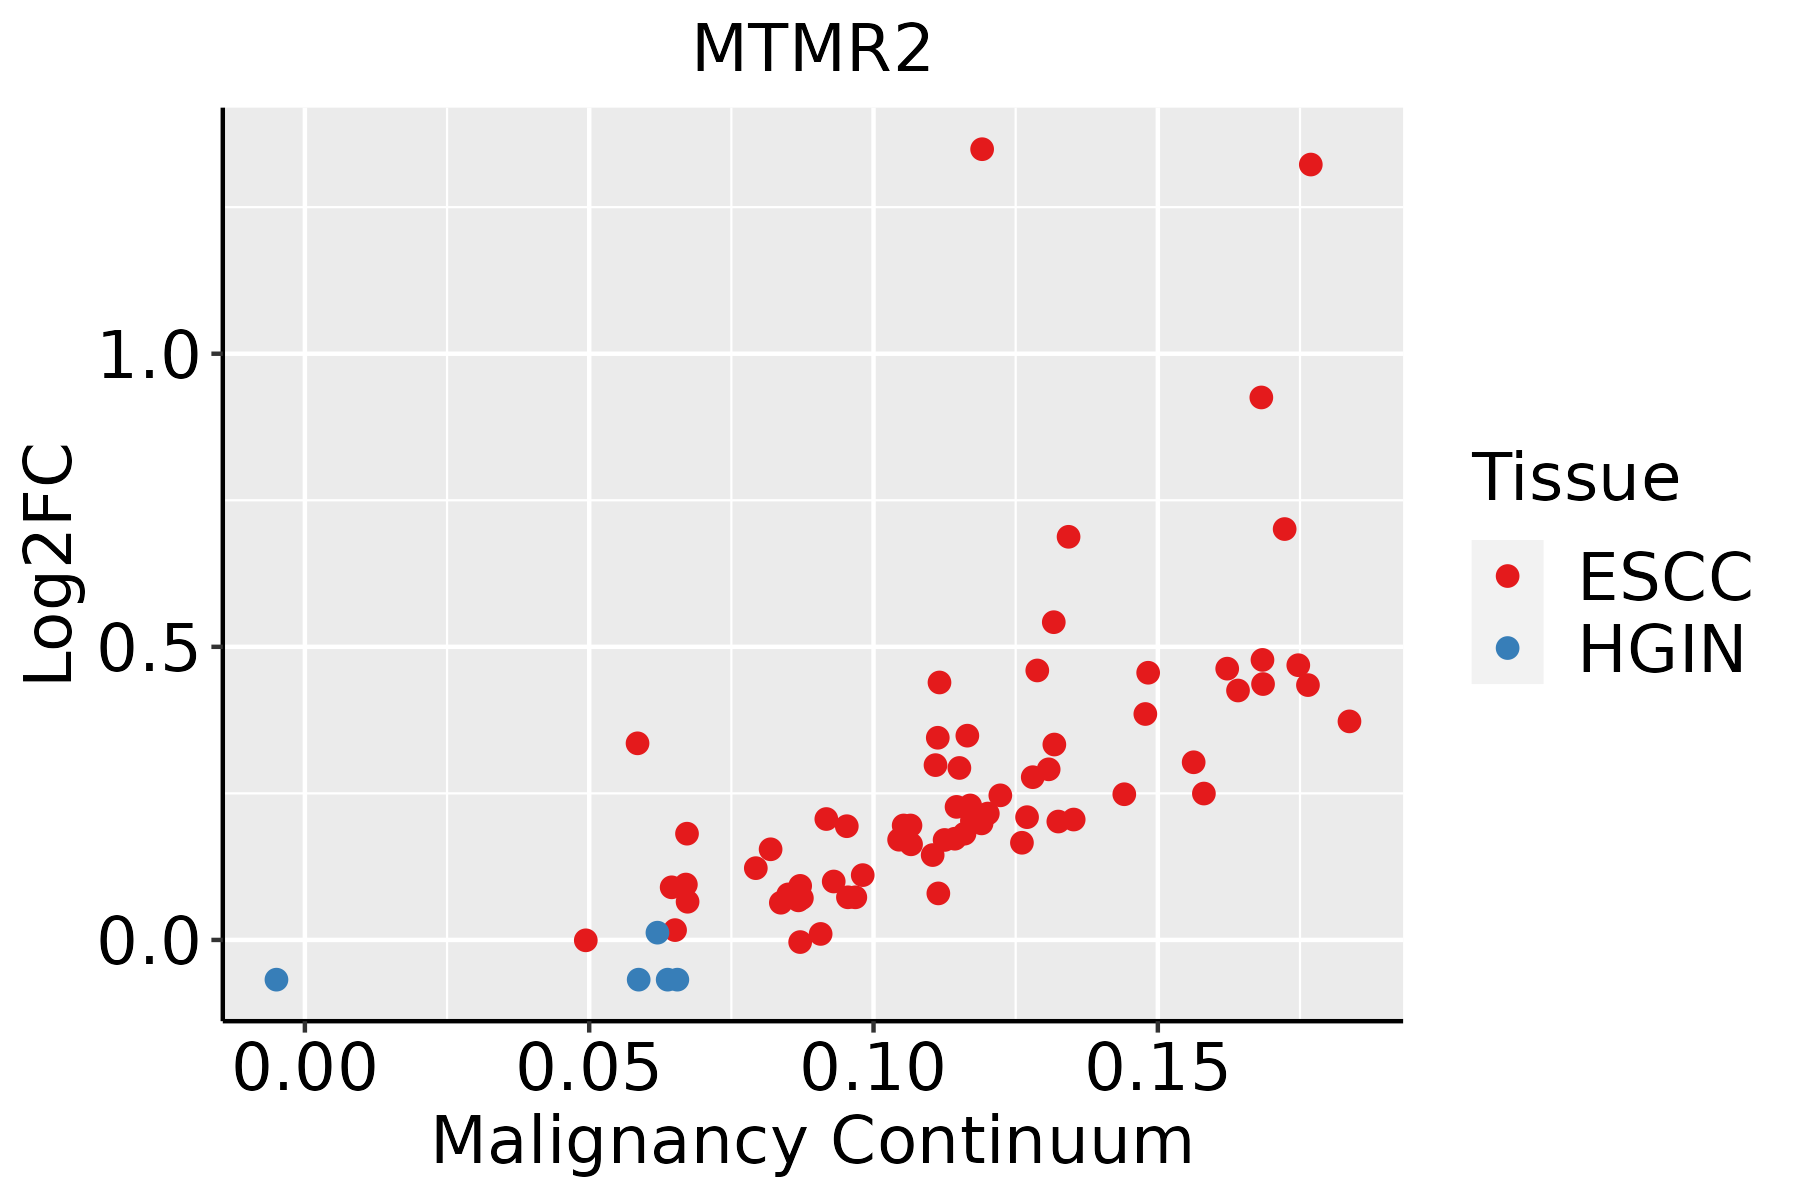
ESCC: Esophageal squamous cell carcinoma
HGIN: High-grade intraepithelial neoplasias
LGIN: Low-grade intraepithelial neoplasias
LiverThe image shows the transcriptomic changes along malignancy continuum.log2FC in expression of this searched gene in stem-like cells from each diseased tissue sample relative to stem-like cells in normal samples in each tissue plotted against the malignancy continuum. Samples are colored based on if they are from different disease stage.
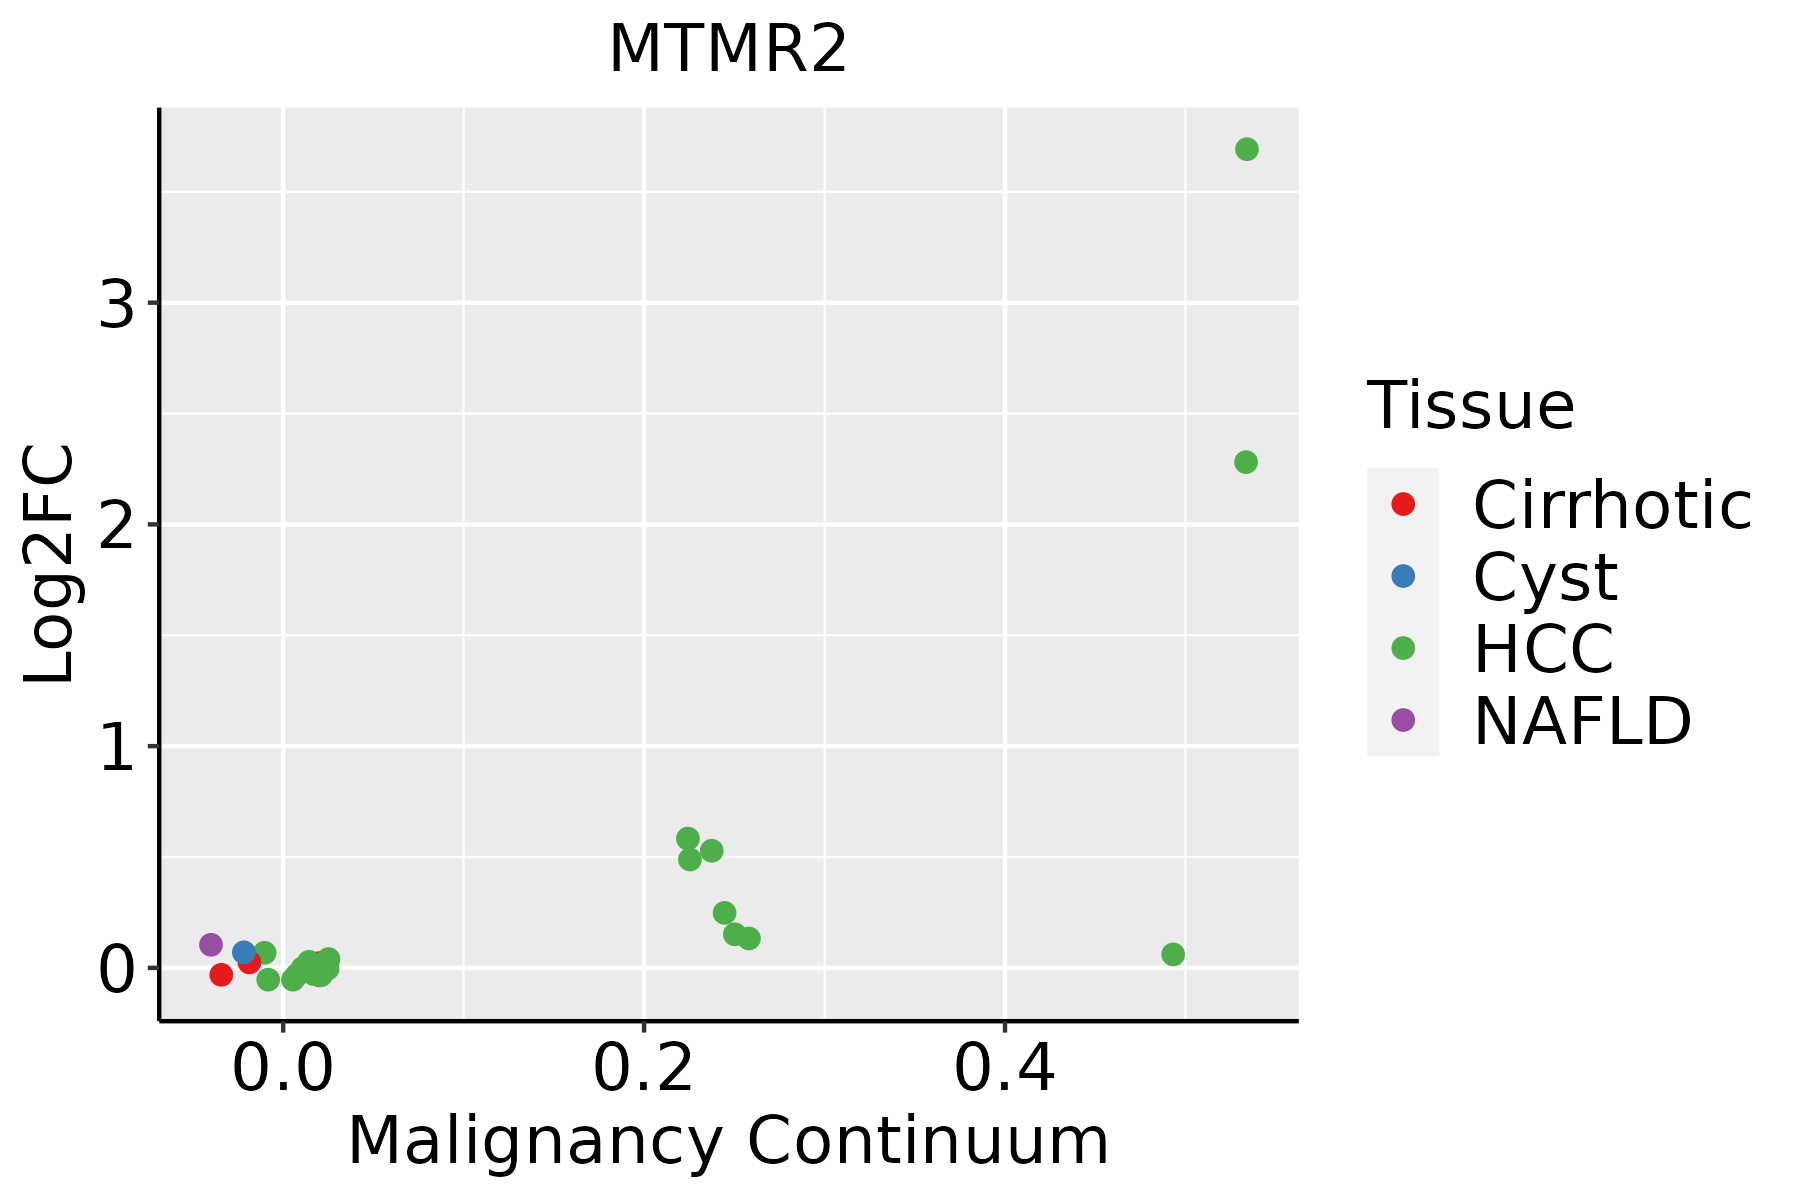
HCC: Hepatocellular carcinoma
NAFLD: Non-alcoholic fatty liver disease
Oral CavityThe image shows the transcriptomic changes along malignancy continuum.log2FC in expression of this searched gene in stem-like cells from each diseased tissue sample relative to stem-like cells in normal samples in each tissue plotted against the malignancy continuum. Samples are colored based on if they are from different disease stage.EOLP: Erosive Oral lichen planus
LP: leukoplakia
NEOLP: Non-erosive oral lichen planus
OSCC: Oral squamous cell carcinoma
SkinThe image shows the transcriptomic changes along malignancy continuum.log2FC in expression of this searched gene in stem-like cells from each diseased tissue sample relative to stem-like cells in normal samples in each tissue plotted against the malignancy continuum. Samples are colored based on if they are from different disease stage.
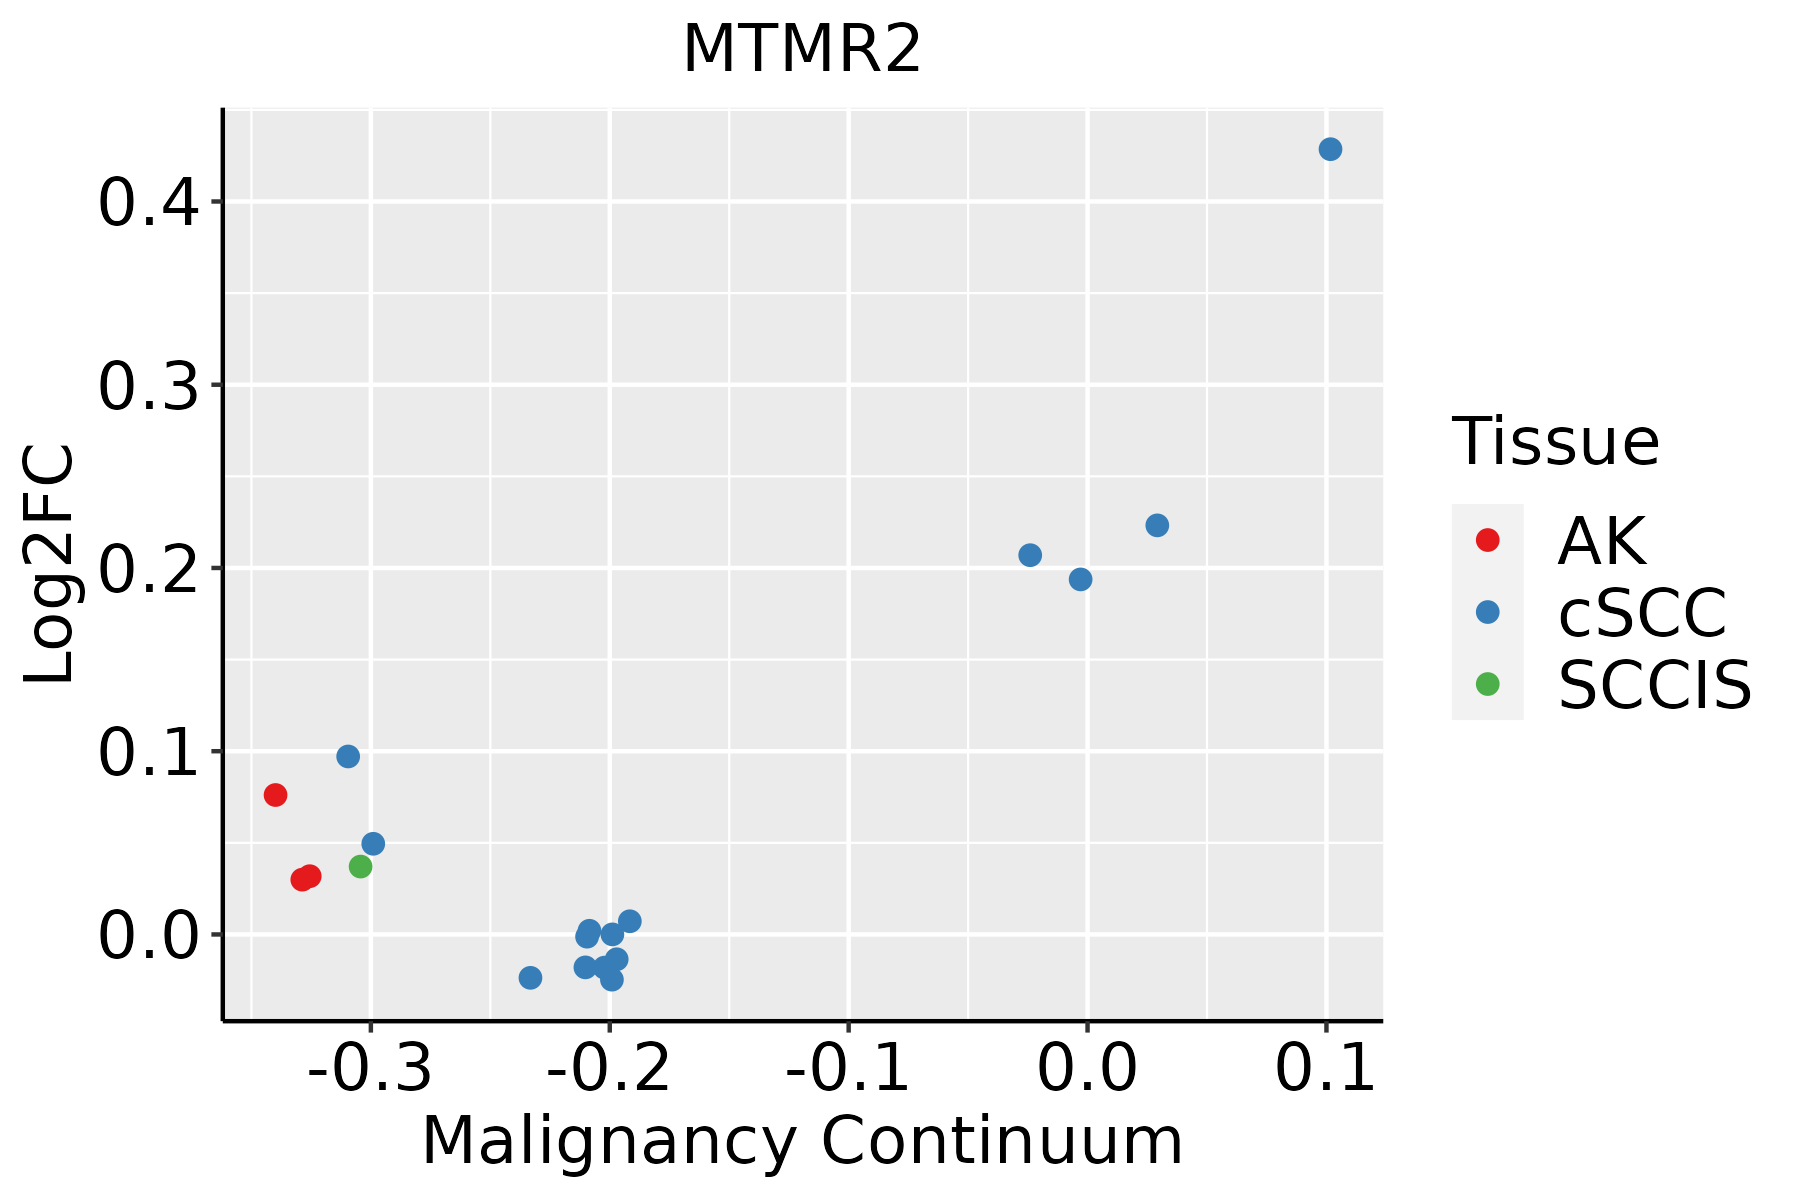
AK: Actinic keratosis
cSCC: Cutaneous squamous cell carcinoma
SCCIS:squamous cell carcinoma in situ
∗log2FC in expression of this searched gene in stem-like cells from each diseased tissue sample relative to stem-like cells in normal samples in each tissue plotted against the malignancy continuum. Samples are colored based on if they are from different disease stage.

Top

Malignant transformation related pathway analysis

check buttonFind out the enriched GO biological processes and KEGG pathways involved in transition from healthy to precancer to cancer
check button Figure of enriched GO biological processes.
TissueDisease StageEnriched GO biological Processes
ColorectumADGO analysis - Figure of enriched GO biological processes: Top 15 enriched GO BP terms are showed in the bar plot of each disease state in each tissue. Each row represents a significant GO biological process which is colored according to the -log10(p.adjust).
ColorectumSERGO analysis - Figure of enriched GO biological processes: Top 15 enriched GO BP terms are showed in the bar plot of each disease state in each tissue. Each row represents a significant GO biological process which is colored according to the -log10(p.adjust).
ColorectumMSSGO analysis - Figure of enriched GO biological processes: Top 15 enriched GO BP terms are showed in the bar plot of each disease state in each tissue. Each row represents a significant GO biological process which is colored according to the -log10(p.adjust).
ColorectumMSI-HGO analysis - Figure of enriched GO biological processes: Top 15 enriched GO BP terms are showed in the bar plot of each disease state in each tissue. Each row represents a significant GO biological process which is colored according to the -log10(p.adjust).
ColorectumFAPGO analysis - Figure of enriched GO biological processes: Top 15 enriched GO BP terms are showed in the bar plot of each disease state in each tissue. Each row represents a significant GO biological process which is colored according to the -log10(p.adjust).
∗Top 15 enriched GO BP terms are showed in the bar plot of each disease state in each tissue. Each row represents a significant GO biological process which is colored according to the -log10(p.adjust).
Page: 1 2 3 4 5 6 7 8 9 

check button Enriched GO biological processes.
GO IDTissueDisease StageDescriptionGene RatioBg Ratiopvaluep.adjustCount
GO:003238618EsophagusESCCregulation of intracellular transport243/8552337/187233.20e-237.25e-21243
GO:0032388110EsophagusESCCpositive regulation of intracellular transport152/8552202/187237.89e-187.36e-16152
GO:001648210EsophagusESCCcytosolic transport124/8552168/187239.69e-144.69e-12124
GO:0009895111EsophagusESCCnegative regulation of catabolic process201/8552320/187233.88e-101.05e-08201
GO:001631110EsophagusESCCdephosphorylation251/8552417/187231.26e-092.99e-08251
GO:00086544EsophagusESCCphospholipid biosynthetic process162/8552253/187232.59e-095.73e-08162
GO:000647018EsophagusESCCprotein dephosphorylation177/8552281/187233.13e-096.72e-08177
GO:0031330111EsophagusESCCnegative regulation of cellular catabolic process166/8552262/187235.17e-091.08e-07166
GO:003010018EsophagusESCCregulation of endocytosis135/8552211/187235.75e-081.02e-06135
GO:00464744EsophagusESCCglycerophospholipid biosynthetic process135/8552211/187235.75e-081.02e-06135
GO:0035303111EsophagusESCCregulation of dephosphorylation88/8552128/187231.04e-071.71e-0688
GO:00989278EsophagusESCCvesicle-mediated transport between endosomal compartments36/855243/187232.90e-074.20e-0636
GO:00450175EsophagusESCCglycerolipid biosynthetic process154/8552252/187235.20e-076.96e-06154
GO:00450226EsophagusESCCearly endosome to late endosome transport33/855240/187231.80e-062.11e-0533
GO:00066446EsophagusESCCphospholipid metabolic process218/8552383/187235.37e-065.59e-05218
GO:00060668EsophagusESCCalcohol metabolic process202/8552353/187237.32e-067.26e-05202
GO:004311218EsophagusESCCreceptor metabolic process104/8552166/187237.44e-067.37e-05104
GO:00425524EsophagusESCCmyelination85/8552134/187232.51e-052.13e-0485
GO:00072724EsophagusESCCensheathment of neurons86/8552136/187232.68e-052.24e-0486
GO:00083664EsophagusESCCaxon ensheathment86/8552136/187232.68e-052.24e-0486
Page: 1 2 3 4 5 6 

check button Enriched KEGG pathways.
Pathway IDTissueDisease StageDescriptionGene RatioBg Ratiopvaluep.adjustqvalueCount
Page: 1 

Top

Cell-cell communication analysis

check buttonIdentification of potential cell-cell interactions between two cell types and their ligand-receptor pairs for different disease states
LigandReceptorLRpairPathwayTissueDisease Stage
Page: 1 

Top

Single-cell gene regulatory network inference analysis

check buttonFind out the significant the regulons (TFs) and the target genes of each regulon across cell types for different disease states
TFCell TypeTissueDisease StageTarget GeneRSSRegulon Activity
∗The dot plots of a searched regulon are shown for all cell subpopulations in each disease state of each tissue based on the regulon specific score inferred using pySCENIC and by calculating the average expression.
Page: 1 

Top

Somatic mutation of malignant transformation related genes

check buttonAnnotation of somatic variants for genes involved in malignant transformation
Hugo SymbolVariant ClassVariant ClassificationdbSNP RSHGVScHGVSpHGVSp ShortSWISSPROTBIOTYPESIFTPolyPhenTumor Sample BarcodeTissueHistologySexAgeStageTherapy TypesDrugsOutcome
MTMR2SNVMissense_Mutationrs757563721c.832C>Ap.Gln278Lysp.Q278KQ13614protein_codingtolerated(0.19)benign(0.014)TCGA-A7-A0DA-01Breastbreast invasive carcinomaFemale<65I/IIChemotherapyadriamycinSD
MTMR2SNVMissense_Mutationc.1018G>Cp.Glu340Glnp.E340QQ13614protein_codingdeleterious(0)possibly_damaging(0.818)TCGA-AC-A23H-01Breastbreast invasive carcinomaFemale>=65I/IIUnknownUnknownPD
MTMR2SNVMissense_Mutationc.662N>Tp.Pro221Leup.P221LQ13614protein_codingdeleterious(0)probably_damaging(0.944)TCGA-AN-A0FJ-01Breastbreast invasive carcinomaFemale<65III/IVUnknownUnknownSD
MTMR2SNVMissense_Mutationrs757563721c.832C>Ap.Gln278Lysp.Q278KQ13614protein_codingtolerated(0.19)benign(0.014)TCGA-D8-A1X7-01Breastbreast invasive carcinomaFemale<65I/IIChemotherapyHormone Therapydoxorubicine+cyclophosphamide+tamoxifenSD
MTMR2SNVMissense_Mutationnovelc.831T>Ap.Ser277Argp.S277RQ13614protein_codingdeleterious(0)probably_damaging(0.93)TCGA-D8-A1X7-01Breastbreast invasive carcinomaFemale<65I/IIChemotherapyHormone Therapydoxorubicine+cyclophosphamide+tamoxifenSD
MTMR2SNVMissense_Mutationc.238C>Gp.Pro80Alap.P80AQ13614protein_codingtolerated(0.08)benign(0.027)TCGA-EK-A2PL-01Cervixcervical & endocervical cancerFemale<65III/IVUnknownUnknownSD
MTMR2SNVMissense_Mutationnovelc.431N>Ap.Arg144Glnp.R144QQ13614protein_codingtolerated(0.08)benign(0.066)TCGA-XS-A8TJ-01Cervixcervical & endocervical cancerFemale<65I/IIChemotherapycisplatinSD
MTMR2SNVMissense_Mutationnovelc.1790N>Gp.Tyr597Cysp.Y597CQ13614protein_codingtolerated(0.14)possibly_damaging(0.662)TCGA-CA-6717-01Colorectumcolon adenocarcinomaMale<65I/IIChemotherapyoxaliplatinCR
MTMR2SNVMissense_Mutationnovelc.1574N>Cp.Glu525Alap.E525AQ13614protein_codingdeleterious(0)possibly_damaging(0.691)TCGA-CA-6717-01Colorectumcolon adenocarcinomaMale<65I/IIChemotherapyoxaliplatinCR
MTMR2SNVMissense_Mutationnovelc.216N>Cp.Glu72Aspp.E72DQ13614protein_codingtolerated(0.35)benign(0.007)TCGA-CA-6717-01Colorectumcolon adenocarcinomaMale<65I/IIChemotherapyoxaliplatinCR
Page: 1 2 3 4 5 

Top

Related drugs of malignant transformation related genes

check buttonIdentification of chemicals and drugs interact with genes involved in malignant transfromation
(DGIdb 4.0)
Entrez IDSymbolCategoryInteraction TypesDrug Claim NameDrug NamePMIDs
Page: 1