
|
|||||
|
 | |
| |
| |
| |
| |
| |
|
Gene: MTMR14 |
Gene summary for MTMR14 |
| Gene information | Species | Human | Gene symbol | MTMR14 | Gene ID | 64419 |
| Gene name | myotubularin related protein 14 | |
| Gene Alias | C3orf29 | |
| Cytomap | 3p25.3 | |
| Gene Type | protein-coding | GO ID | GO:0006464 | UniProtAcc | Q8NCE2 |
Top |
Malignant transformation analysis |
| Identification of the aberrant gene expression in precancerous and cancerous lesions by comparing the gene expression of stem-like cells in diseased tissues with normal stem cells |
| Entrez ID | Symbol | Replicates | Species | Organ | Tissue | Adj P-value | Log2FC | Malignancy |
| 64419 | MTMR14 | LZE7T | Human | Esophagus | ESCC | 1.98e-02 | 6.74e-02 | 0.0667 |
| 64419 | MTMR14 | LZE22T | Human | Esophagus | ESCC | 1.04e-03 | 2.17e-01 | 0.068 |
| 64419 | MTMR14 | LZE24T | Human | Esophagus | ESCC | 1.00e-12 | 3.24e-01 | 0.0596 |
| 64419 | MTMR14 | P2T-E | Human | Esophagus | ESCC | 8.92e-11 | 1.44e-01 | 0.1177 |
| 64419 | MTMR14 | P4T-E | Human | Esophagus | ESCC | 6.41e-09 | 1.88e-01 | 0.1323 |
| 64419 | MTMR14 | P5T-E | Human | Esophagus | ESCC | 1.45e-17 | 2.88e-01 | 0.1327 |
| 64419 | MTMR14 | P8T-E | Human | Esophagus | ESCC | 1.04e-16 | 1.72e-01 | 0.0889 |
| 64419 | MTMR14 | P9T-E | Human | Esophagus | ESCC | 6.14e-03 | 1.24e-01 | 0.1131 |
| 64419 | MTMR14 | P10T-E | Human | Esophagus | ESCC | 9.13e-16 | 2.49e-01 | 0.116 |
| 64419 | MTMR14 | P11T-E | Human | Esophagus | ESCC | 2.12e-12 | 5.83e-01 | 0.1426 |
| 64419 | MTMR14 | P12T-E | Human | Esophagus | ESCC | 4.36e-08 | 3.78e-01 | 0.1122 |
| 64419 | MTMR14 | P15T-E | Human | Esophagus | ESCC | 6.29e-07 | 1.83e-01 | 0.1149 |
| 64419 | MTMR14 | P16T-E | Human | Esophagus | ESCC | 1.15e-15 | 1.58e-01 | 0.1153 |
| 64419 | MTMR14 | P17T-E | Human | Esophagus | ESCC | 5.82e-07 | 2.96e-01 | 0.1278 |
| 64419 | MTMR14 | P19T-E | Human | Esophagus | ESCC | 3.67e-06 | 5.33e-01 | 0.1662 |
| 64419 | MTMR14 | P20T-E | Human | Esophagus | ESCC | 1.55e-12 | 2.39e-01 | 0.1124 |
| 64419 | MTMR14 | P21T-E | Human | Esophagus | ESCC | 1.95e-22 | 3.55e-01 | 0.1617 |
| 64419 | MTMR14 | P22T-E | Human | Esophagus | ESCC | 1.98e-03 | 2.00e-02 | 0.1236 |
| 64419 | MTMR14 | P23T-E | Human | Esophagus | ESCC | 2.22e-23 | 5.51e-01 | 0.108 |
| 64419 | MTMR14 | P24T-E | Human | Esophagus | ESCC | 2.89e-18 | 3.88e-01 | 0.1287 |
| Page: 1 2 3 4 5 |
| Tissue | Expression Dynamics | Abbreviation |
| Esophagus | 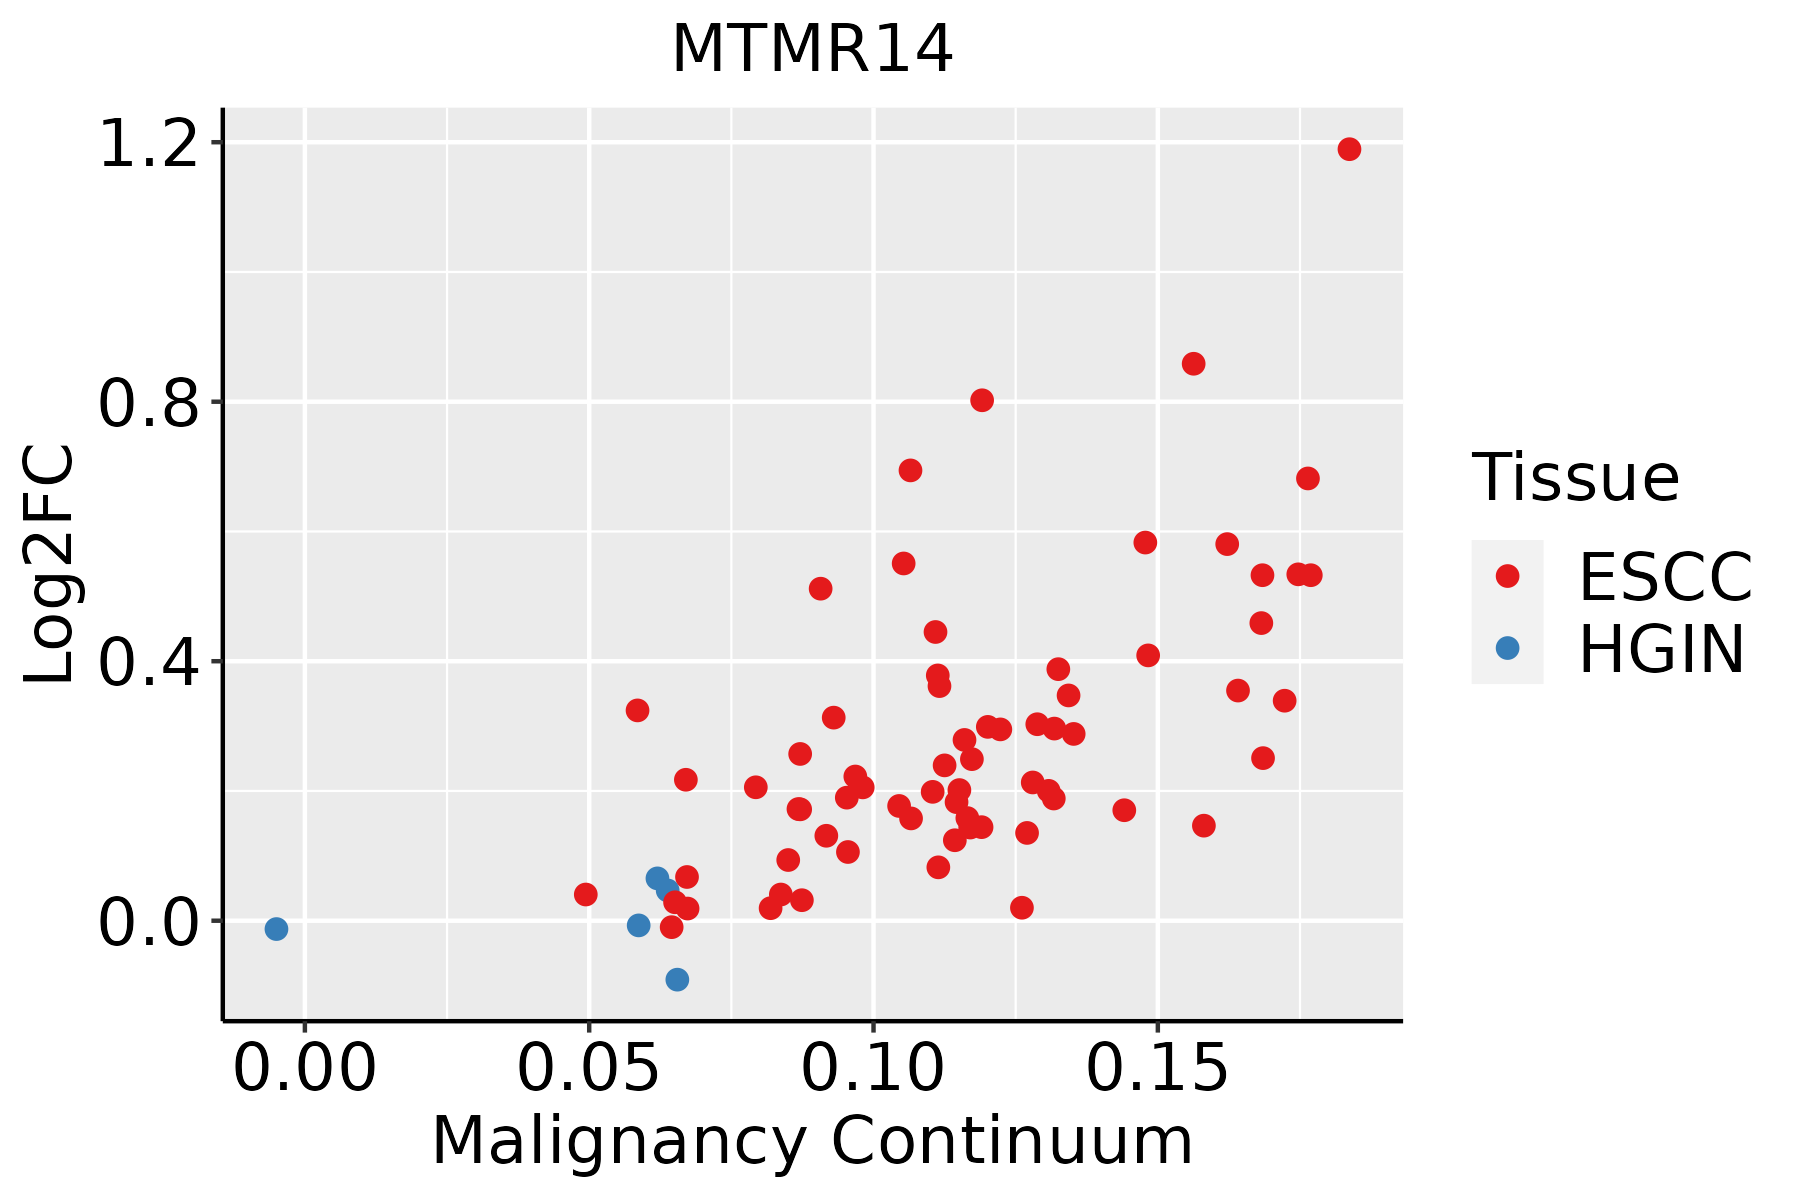 | ESCC: Esophageal squamous cell carcinoma |
| HGIN: High-grade intraepithelial neoplasias | ||
| LGIN: Low-grade intraepithelial neoplasias | ||
| Liver | 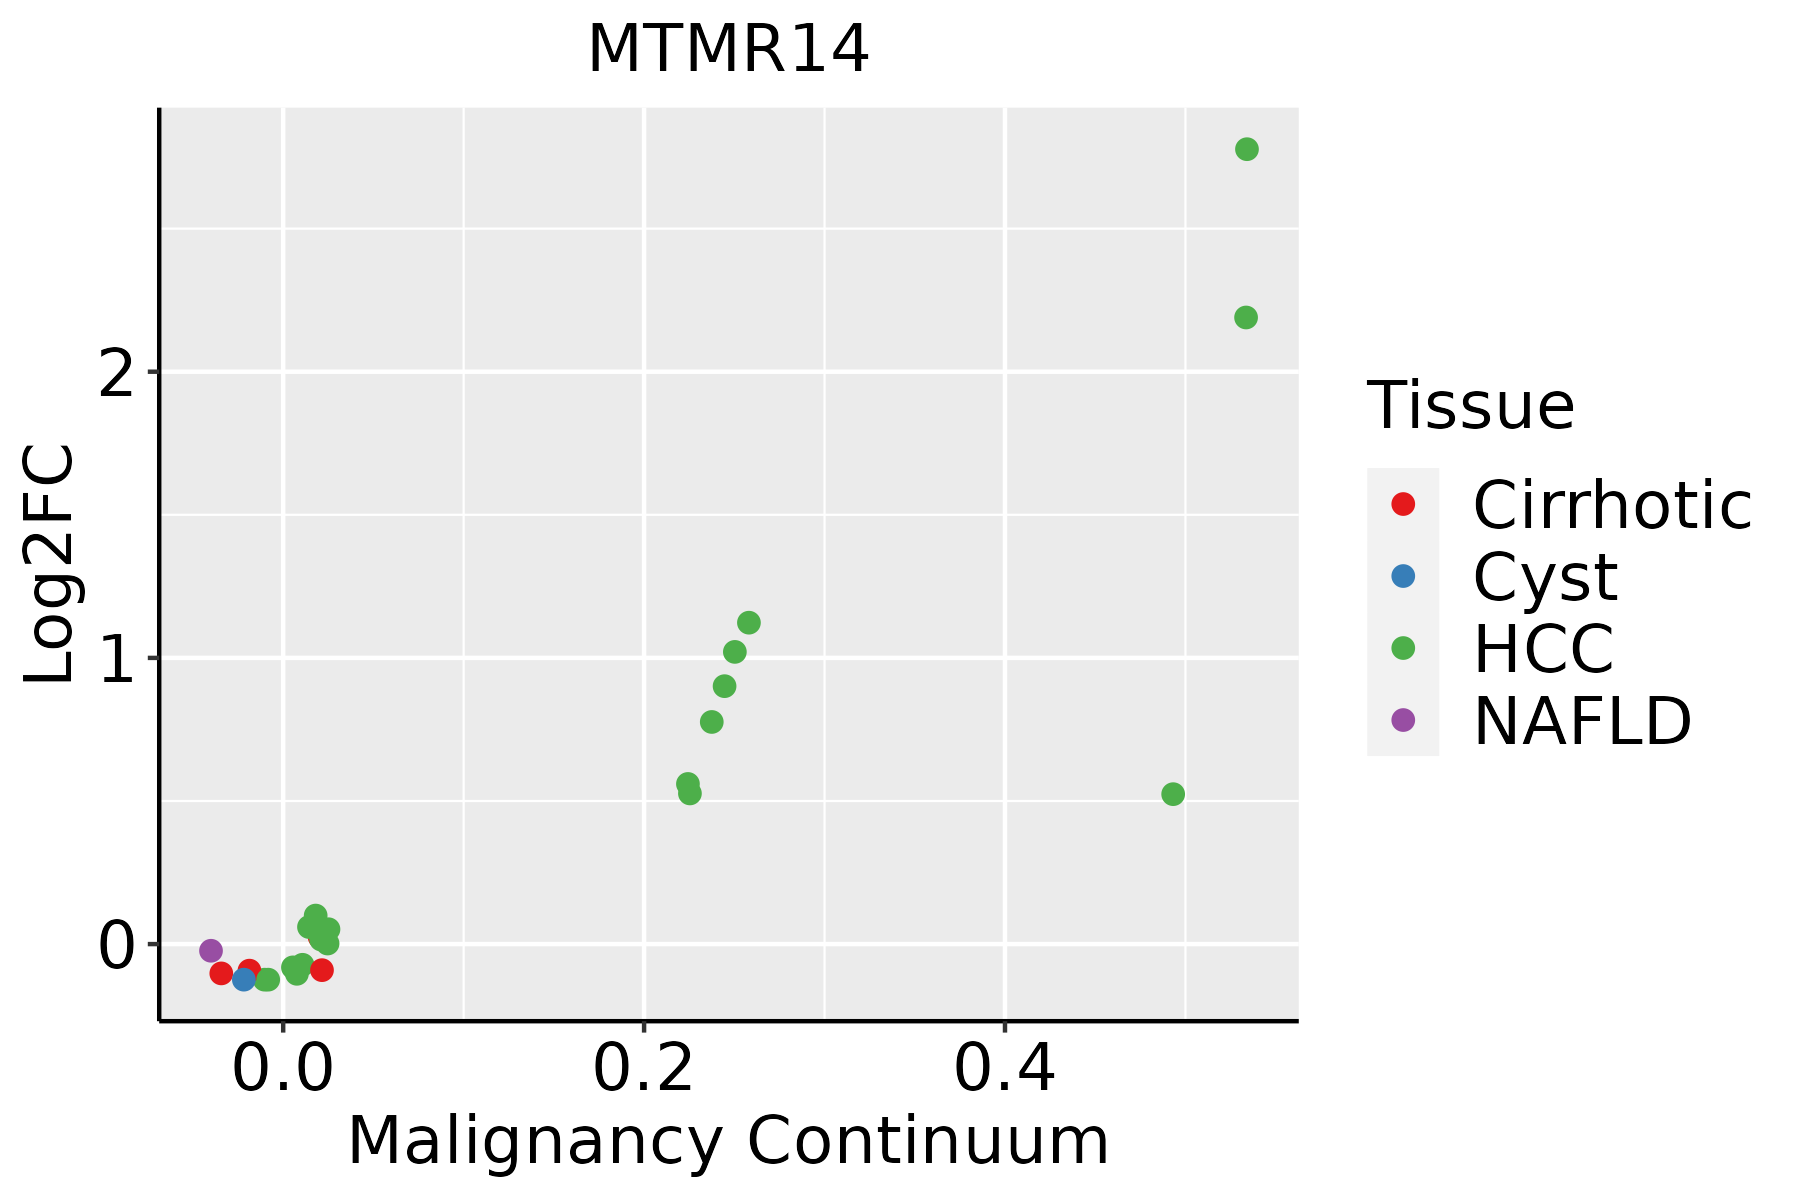 | HCC: Hepatocellular carcinoma |
| NAFLD: Non-alcoholic fatty liver disease | ||
| Oral Cavity | 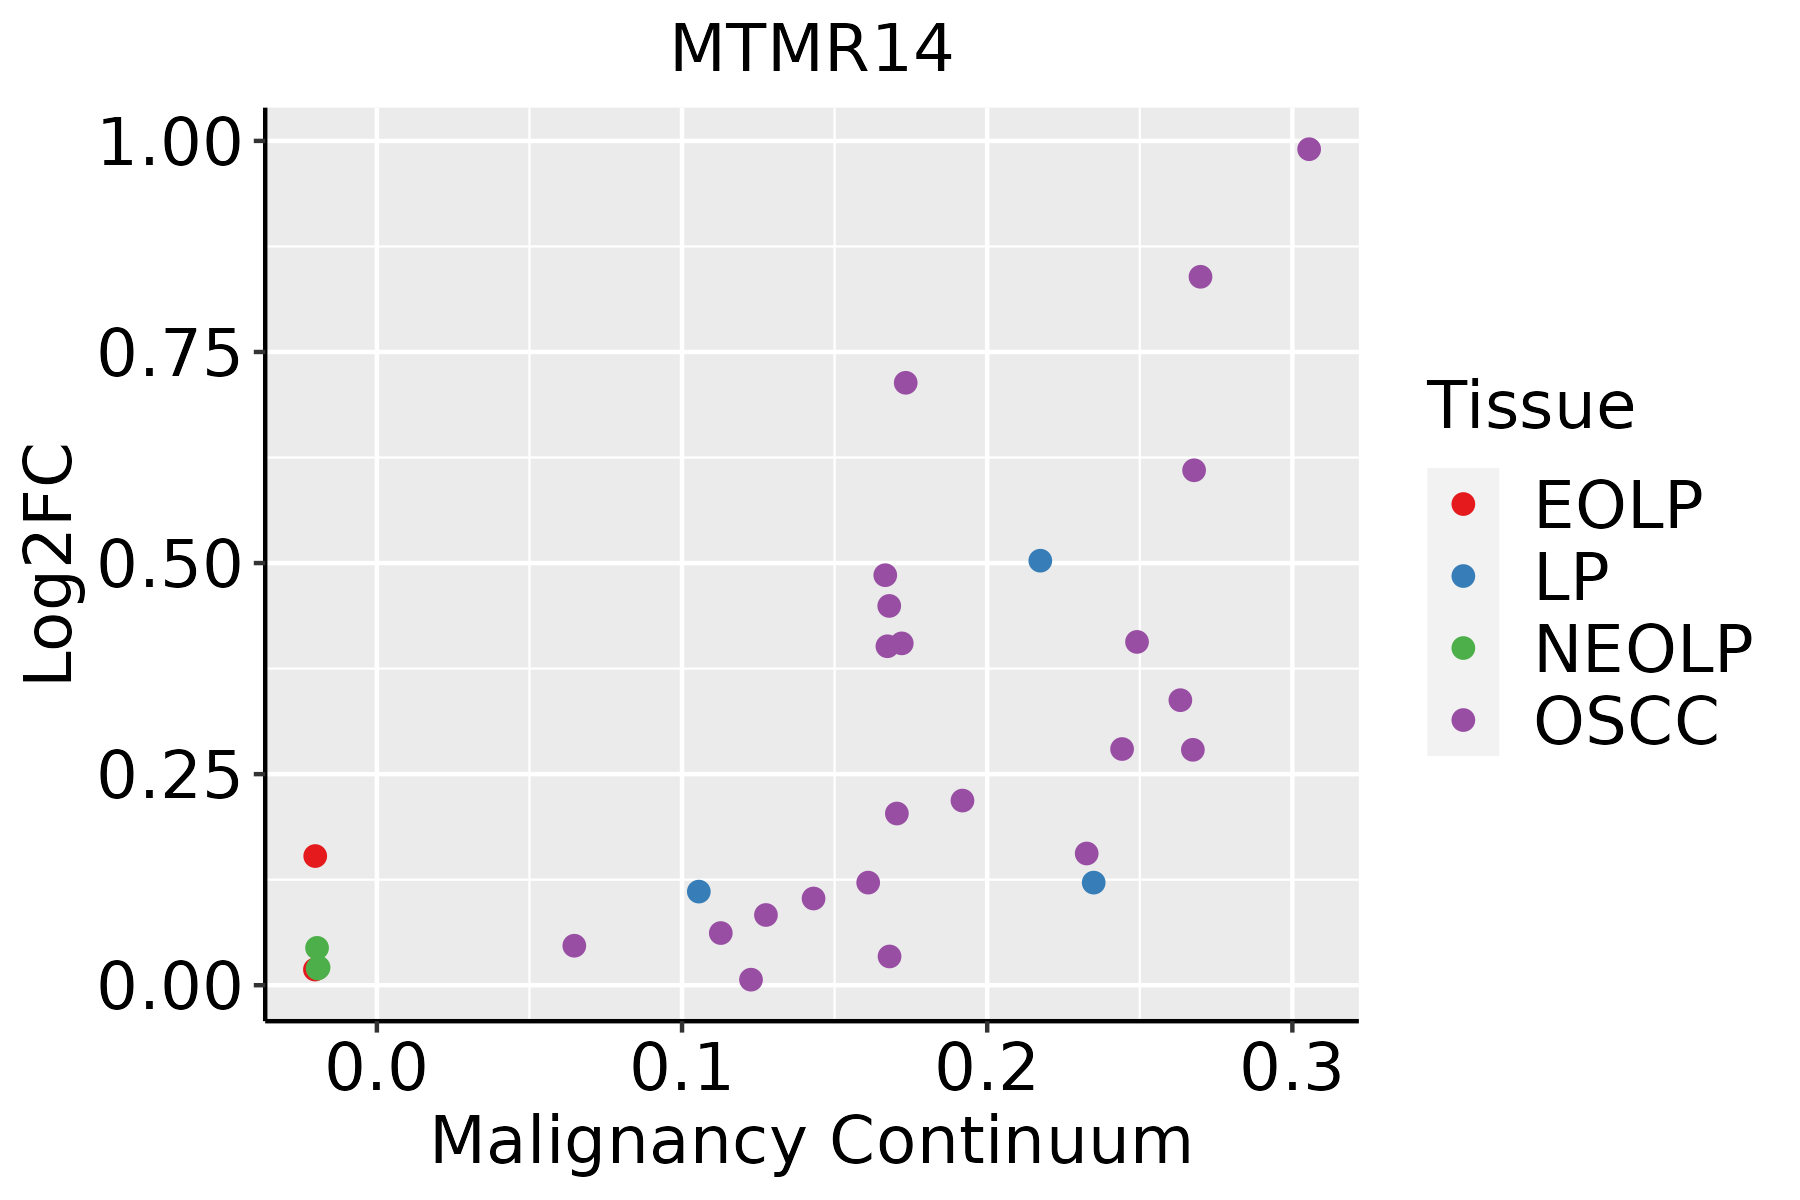 | EOLP: Erosive Oral lichen planus |
| LP: leukoplakia | ||
| NEOLP: Non-erosive oral lichen planus | ||
| OSCC: Oral squamous cell carcinoma |
| ∗log2FC in expression of this searched gene in stem-like cells from each diseased tissue sample relative to stem-like cells in normal samples in each tissue plotted against the malignancy continuum. Samples are colored based on if they are from different disease stage. |
Top |
Malignant transformation related pathway analysis |
| Find out the enriched GO biological processes and KEGG pathways involved in transition from healthy to precancer to cancer |
| Tissue | Disease Stage | Enriched GO biological Processes |
| Colorectum | AD |  |
| Colorectum | SER |  |
| Colorectum | MSS |  |
| Colorectum | MSI-H |  |
| Colorectum | FAP |  |
| ∗Top 15 enriched GO BP terms are showed in the bar plot of each disease state in each tissue. Each row represents a significant GO biological process which is colored according to the -log10(p.adjust). |
| Page: 1 2 3 4 5 6 7 8 9 |
| GO ID | Tissue | Disease Stage | Description | Gene Ratio | Bg Ratio | pvalue | p.adjust | Count |
| GO:001623617 | Esophagus | ESCC | macroautophagy | 216/8552 | 291/18723 | 1.94e-23 | 4.57e-21 | 216 |
| GO:001631110 | Esophagus | ESCC | dephosphorylation | 251/8552 | 417/18723 | 1.26e-09 | 2.99e-08 | 251 |
| GO:00086544 | Esophagus | ESCC | phospholipid biosynthetic process | 162/8552 | 253/18723 | 2.59e-09 | 5.73e-08 | 162 |
| GO:000647018 | Esophagus | ESCC | protein dephosphorylation | 177/8552 | 281/18723 | 3.13e-09 | 6.72e-08 | 177 |
| GO:00464744 | Esophagus | ESCC | glycerophospholipid biosynthetic process | 135/8552 | 211/18723 | 5.75e-08 | 1.02e-06 | 135 |
| GO:00450175 | Esophagus | ESCC | glycerolipid biosynthetic process | 154/8552 | 252/18723 | 5.20e-07 | 6.96e-06 | 154 |
| GO:00066446 | Esophagus | ESCC | phospholipid metabolic process | 218/8552 | 383/18723 | 5.37e-06 | 5.59e-05 | 218 |
| GO:00066505 | Esophagus | ESCC | glycerophospholipid metabolic process | 174/8552 | 306/18723 | 4.92e-05 | 3.85e-04 | 174 |
| GO:00464864 | Esophagus | ESCC | glycerolipid metabolic process | 211/8552 | 392/18723 | 6.51e-04 | 3.46e-03 | 211 |
| GO:00066611 | Esophagus | ESCC | phosphatidylinositol biosynthetic process | 73/8552 | 131/18723 | 1.31e-02 | 4.28e-02 | 73 |
| GO:001623621 | Liver | HCC | macroautophagy | 204/7958 | 291/18723 | 8.66e-22 | 1.41e-19 | 204 |
| GO:00086542 | Liver | HCC | phospholipid biosynthetic process | 150/7958 | 253/18723 | 4.77e-08 | 1.03e-06 | 150 |
| GO:00066444 | Liver | HCC | phospholipid metabolic process | 214/7958 | 383/18723 | 7.25e-08 | 1.48e-06 | 214 |
| GO:001631121 | Liver | HCC | dephosphorylation | 230/7958 | 417/18723 | 1.00e-07 | 1.96e-06 | 230 |
| GO:000647021 | Liver | HCC | protein dephosphorylation | 162/7958 | 281/18723 | 1.91e-07 | 3.46e-06 | 162 |
| GO:004648611 | Liver | HCC | glycerolipid metabolic process | 215/7958 | 392/18723 | 4.54e-07 | 7.49e-06 | 215 |
| GO:004501711 | Liver | HCC | glycerolipid biosynthetic process | 143/7958 | 252/18723 | 3.27e-06 | 4.31e-05 | 143 |
| GO:00066504 | Liver | HCC | glycerophospholipid metabolic process | 168/7958 | 306/18723 | 7.27e-06 | 8.62e-05 | 168 |
| GO:004647411 | Liver | HCC | glycerophospholipid biosynthetic process | 121/7958 | 211/18723 | 9.12e-06 | 1.06e-04 | 121 |
| GO:0006661 | Liver | HCC | phosphatidylinositol biosynthetic process | 69/7958 | 131/18723 | 1.19e-02 | 4.35e-02 | 69 |
| Page: 1 2 |
| Pathway ID | Tissue | Disease Stage | Description | Gene Ratio | Bg Ratio | pvalue | p.adjust | qvalue | Count |
| hsa0414010 | Esophagus | ESCC | Autophagy - animal | 101/4205 | 141/8465 | 7.60e-08 | 6.21e-07 | 3.18e-07 | 101 |
| hsa0414015 | Esophagus | ESCC | Autophagy - animal | 101/4205 | 141/8465 | 7.60e-08 | 6.21e-07 | 3.18e-07 | 101 |
| hsa0414021 | Liver | HCC | Autophagy - animal | 99/4020 | 141/8465 | 3.08e-08 | 4.70e-07 | 2.61e-07 | 99 |
| hsa0414031 | Liver | HCC | Autophagy - animal | 99/4020 | 141/8465 | 3.08e-08 | 4.70e-07 | 2.61e-07 | 99 |
| hsa041409 | Oral cavity | OSCC | Autophagy - animal | 94/3704 | 141/8465 | 2.73e-08 | 2.38e-07 | 1.21e-07 | 94 |
| hsa0414014 | Oral cavity | OSCC | Autophagy - animal | 94/3704 | 141/8465 | 2.73e-08 | 2.38e-07 | 1.21e-07 | 94 |
| hsa0414041 | Oral cavity | EOLP | Autophagy - animal | 39/1218 | 141/8465 | 2.68e-05 | 1.38e-04 | 8.12e-05 | 39 |
| hsa0414051 | Oral cavity | EOLP | Autophagy - animal | 39/1218 | 141/8465 | 2.68e-05 | 1.38e-04 | 8.12e-05 | 39 |
| Page: 1 |
Top |
Cell-cell communication analysis |
| Identification of potential cell-cell interactions between two cell types and their ligand-receptor pairs for different disease states |
| Ligand | Receptor | LRpair | Pathway | Tissue | Disease Stage |
| Page: 1 |
Top |
Single-cell gene regulatory network inference analysis |
| Find out the significant the regulons (TFs) and the target genes of each regulon across cell types for different disease states |
| TF | Cell Type | Tissue | Disease Stage | Target Gene | RSS | Regulon Activity |
| ∗The dot plots of a searched regulon are shown for all cell subpopulations in each disease state of each tissue based on the regulon specific score inferred using pySCENIC and by calculating the average expression. |
| Page: 1 |
Top |
Somatic mutation of malignant transformation related genes |
| Annotation of somatic variants for genes involved in malignant transformation |
| Hugo Symbol | Variant Class | Variant Classification | dbSNP RS | HGVSc | HGVSp | HGVSp Short | SWISSPROT | BIOTYPE | SIFT | PolyPhen | Tumor Sample Barcode | Tissue | Histology | Sex | Age | Stage | Therapy Types | Drugs | Outcome |
| MTMR14 | SNV | Missense_Mutation | c.202N>C | p.Asp68His | p.D68H | Q8NCE2 | protein_coding | deleterious(0) | probably_damaging(0.998) | TCGA-AC-A23H-01 | Breast | breast invasive carcinoma | Female | >=65 | I/II | Unknown | Unknown | PD | |
| MTMR14 | SNV | Missense_Mutation | c.1420N>G | p.Thr474Ala | p.T474A | Q8NCE2 | protein_coding | tolerated(0.64) | benign(0) | TCGA-D8-A1XK-01 | Breast | breast invasive carcinoma | Female | <65 | I/II | Chemotherapy | doxorubicine+cyclophosphamide | SD | |
| MTMR14 | SNV | Missense_Mutation | rs757251437 | c.1144N>T | p.Arg382Trp | p.R382W | Q8NCE2 | protein_coding | deleterious(0) | probably_damaging(1) | TCGA-E9-A1NI-01 | Breast | breast invasive carcinoma | Female | <65 | I/II | Chemotherapy | doxorubicin | CR |
| MTMR14 | SNV | Missense_Mutation | novel | c.526N>T | p.Asp176Tyr | p.D176Y | Q8NCE2 | protein_coding | deleterious(0) | possibly_damaging(0.73) | TCGA-EA-A3Y4-01 | Cervix | cervical & endocervical cancer | Female | <65 | I/II | Unknown | Unknown | SD |
| MTMR14 | SNV | Missense_Mutation | c.1817C>T | p.Ser606Leu | p.S606L | Q8NCE2 | protein_coding | tolerated(0.16) | benign(0.115) | TCGA-Q1-A73O-01 | Cervix | cervical & endocervical cancer | Female | <65 | I/II | Chemotherapy | cisplatin | CR | |
| MTMR14 | SNV | Missense_Mutation | novel | c.215N>T | p.Ser72Ile | p.S72I | Q8NCE2 | protein_coding | tolerated(0.05) | possibly_damaging(0.86) | TCGA-AY-4070-01 | Colorectum | colon adenocarcinoma | Female | <65 | III/IV | Chemotherapy | 5-fu | PD |
| MTMR14 | SNV | Missense_Mutation | novel | c.1215N>A | p.Phe405Leu | p.F405L | Q8NCE2 | protein_coding | deleterious(0) | possibly_damaging(0.867) | TCGA-CA-6717-01 | Colorectum | colon adenocarcinoma | Male | <65 | I/II | Chemotherapy | oxaliplatin | CR |
| MTMR14 | SNV | Missense_Mutation | c.1156N>T | p.Gly386Trp | p.G386W | Q8NCE2 | protein_coding | deleterious(0) | probably_damaging(0.998) | TCGA-CM-5861-01 | Colorectum | colon adenocarcinoma | Female | <65 | I/II | Unknown | Unknown | PD | |
| MTMR14 | SNV | Missense_Mutation | c.700G>A | p.Asp234Asn | p.D234N | Q8NCE2 | protein_coding | deleterious(0) | probably_damaging(0.999) | TCGA-EI-6507-01 | Colorectum | rectum adenocarcinoma | Male | <65 | I/II | Unknown | Unknown | SD | |
| MTMR14 | deletion | Frame_Shift_Del | c.1865delN | p.Ser624ValfsTer33 | p.S624Vfs*33 | Q8NCE2 | protein_coding | TCGA-CM-4746-01 | Colorectum | colon adenocarcinoma | Male | <65 | I/II | Unknown | Unknown | SD |
| Page: 1 2 3 4 |
Top |
Related drugs of malignant transformation related genes |
| Identification of chemicals and drugs interact with genes involved in malignant transfromation |
| (DGIdb 4.0) |
| Entrez ID | Symbol | Category | Interaction Types | Drug Claim Name | Drug Name | PMIDs |
| Page: 1 |

Copyright 2023-Present -The University of Texas Health Science Center at Houston |