
|
|||||
|
 | |
| |
| |
| |
| |
| |
|
Gene: MTMR11 |
Gene summary for MTMR11 |
| Gene information | Species | Human | Gene symbol | MTMR11 | Gene ID | 10903 |
| Gene name | myotubularin related protein 11 | |
| Gene Alias | CRA | |
| Cytomap | 1q21.2 | |
| Gene Type | protein-coding | GO ID | GO:0006629 | UniProtAcc | A4FU01 |
Top |
Malignant transformation analysis |
| Identification of the aberrant gene expression in precancerous and cancerous lesions by comparing the gene expression of stem-like cells in diseased tissues with normal stem cells |
| Entrez ID | Symbol | Replicates | Species | Organ | Tissue | Adj P-value | Log2FC | Malignancy |
| 10903 | MTMR11 | HTA11_2487_2000001011 | Human | Colorectum | SER | 1.72e-08 | 4.47e-01 | -0.1808 |
| 10903 | MTMR11 | HTA11_1938_2000001011 | Human | Colorectum | AD | 7.58e-16 | 8.94e-01 | -0.0811 |
| 10903 | MTMR11 | HTA11_78_2000001011 | Human | Colorectum | AD | 4.23e-06 | 5.00e-01 | -0.1088 |
| 10903 | MTMR11 | HTA11_347_2000001011 | Human | Colorectum | AD | 8.23e-12 | 5.28e-01 | -0.1954 |
| 10903 | MTMR11 | HTA11_99999971662_82457 | Human | Colorectum | MSS | 1.57e-03 | 2.97e-01 | 0.3859 |
| 10903 | MTMR11 | HTA11_99999974143_84620 | Human | Colorectum | MSS | 1.50e-02 | -2.14e-01 | 0.3005 |
| 10903 | MTMR11 | A015-C-203 | Human | Colorectum | FAP | 2.64e-05 | -2.07e-01 | -0.1294 |
| 10903 | MTMR11 | A015-C-104 | Human | Colorectum | FAP | 8.56e-03 | -1.68e-01 | -0.1899 |
| 10903 | MTMR11 | A002-C-116 | Human | Colorectum | FAP | 4.34e-03 | -1.23e-01 | -0.0452 |
| 10903 | MTMR11 | F072B | Human | Colorectum | FAP | 1.25e-02 | -1.38e-01 | 0.257 |
| 10903 | MTMR11 | LZE6T | Human | Esophagus | ESCC | 1.40e-03 | 3.31e-01 | 0.0845 |
| 10903 | MTMR11 | P2T-E | Human | Esophagus | ESCC | 5.47e-10 | 2.00e-01 | 0.1177 |
| 10903 | MTMR11 | P5T-E | Human | Esophagus | ESCC | 2.70e-05 | 7.36e-02 | 0.1327 |
| 10903 | MTMR11 | P10T-E | Human | Esophagus | ESCC | 6.55e-11 | 5.19e-02 | 0.116 |
| 10903 | MTMR11 | P12T-E | Human | Esophagus | ESCC | 5.10e-04 | 6.02e-02 | 0.1122 |
| 10903 | MTMR11 | P16T-E | Human | Esophagus | ESCC | 2.17e-06 | 1.12e-01 | 0.1153 |
| 10903 | MTMR11 | P19T-E | Human | Esophagus | ESCC | 9.53e-05 | 3.22e-01 | 0.1662 |
| 10903 | MTMR11 | P21T-E | Human | Esophagus | ESCC | 1.29e-02 | 8.26e-02 | 0.1617 |
| 10903 | MTMR11 | P22T-E | Human | Esophagus | ESCC | 3.68e-02 | 5.30e-02 | 0.1236 |
| 10903 | MTMR11 | P24T-E | Human | Esophagus | ESCC | 3.74e-05 | 1.78e-01 | 0.1287 |
| Page: 1 2 3 |
| Tissue | Expression Dynamics | Abbreviation |
| Colorectum (GSE201348) |  | FAP: Familial adenomatous polyposis |
| CRC: Colorectal cancer | ||
| Colorectum (HTA11) |  | AD: Adenomas |
| SER: Sessile serrated lesions | ||
| MSI-H: Microsatellite-high colorectal cancer | ||
| MSS: Microsatellite stable colorectal cancer | ||
| Esophagus | 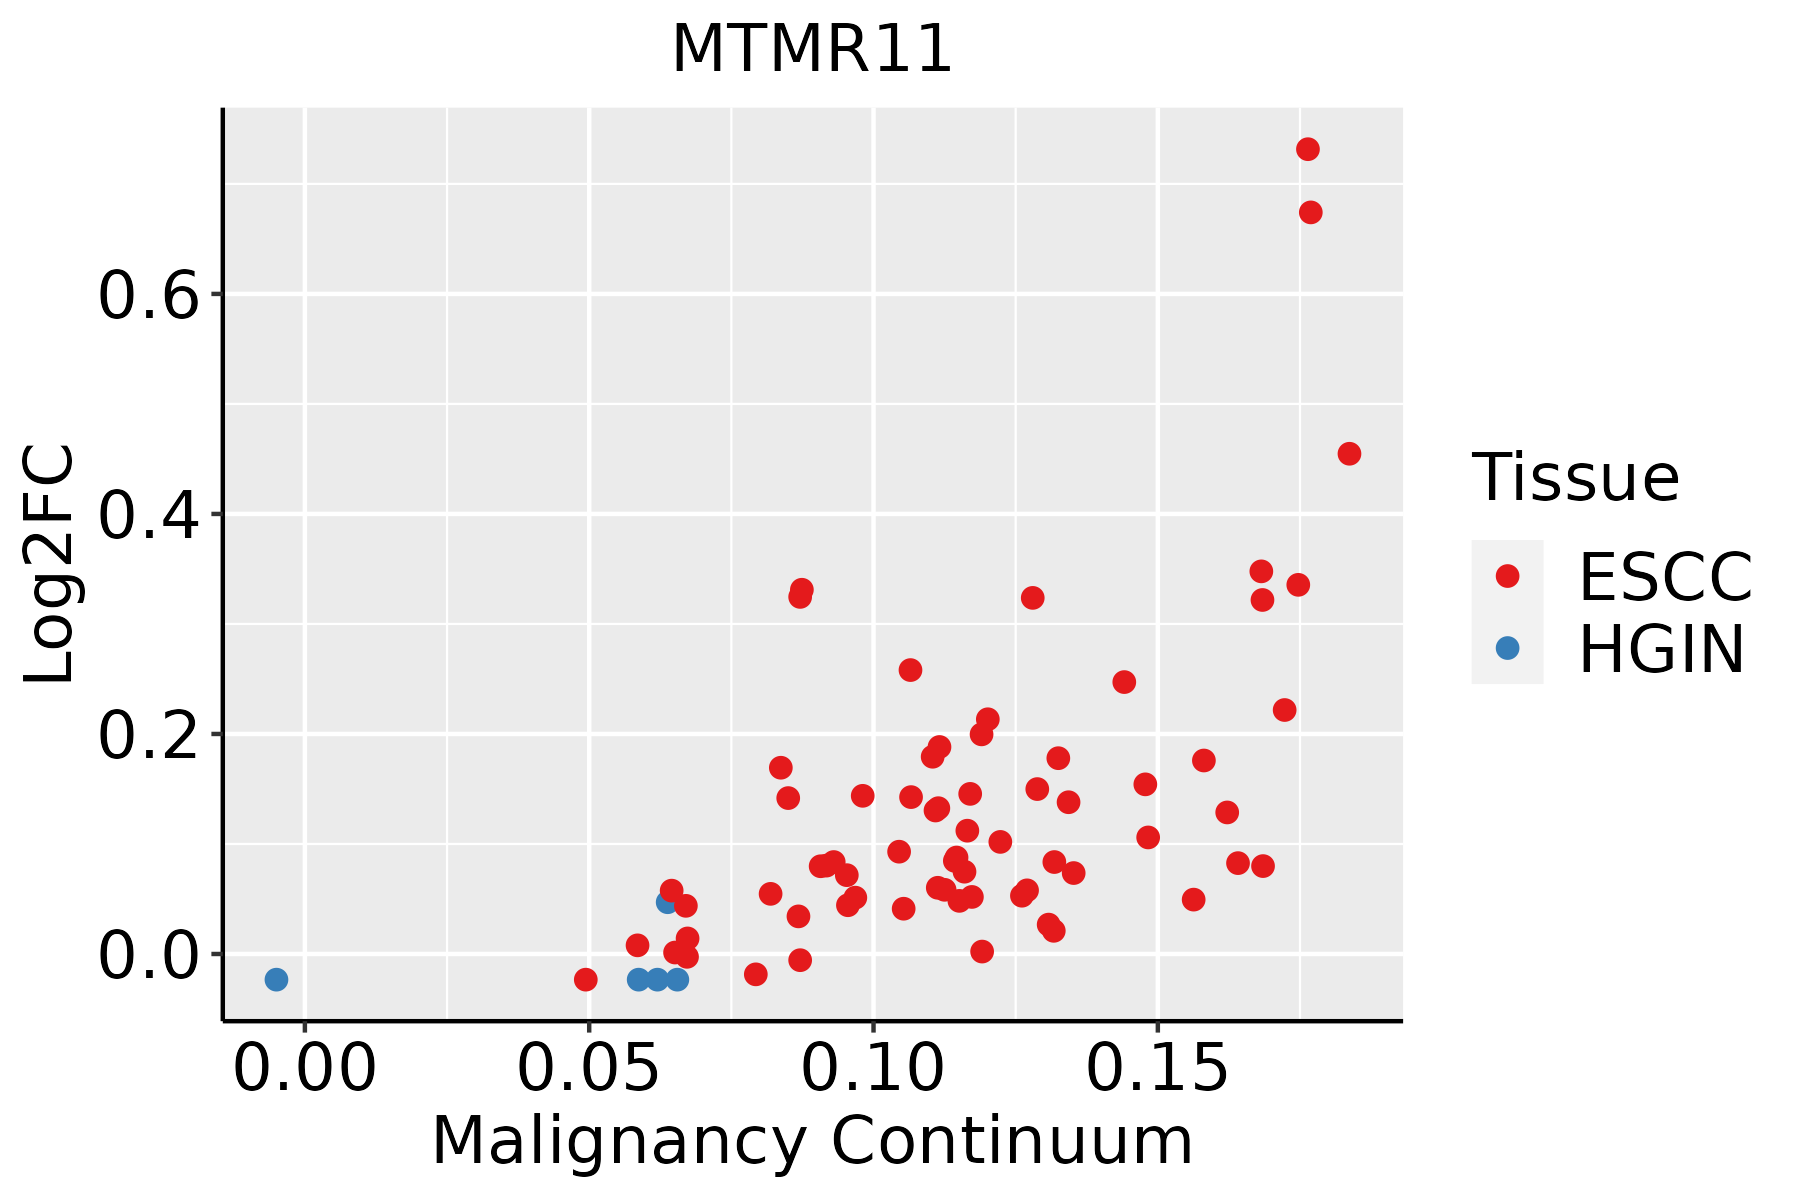 | ESCC: Esophageal squamous cell carcinoma |
| HGIN: High-grade intraepithelial neoplasias | ||
| LGIN: Low-grade intraepithelial neoplasias | ||
| Liver |  | HCC: Hepatocellular carcinoma |
| NAFLD: Non-alcoholic fatty liver disease |
| ∗log2FC in expression of this searched gene in stem-like cells from each diseased tissue sample relative to stem-like cells in normal samples in each tissue plotted against the malignancy continuum. Samples are colored based on if they are from different disease stage. |
Top |
Malignant transformation related pathway analysis |
| Find out the enriched GO biological processes and KEGG pathways involved in transition from healthy to precancer to cancer |
| Tissue | Disease Stage | Enriched GO biological Processes |
| Colorectum | AD |  |
| Colorectum | SER |  |
| Colorectum | MSS |  |
| Colorectum | MSI-H |  |
| Colorectum | FAP |  |
| ∗Top 15 enriched GO BP terms are showed in the bar plot of each disease state in each tissue. Each row represents a significant GO biological process which is colored according to the -log10(p.adjust). |
| Page: 1 2 3 4 5 6 7 8 9 |
| GO ID | Tissue | Disease Stage | Description | Gene Ratio | Bg Ratio | pvalue | p.adjust | Count |
| GO:0016311 | Colorectum | AD | dephosphorylation | 123/3918 | 417/18723 | 1.84e-05 | 3.82e-04 | 123 |
| GO:0030258 | Colorectum | AD | lipid modification | 67/3918 | 212/18723 | 1.66e-04 | 2.27e-03 | 67 |
| GO:0006650 | Colorectum | AD | glycerophospholipid metabolic process | 83/3918 | 306/18723 | 5.40e-03 | 3.55e-02 | 83 |
| GO:0006644 | Colorectum | AD | phospholipid metabolic process | 101/3918 | 383/18723 | 5.80e-03 | 3.67e-02 | 101 |
| GO:0046486 | Colorectum | SER | glycerolipid metabolic process | 82/2897 | 392/18723 | 2.26e-03 | 2.17e-02 | 82 |
| GO:00163111 | Colorectum | SER | dephosphorylation | 86/2897 | 417/18723 | 2.73e-03 | 2.46e-02 | 86 |
| GO:00066441 | Colorectum | SER | phospholipid metabolic process | 79/2897 | 383/18723 | 3.94e-03 | 3.24e-02 | 79 |
| GO:00302581 | Colorectum | SER | lipid modification | 47/2897 | 212/18723 | 6.01e-03 | 4.38e-02 | 47 |
| GO:00066501 | Colorectum | SER | glycerophospholipid metabolic process | 64/2897 | 306/18723 | 6.41e-03 | 4.60e-02 | 64 |
| GO:00302582 | Colorectum | MSS | lipid modification | 57/3467 | 212/18723 | 1.64e-03 | 1.49e-02 | 57 |
| GO:00163112 | Colorectum | MSS | dephosphorylation | 101/3467 | 417/18723 | 1.98e-03 | 1.70e-02 | 101 |
| GO:00163113 | Colorectum | FAP | dephosphorylation | 95/2622 | 417/18723 | 7.07e-07 | 3.32e-05 | 95 |
| GO:00302583 | Colorectum | FAP | lipid modification | 52/2622 | 212/18723 | 2.84e-05 | 6.49e-04 | 52 |
| GO:00066502 | Colorectum | FAP | glycerophospholipid metabolic process | 62/2622 | 306/18723 | 1.54e-03 | 1.38e-02 | 62 |
| GO:00066442 | Colorectum | FAP | phospholipid metabolic process | 74/2622 | 383/18723 | 2.24e-03 | 1.83e-02 | 74 |
| GO:001631110 | Esophagus | ESCC | dephosphorylation | 251/8552 | 417/18723 | 1.26e-09 | 2.99e-08 | 251 |
| GO:00066446 | Esophagus | ESCC | phospholipid metabolic process | 218/8552 | 383/18723 | 5.37e-06 | 5.59e-05 | 218 |
| GO:00066505 | Esophagus | ESCC | glycerophospholipid metabolic process | 174/8552 | 306/18723 | 4.92e-05 | 3.85e-04 | 174 |
| GO:00464864 | Esophagus | ESCC | glycerolipid metabolic process | 211/8552 | 392/18723 | 6.51e-04 | 3.46e-03 | 211 |
| GO:00302586 | Esophagus | ESCC | lipid modification | 116/8552 | 212/18723 | 4.90e-03 | 1.89e-02 | 116 |
| Page: 1 2 |
| Pathway ID | Tissue | Disease Stage | Description | Gene Ratio | Bg Ratio | pvalue | p.adjust | qvalue | Count |
| Page: 1 |
Top |
Cell-cell communication analysis |
| Identification of potential cell-cell interactions between two cell types and their ligand-receptor pairs for different disease states |
| Ligand | Receptor | LRpair | Pathway | Tissue | Disease Stage |
| Page: 1 |
Top |
Single-cell gene regulatory network inference analysis |
| Find out the significant the regulons (TFs) and the target genes of each regulon across cell types for different disease states |
| TF | Cell Type | Tissue | Disease Stage | Target Gene | RSS | Regulon Activity |
| ∗The dot plots of a searched regulon are shown for all cell subpopulations in each disease state of each tissue based on the regulon specific score inferred using pySCENIC and by calculating the average expression. |
| Page: 1 |
Top |
Somatic mutation of malignant transformation related genes |
| Annotation of somatic variants for genes involved in malignant transformation |
| Hugo Symbol | Variant Class | Variant Classification | dbSNP RS | HGVSc | HGVSp | HGVSp Short | SWISSPROT | BIOTYPE | SIFT | PolyPhen | Tumor Sample Barcode | Tissue | Histology | Sex | Age | Stage | Therapy Types | Drugs | Outcome |
| MTMR11 | SNV | Missense_Mutation | c.1016N>T | p.Ser339Leu | p.S339L | A4FU01 | protein_coding | deleterious(0) | probably_damaging(0.986) | TCGA-A2-A0YK-01 | Breast | breast invasive carcinoma | Female | <65 | I/II | Chemotherapy | cytoxan | SD | |
| MTMR11 | SNV | Missense_Mutation | c.95C>T | p.Pro32Leu | p.P32L | A4FU01 | protein_coding | tolerated(0.07) | benign(0) | TCGA-A8-A07O-01 | Breast | breast invasive carcinoma | Female | <65 | I/II | Chemotherapy | CR | ||
| MTMR11 | SNV | Missense_Mutation | rs373465441 | c.2056G>A | p.Asp686Asn | p.D686N | A4FU01 | protein_coding | tolerated_low_confidence(0.15) | benign(0.005) | TCGA-AR-A1AM-01 | Breast | breast invasive carcinoma | Female | <65 | III/IV | Chemotherapy | adriamycin | SD |
| MTMR11 | SNV | Missense_Mutation | rs587625914 | c.772N>T | p.Arg258Cys | p.R258C | A4FU01 | protein_coding | deleterious(0) | benign(0.398) | TCGA-AR-A251-01 | Breast | breast invasive carcinoma | Female | <65 | III/IV | Chemotherapy | doxorubicin | SD |
| MTMR11 | SNV | Missense_Mutation | c.2089G>A | p.Ala697Thr | p.A697T | A4FU01 | protein_coding | tolerated_low_confidence(0.37) | benign(0) | TCGA-D8-A1XQ-01 | Breast | breast invasive carcinoma | Female | >=65 | I/II | Unknown | Unknown | SD | |
| MTMR11 | insertion | Frame_Shift_Ins | rs587606143 | c.14_15insG | p.Arg6ProfsTer23 | p.R6Pfs*23 | A4FU01 | protein_coding | TCGA-A2-A0T2-01 | Breast | breast invasive carcinoma | Female | >=65 | III/IV | Chemotherapy | xeloda | PD | ||
| MTMR11 | insertion | Frame_Shift_Ins | novel | c.1751_1752insTATAGTTTTCTATGGGAATGAGGCGGATACAG | p.Leu585IlefsTer67 | p.L585Ifs*67 | A4FU01 | protein_coding | TCGA-AO-A0JB-01 | Breast | breast invasive carcinoma | Female | <65 | III/IV | Chemotherapy | cyclophosphamide | SD | ||
| MTMR11 | SNV | Missense_Mutation | novel | c.997G>A | p.Ala333Thr | p.A333T | A4FU01 | protein_coding | tolerated(0.4) | benign(0) | TCGA-2W-A8YY-01 | Cervix | cervical & endocervical cancer | Female | <65 | I/II | Chemotherapy | cisplatin | CR |
| MTMR11 | SNV | Missense_Mutation | novel | c.661G>A | p.Glu221Lys | p.E221K | A4FU01 | protein_coding | deleterious(0.01) | possibly_damaging(0.881) | TCGA-2W-A8YY-01 | Cervix | cervical & endocervical cancer | Female | <65 | I/II | Chemotherapy | cisplatin | CR |
| MTMR11 | SNV | Missense_Mutation | novel | c.314G>A | p.Arg105Gln | p.R105Q | A4FU01 | protein_coding | tolerated(0.19) | benign(0.003) | TCGA-2W-A8YY-01 | Cervix | cervical & endocervical cancer | Female | <65 | I/II | Chemotherapy | cisplatin | CR |
| Page: 1 2 3 4 5 6 7 8 9 10 |
Top |
Related drugs of malignant transformation related genes |
| Identification of chemicals and drugs interact with genes involved in malignant transfromation |
| (DGIdb 4.0) |
| Entrez ID | Symbol | Category | Interaction Types | Drug Claim Name | Drug Name | PMIDs |
| Page: 1 |

Copyright 2023-Present -The University of Texas Health Science Center at Houston |