
|
|||||
|
 | |
| |
| |
| |
| |
| |
|
Gene: MTMR1 |
Gene summary for MTMR1 |
| Gene information | Species | Human | Gene symbol | MTMR1 | Gene ID | 8776 |
| Gene name | myotubularin related protein 1 | |
| Gene Alias | MTMR1 | |
| Cytomap | Xq28 | |
| Gene Type | protein-coding | GO ID | GO:0006464 | UniProtAcc | F8WA39 |
Top |
Malignant transformation analysis |
| Identification of the aberrant gene expression in precancerous and cancerous lesions by comparing the gene expression of stem-like cells in diseased tissues with normal stem cells |
| Entrez ID | Symbol | Replicates | Species | Organ | Tissue | Adj P-value | Log2FC | Malignancy |
| 8776 | MTMR1 | C21 | Human | Oral cavity | OSCC | 1.60e-24 | 6.50e-01 | 0.2678 |
| 8776 | MTMR1 | C30 | Human | Oral cavity | OSCC | 4.05e-10 | 5.40e-01 | 0.3055 |
| 8776 | MTMR1 | C38 | Human | Oral cavity | OSCC | 2.51e-02 | 5.57e-01 | 0.172 |
| 8776 | MTMR1 | C43 | Human | Oral cavity | OSCC | 2.66e-17 | 3.45e-01 | 0.1704 |
| 8776 | MTMR1 | C46 | Human | Oral cavity | OSCC | 1.05e-04 | 2.36e-01 | 0.1673 |
| 8776 | MTMR1 | C08 | Human | Oral cavity | OSCC | 4.23e-09 | 2.44e-01 | 0.1919 |
| 8776 | MTMR1 | LN46 | Human | Oral cavity | OSCC | 2.02e-04 | 2.31e-01 | 0.1666 |
| 8776 | MTMR1 | EOLP-1 | Human | Oral cavity | EOLP | 2.01e-06 | 2.01e-01 | -0.0202 |
| 8776 | MTMR1 | SYSMH1 | Human | Oral cavity | OSCC | 1.20e-03 | 1.25e-01 | 0.1127 |
| 8776 | MTMR1 | SYSMH2 | Human | Oral cavity | OSCC | 1.57e-02 | 1.25e-01 | 0.2326 |
| 8776 | MTMR1 | SYSMH3 | Human | Oral cavity | OSCC | 1.14e-03 | 1.13e-01 | 0.2442 |
| 8776 | MTMR1 | SYSMH6 | Human | Oral cavity | OSCC | 3.22e-02 | 2.21e-02 | 0.1275 |
| Page: 1 |
| Tissue | Expression Dynamics | Abbreviation |
| Oral Cavity | 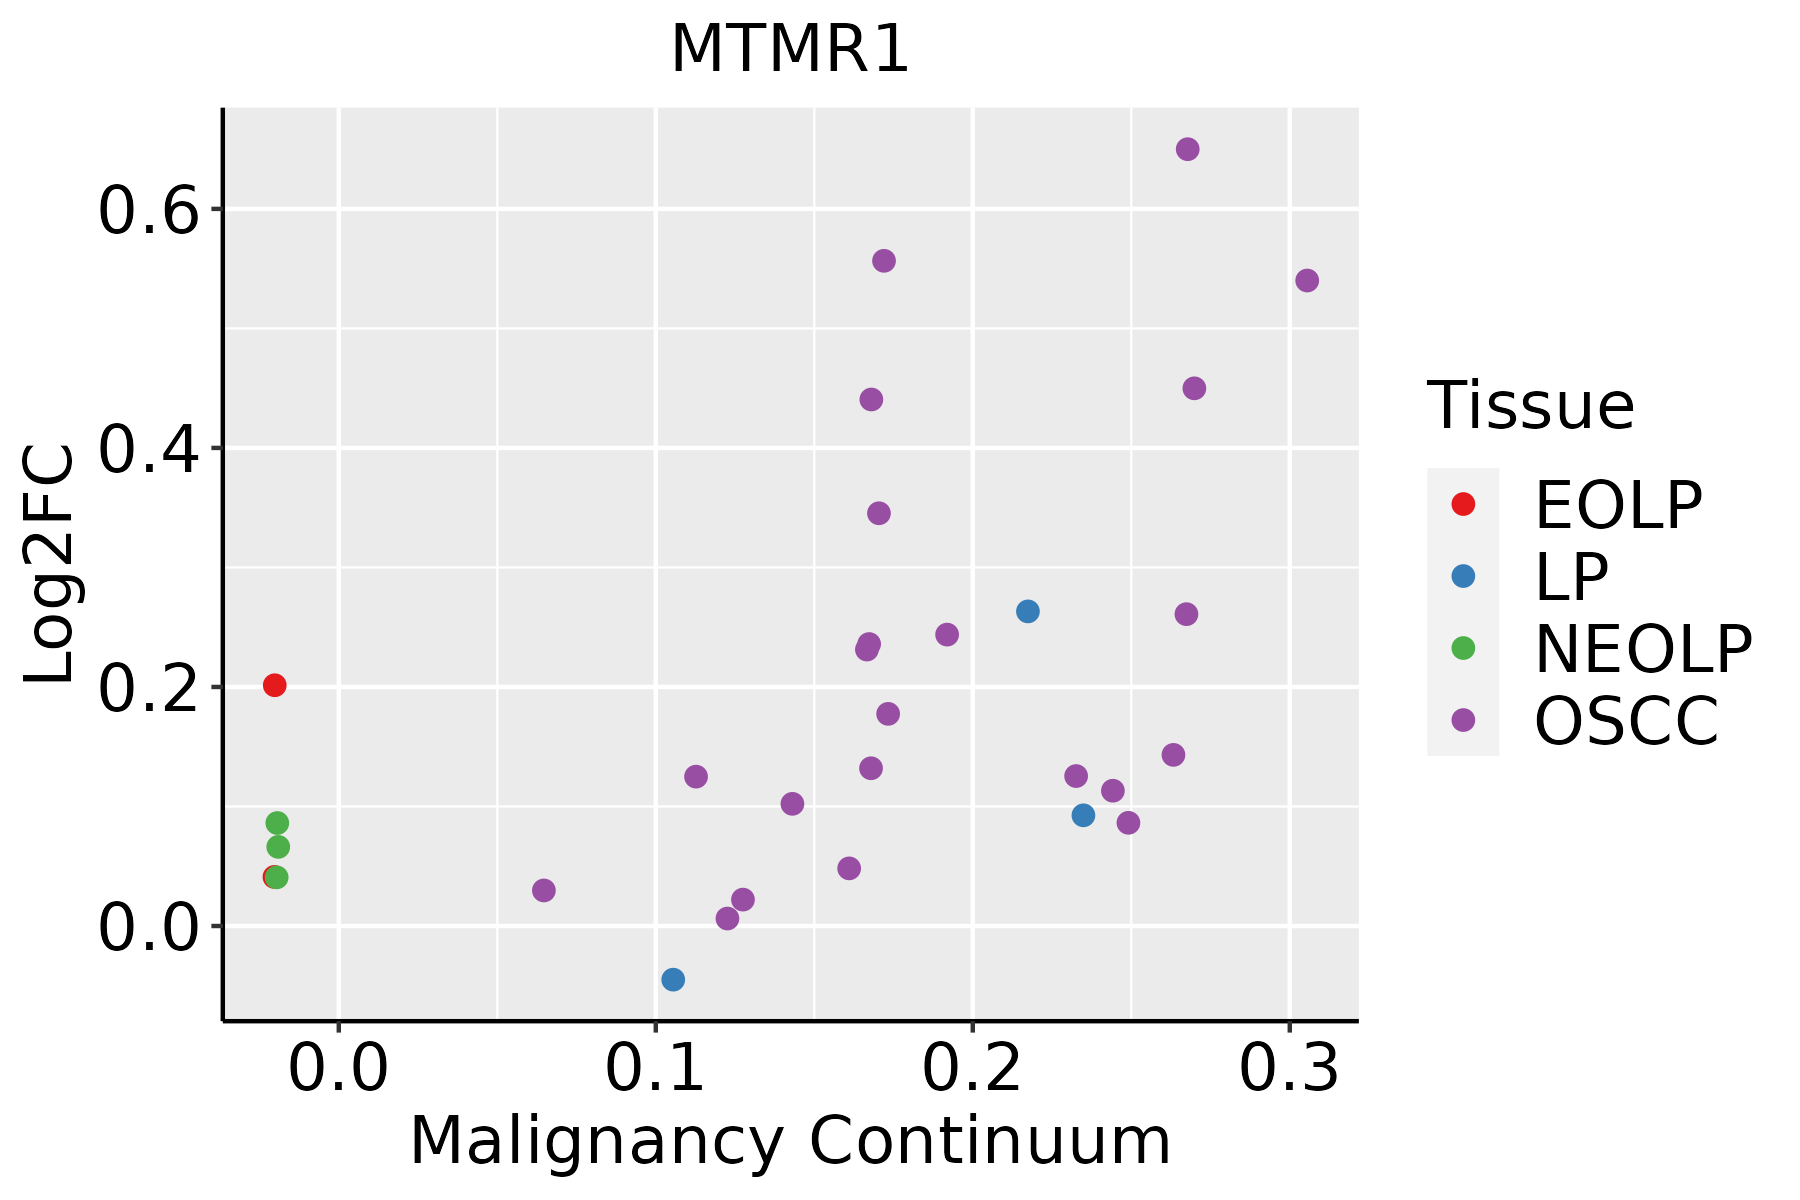 | EOLP: Erosive Oral lichen planus |
| LP: leukoplakia | ||
| NEOLP: Non-erosive oral lichen planus | ||
| OSCC: Oral squamous cell carcinoma |
| ∗log2FC in expression of this searched gene in stem-like cells from each diseased tissue sample relative to stem-like cells in normal samples in each tissue plotted against the malignancy continuum. Samples are colored based on if they are from different disease stage. |
Top |
Malignant transformation related pathway analysis |
| Find out the enriched GO biological processes and KEGG pathways involved in transition from healthy to precancer to cancer |
| Tissue | Disease Stage | Enriched GO biological Processes |
| Colorectum | AD |  |
| Colorectum | SER |  |
| Colorectum | MSS |  |
| Colorectum | MSI-H |  |
| Colorectum | FAP |  |
| ∗Top 15 enriched GO BP terms are showed in the bar plot of each disease state in each tissue. Each row represents a significant GO biological process which is colored according to the -log10(p.adjust). |
| Page: 1 2 3 4 5 6 7 8 9 |
| GO ID | Tissue | Disease Stage | Description | Gene Ratio | Bg Ratio | pvalue | p.adjust | Count |
| GO:0016311 | Colorectum | AD | dephosphorylation | 123/3918 | 417/18723 | 1.84e-05 | 3.82e-04 | 123 |
| GO:0030258 | Colorectum | AD | lipid modification | 67/3918 | 212/18723 | 1.66e-04 | 2.27e-03 | 67 |
| GO:0006650 | Colorectum | AD | glycerophospholipid metabolic process | 83/3918 | 306/18723 | 5.40e-03 | 3.55e-02 | 83 |
| GO:0006644 | Colorectum | AD | phospholipid metabolic process | 101/3918 | 383/18723 | 5.80e-03 | 3.67e-02 | 101 |
| GO:0046486 | Colorectum | SER | glycerolipid metabolic process | 82/2897 | 392/18723 | 2.26e-03 | 2.17e-02 | 82 |
| GO:00163111 | Colorectum | SER | dephosphorylation | 86/2897 | 417/18723 | 2.73e-03 | 2.46e-02 | 86 |
| GO:00066441 | Colorectum | SER | phospholipid metabolic process | 79/2897 | 383/18723 | 3.94e-03 | 3.24e-02 | 79 |
| GO:00302581 | Colorectum | SER | lipid modification | 47/2897 | 212/18723 | 6.01e-03 | 4.38e-02 | 47 |
| GO:00066501 | Colorectum | SER | glycerophospholipid metabolic process | 64/2897 | 306/18723 | 6.41e-03 | 4.60e-02 | 64 |
| GO:00302582 | Colorectum | MSS | lipid modification | 57/3467 | 212/18723 | 1.64e-03 | 1.49e-02 | 57 |
| GO:00163112 | Colorectum | MSS | dephosphorylation | 101/3467 | 417/18723 | 1.98e-03 | 1.70e-02 | 101 |
| GO:00163113 | Colorectum | FAP | dephosphorylation | 95/2622 | 417/18723 | 7.07e-07 | 3.32e-05 | 95 |
| GO:00302583 | Colorectum | FAP | lipid modification | 52/2622 | 212/18723 | 2.84e-05 | 6.49e-04 | 52 |
| GO:00066502 | Colorectum | FAP | glycerophospholipid metabolic process | 62/2622 | 306/18723 | 1.54e-03 | 1.38e-02 | 62 |
| GO:00066442 | Colorectum | FAP | phospholipid metabolic process | 74/2622 | 383/18723 | 2.24e-03 | 1.83e-02 | 74 |
| GO:19019984 | Endometrium | EEC | toxin transport | 11/2168 | 40/18723 | 4.65e-03 | 2.97e-02 | 11 |
| GO:001623617 | Esophagus | ESCC | macroautophagy | 216/8552 | 291/18723 | 1.94e-23 | 4.57e-21 | 216 |
| GO:001631110 | Esophagus | ESCC | dephosphorylation | 251/8552 | 417/18723 | 1.26e-09 | 2.99e-08 | 251 |
| GO:00086544 | Esophagus | ESCC | phospholipid biosynthetic process | 162/8552 | 253/18723 | 2.59e-09 | 5.73e-08 | 162 |
| GO:000647018 | Esophagus | ESCC | protein dephosphorylation | 177/8552 | 281/18723 | 3.13e-09 | 6.72e-08 | 177 |
| Page: 1 2 3 |
| Pathway ID | Tissue | Disease Stage | Description | Gene Ratio | Bg Ratio | pvalue | p.adjust | qvalue | Count |
| Page: 1 |
Top |
Cell-cell communication analysis |
| Identification of potential cell-cell interactions between two cell types and their ligand-receptor pairs for different disease states |
| Ligand | Receptor | LRpair | Pathway | Tissue | Disease Stage |
| Page: 1 |
Top |
Single-cell gene regulatory network inference analysis |
| Find out the significant the regulons (TFs) and the target genes of each regulon across cell types for different disease states |
| TF | Cell Type | Tissue | Disease Stage | Target Gene | RSS | Regulon Activity |
| ∗The dot plots of a searched regulon are shown for all cell subpopulations in each disease state of each tissue based on the regulon specific score inferred using pySCENIC and by calculating the average expression. |
| Page: 1 |
Top |
Somatic mutation of malignant transformation related genes |
| Annotation of somatic variants for genes involved in malignant transformation |
| Hugo Symbol | Variant Class | Variant Classification | dbSNP RS | HGVSc | HGVSp | HGVSp Short | SWISSPROT | BIOTYPE | SIFT | PolyPhen | Tumor Sample Barcode | Tissue | Histology | Sex | Age | Stage | Therapy Types | Drugs | Outcome |
| MTMR1 | SNV | Missense_Mutation | novel | c.1256N>G | p.Glu419Gly | p.E419G | protein_coding | deleterious(0.01) | benign(0.196) | TCGA-B6-A0WV-01 | Breast | breast invasive carcinoma | Female | >=65 | I/II | Unknown | Unknown | SD | |
| MTMR1 | SNV | Missense_Mutation | c.1306N>C | p.Glu436Gln | p.E436Q | protein_coding | deleterious(0.01) | benign(0.315) | TCGA-C8-A26V-01 | Breast | breast invasive carcinoma | Female | <65 | III/IV | Hormone Therapy | tamoxiphen | CR | ||
| MTMR1 | SNV | Missense_Mutation | novel | c.1189N>C | p.Glu397Gln | p.E397Q | protein_coding | deleterious(0.01) | benign(0.101) | TCGA-C5-A1MH-01 | Cervix | cervical & endocervical cancer | Female | >=65 | III/IV | Chemotherapy | cisplatin | PD | |
| MTMR1 | SNV | Missense_Mutation | novel | c.1674C>G | p.Phe558Leu | p.F558L | protein_coding | tolerated(0.52) | benign(0) | TCGA-FU-A40J-01 | Cervix | cervical & endocervical cancer | Female | <65 | III/IV | Chemotherapy | carboplatin | CR | |
| MTMR1 | SNV | Missense_Mutation | c.1322N>T | p.Ser441Phe | p.S441F | protein_coding | deleterious(0) | probably_damaging(1) | TCGA-Q1-A73O-01 | Cervix | cervical & endocervical cancer | Female | <65 | I/II | Chemotherapy | cisplatin | CR | ||
| MTMR1 | SNV | Missense_Mutation | novel | c.640C>A | p.Pro214Thr | p.P214T | protein_coding | deleterious(0) | possibly_damaging(0.862) | TCGA-VS-A8Q9-01 | Cervix | cervical & endocervical cancer | Female | >=65 | I/II | Unknown | Unknown | SD | |
| MTMR1 | SNV | Missense_Mutation | c.926N>T | p.Thr309Met | p.T309M | protein_coding | deleterious(0) | probably_damaging(0.946) | TCGA-AA-3492-01 | Colorectum | colon adenocarcinoma | Female | >=65 | I/II | Unknown | Unknown | SD | ||
| MTMR1 | SNV | Missense_Mutation | c.1066N>A | p.Ala356Thr | p.A356T | protein_coding | deleterious(0) | probably_damaging(0.991) | TCGA-AA-3848-01 | Colorectum | colon adenocarcinoma | Female | >=65 | III/IV | Unknown | Unknown | PD | ||
| MTMR1 | SNV | Missense_Mutation | c.1801N>A | p.His601Asn | p.H601N | protein_coding | tolerated(0.07) | benign(0.007) | TCGA-AA-3977-01 | Colorectum | colon adenocarcinoma | Male | >=65 | I/II | Unknown | Unknown | SD | ||
| MTMR1 | SNV | Missense_Mutation | c.737N>T | p.Arg246Ile | p.R246I | protein_coding | deleterious(0) | probably_damaging(0.992) | TCGA-AA-A00N-01 | Colorectum | colon adenocarcinoma | Male | >=65 | I/II | Unknown | Unknown | PD |
| Page: 1 2 3 4 5 6 7 8 |
Top |
Related drugs of malignant transformation related genes |
| Identification of chemicals and drugs interact with genes involved in malignant transfromation |
| (DGIdb 4.0) |
| Entrez ID | Symbol | Category | Interaction Types | Drug Claim Name | Drug Name | PMIDs |
| Page: 1 |

Copyright 2023-Present -The University of Texas Health Science Center at Houston |