
|
|||||
|
 | |
| |
| |
| |
| |
| |
|
Gene: MTLN |
Gene summary for MTLN |
| Gene information | Species | Human | Gene symbol | MTLN | Gene ID | 205251 |
| Gene name | mitoregulin | |
| Gene Alias | LEMP | |
| Cytomap | 2q13 | |
| Gene Type | protein-coding | GO ID | GO:0006082 | UniProtAcc | NA |
Top |
Malignant transformation analysis |
| Identification of the aberrant gene expression in precancerous and cancerous lesions by comparing the gene expression of stem-like cells in diseased tissues with normal stem cells |
| Entrez ID | Symbol | Replicates | Species | Organ | Tissue | Adj P-value | Log2FC | Malignancy |
| 205251 | MTLN | HTA11_1938_2000001011 | Human | Colorectum | AD | 2.86e-06 | 2.32e-01 | -0.0811 |
| 205251 | MTLN | HTA11_347_2000001011 | Human | Colorectum | AD | 8.65e-04 | 1.18e-01 | -0.1954 |
| 205251 | MTLN | HTA11_3361_2000001011 | Human | Colorectum | AD | 3.26e-04 | 2.24e-01 | -0.1207 |
| 205251 | MTLN | HTA11_83_2000001011 | Human | Colorectum | SER | 2.04e-02 | 1.49e-01 | -0.1526 |
| 205251 | MTLN | HTA11_696_2000001011 | Human | Colorectum | AD | 2.03e-09 | 2.28e-01 | -0.1464 |
| 205251 | MTLN | HTA11_866_2000001011 | Human | Colorectum | AD | 8.13e-03 | 1.02e-01 | -0.1001 |
| 205251 | MTLN | HTA11_1391_2000001011 | Human | Colorectum | AD | 1.27e-06 | 1.75e-01 | -0.059 |
| 205251 | MTLN | HTA11_5212_2000001011 | Human | Colorectum | AD | 3.97e-04 | 2.15e-01 | -0.2061 |
| 205251 | MTLN | HTA11_5216_2000001011 | Human | Colorectum | SER | 3.40e-03 | 2.52e-01 | -0.1462 |
| 205251 | MTLN | HTA11_546_2000001011 | Human | Colorectum | AD | 1.56e-06 | 2.60e-01 | -0.0842 |
| 205251 | MTLN | HTA11_7862_2000001011 | Human | Colorectum | AD | 1.24e-02 | 1.79e-01 | -0.0179 |
| 205251 | MTLN | HTA11_866_3004761011 | Human | Colorectum | AD | 2.04e-08 | 2.11e-01 | 0.096 |
| 205251 | MTLN | HTA11_8622_2000001021 | Human | Colorectum | SER | 6.14e-04 | 2.05e-01 | 0.0528 |
| 205251 | MTLN | HTA11_7696_3000711011 | Human | Colorectum | AD | 2.07e-07 | 1.70e-01 | 0.0674 |
| 205251 | MTLN | HTA11_6818_2000001021 | Human | Colorectum | AD | 3.09e-05 | 1.94e-01 | 0.0588 |
| 205251 | MTLN | LZE2D | Human | Esophagus | HGIN | 3.64e-03 | 3.22e-01 | 0.0642 |
| 205251 | MTLN | LZE2T | Human | Esophagus | ESCC | 1.52e-08 | 1.10e+00 | 0.082 |
| 205251 | MTLN | LZE4T | Human | Esophagus | ESCC | 3.08e-23 | 6.37e-01 | 0.0811 |
| 205251 | MTLN | LZE5T | Human | Esophagus | ESCC | 4.24e-14 | 9.11e-01 | 0.0514 |
| 205251 | MTLN | LZE7T | Human | Esophagus | ESCC | 1.13e-24 | 9.14e-01 | 0.0667 |
| Page: 1 2 3 |
| Tissue | Expression Dynamics | Abbreviation |
| Colorectum (GSE201348) |  | FAP: Familial adenomatous polyposis |
| CRC: Colorectal cancer | ||
| Colorectum (HTA11) |  | AD: Adenomas |
| SER: Sessile serrated lesions | ||
| MSI-H: Microsatellite-high colorectal cancer | ||
| MSS: Microsatellite stable colorectal cancer | ||
| Esophagus | 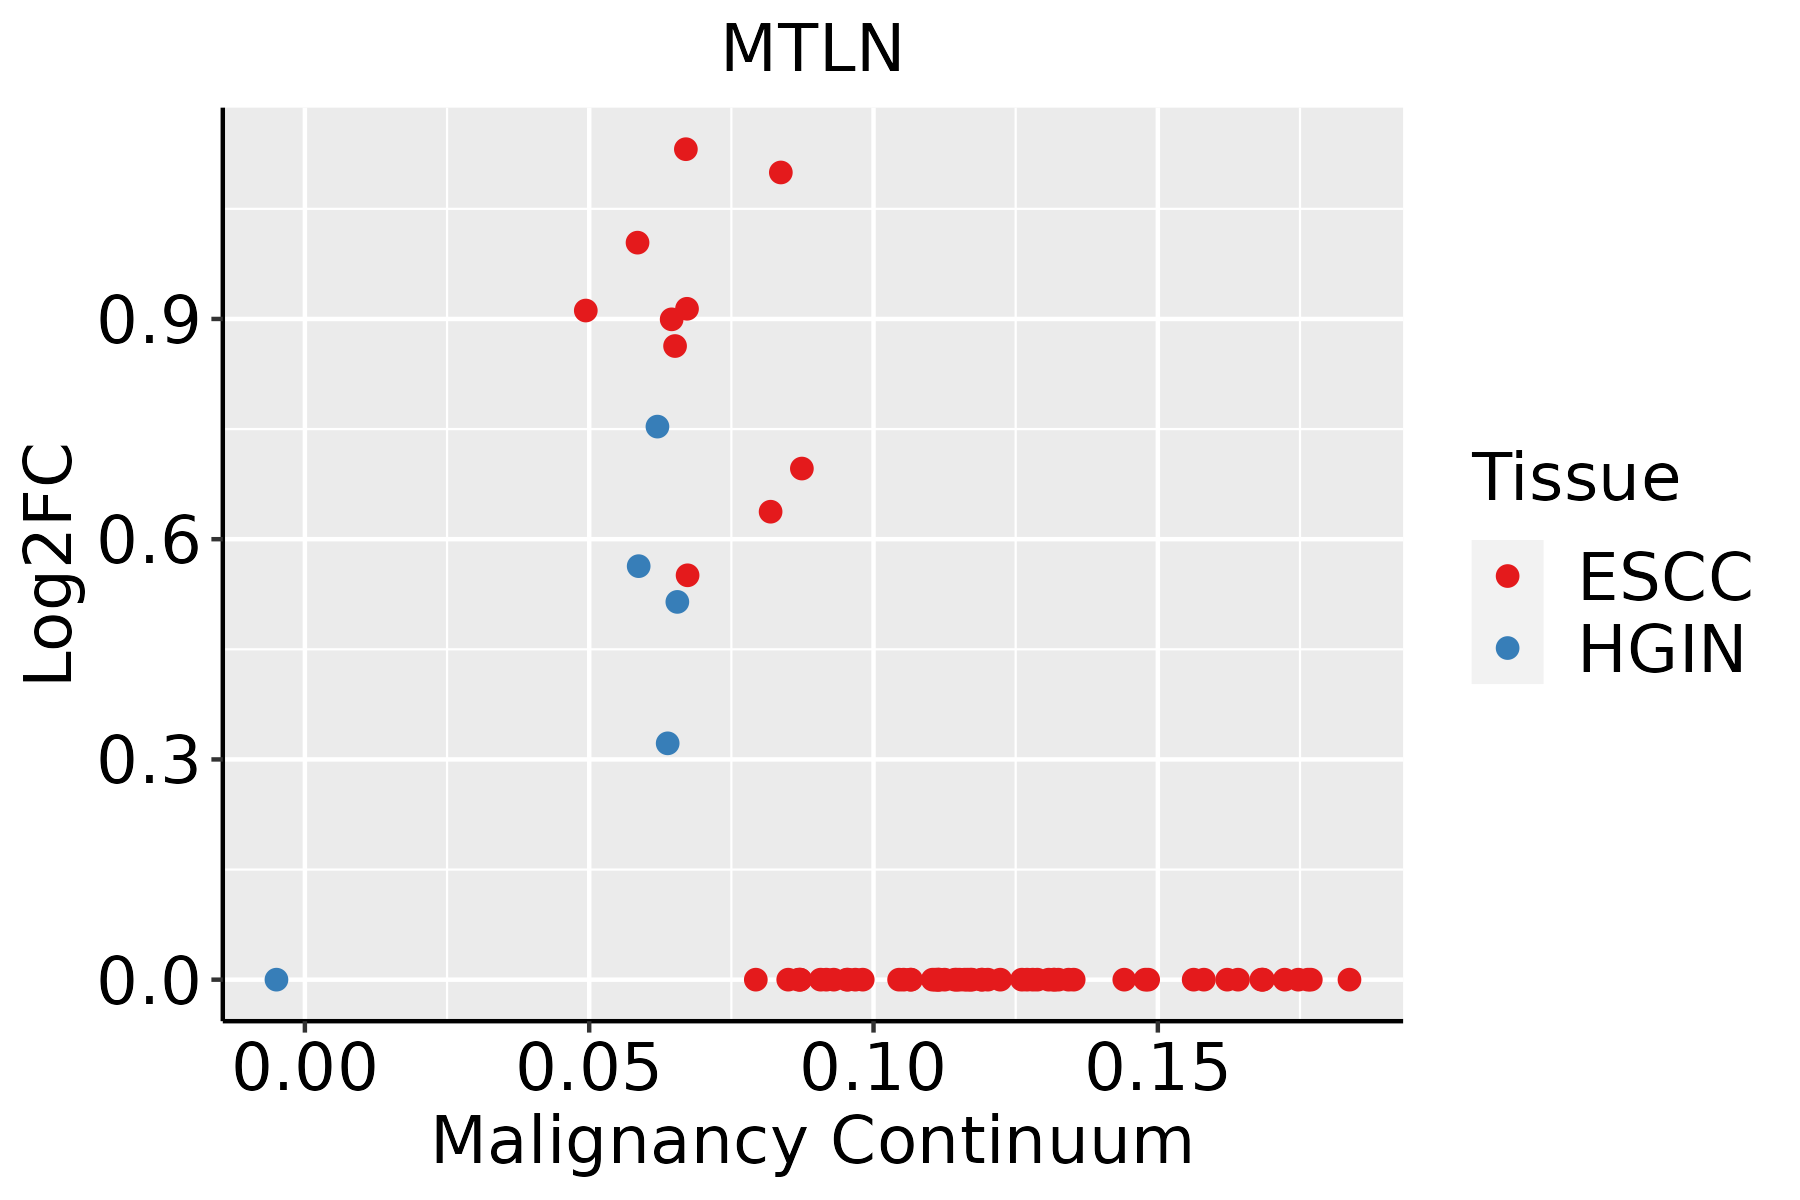 | ESCC: Esophageal squamous cell carcinoma |
| HGIN: High-grade intraepithelial neoplasias | ||
| LGIN: Low-grade intraepithelial neoplasias | ||
| GC | 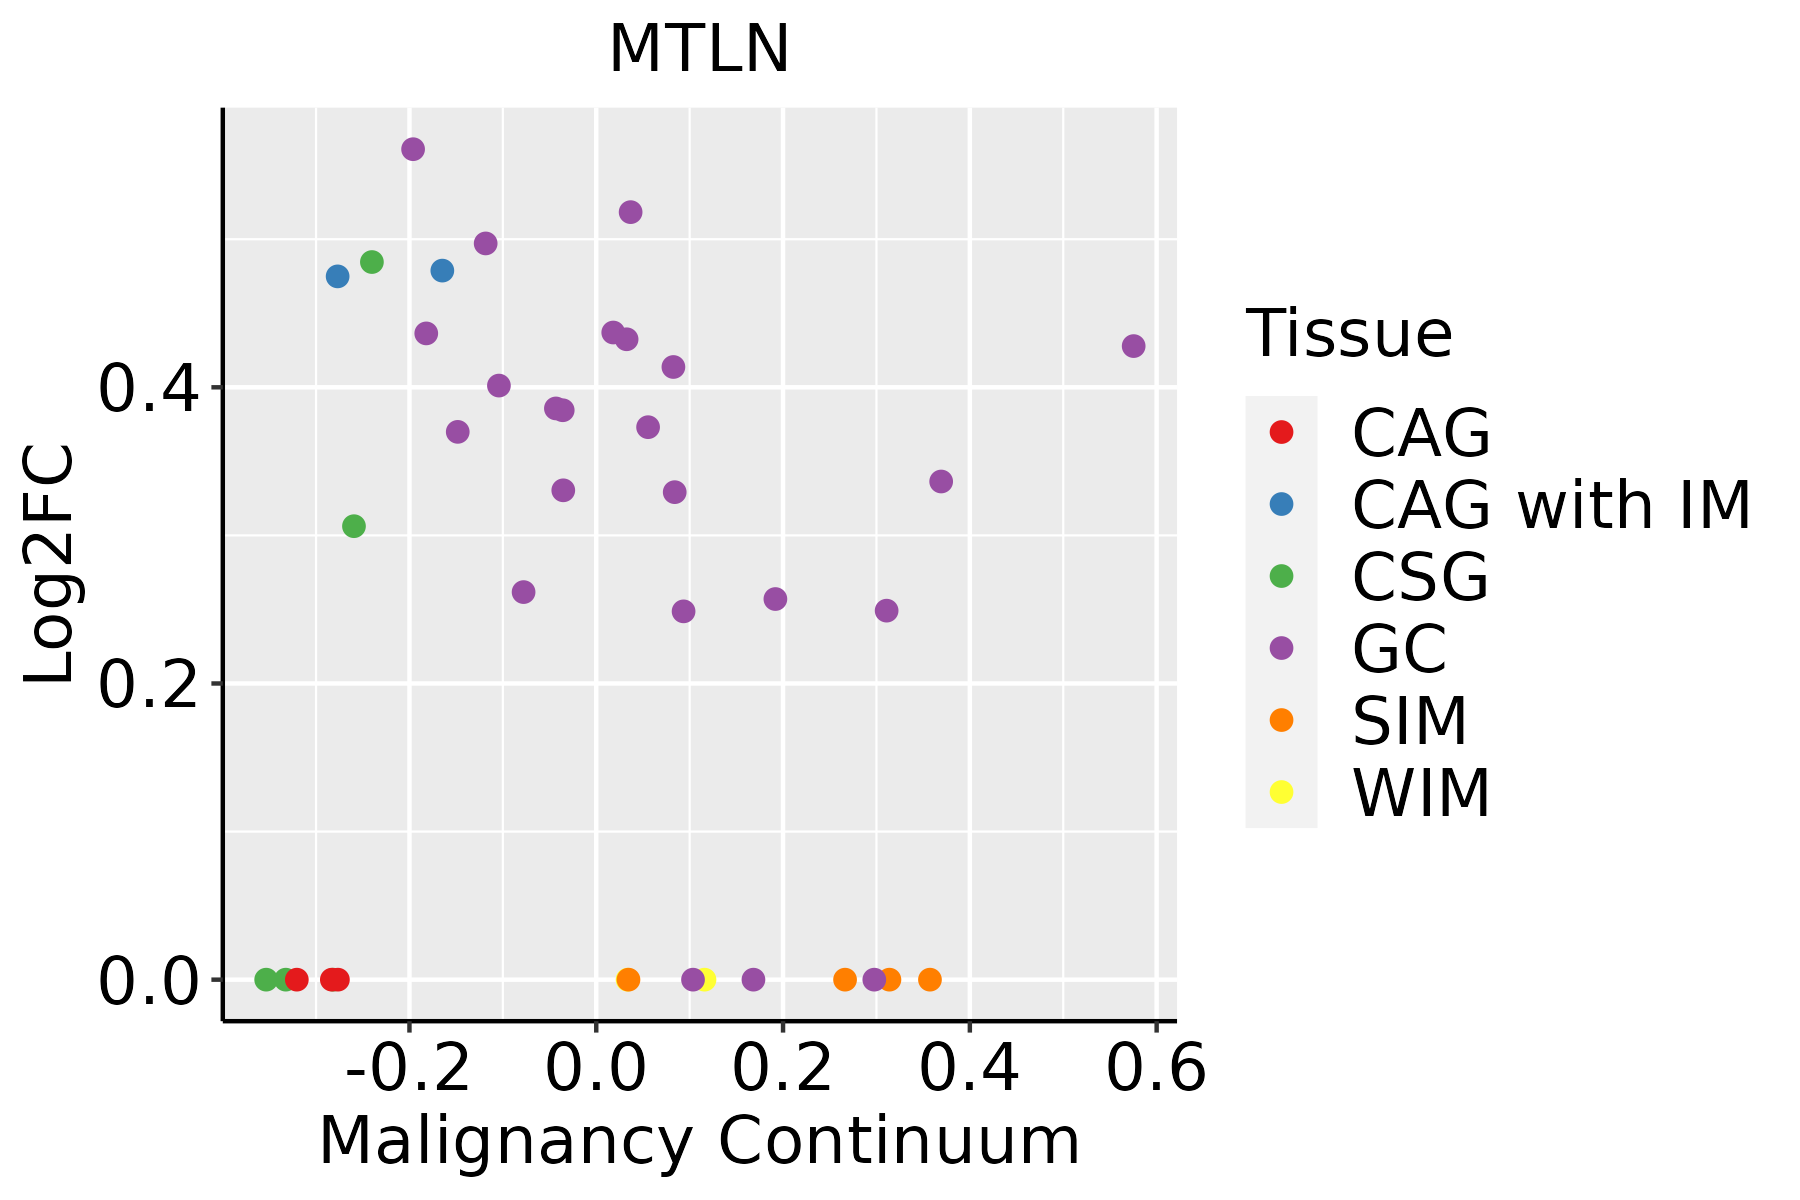 | CAG: Chronic atrophic gastritis |
| CAG with IM: Chronic atrophic gastritis with intestinal metaplasia | ||
| CSG: Chronic superficial gastritis | ||
| GC: Gastric cancer | ||
| SIM: Severe intestinal metaplasia | ||
| WIM: Wild intestinal metaplasia |
| ∗log2FC in expression of this searched gene in stem-like cells from each diseased tissue sample relative to stem-like cells in normal samples in each tissue plotted against the malignancy continuum. Samples are colored based on if they are from different disease stage. |
Top |
Malignant transformation related pathway analysis |
| Find out the enriched GO biological processes and KEGG pathways involved in transition from healthy to precancer to cancer |
| Tissue | Disease Stage | Enriched GO biological Processes |
| Colorectum | AD |  |
| Colorectum | SER |  |
| Colorectum | MSS |  |
| Colorectum | MSI-H |  |
| Colorectum | FAP |  |
| ∗Top 15 enriched GO BP terms are showed in the bar plot of each disease state in each tissue. Each row represents a significant GO biological process which is colored according to the -log10(p.adjust). |
| Page: 1 2 3 4 5 6 7 8 9 |
| GO ID | Tissue | Disease Stage | Description | Gene Ratio | Bg Ratio | pvalue | p.adjust | Count |
| GO:0006091 | Colorectum | AD | generation of precursor metabolites and energy | 209/3918 | 490/18723 | 3.17e-28 | 6.61e-25 | 209 |
| GO:0045333 | Colorectum | AD | cellular respiration | 119/3918 | 230/18723 | 3.21e-25 | 4.02e-22 | 119 |
| GO:0015980 | Colorectum | AD | energy derivation by oxidation of organic compounds | 143/3918 | 318/18723 | 2.78e-22 | 2.49e-19 | 143 |
| GO:0009896 | Colorectum | AD | positive regulation of catabolic process | 180/3918 | 492/18723 | 4.33e-16 | 1.94e-13 | 180 |
| GO:0031331 | Colorectum | AD | positive regulation of cellular catabolic process | 156/3918 | 427/18723 | 4.68e-14 | 1.05e-11 | 156 |
| GO:0043254 | Colorectum | AD | regulation of protein-containing complex assembly | 148/3918 | 428/18723 | 2.64e-11 | 3.18e-09 | 148 |
| GO:0031334 | Colorectum | AD | positive regulation of protein-containing complex assembly | 91/3918 | 237/18723 | 4.78e-10 | 3.99e-08 | 91 |
| GO:0044282 | Colorectum | AD | small molecule catabolic process | 118/3918 | 376/18723 | 1.05e-06 | 3.55e-05 | 118 |
| GO:0006635 | Colorectum | AD | fatty acid beta-oxidation | 33/3918 | 74/18723 | 3.98e-06 | 1.09e-04 | 33 |
| GO:0009062 | Colorectum | AD | fatty acid catabolic process | 41/3918 | 100/18723 | 4.02e-06 | 1.09e-04 | 41 |
| GO:0019395 | Colorectum | AD | fatty acid oxidation | 40/3918 | 103/18723 | 2.43e-05 | 4.69e-04 | 40 |
| GO:0016042 | Colorectum | AD | lipid catabolic process | 97/3918 | 320/18723 | 4.31e-05 | 7.56e-04 | 97 |
| GO:0006631 | Colorectum | AD | fatty acid metabolic process | 114/3918 | 390/18723 | 5.58e-05 | 9.44e-04 | 114 |
| GO:0072329 | Colorectum | AD | monocarboxylic acid catabolic process | 44/3918 | 122/18723 | 8.05e-05 | 1.28e-03 | 44 |
| GO:0034440 | Colorectum | AD | lipid oxidation | 40/3918 | 108/18723 | 8.52e-05 | 1.32e-03 | 40 |
| GO:0030258 | Colorectum | AD | lipid modification | 67/3918 | 212/18723 | 1.66e-04 | 2.27e-03 | 67 |
| GO:0051881 | Colorectum | AD | regulation of mitochondrial membrane potential | 29/3918 | 74/18723 | 2.54e-04 | 3.20e-03 | 29 |
| GO:0016054 | Colorectum | AD | organic acid catabolic process | 73/3918 | 240/18723 | 3.20e-04 | 3.81e-03 | 73 |
| GO:0044242 | Colorectum | AD | cellular lipid catabolic process | 66/3918 | 214/18723 | 3.96e-04 | 4.50e-03 | 66 |
| GO:0046395 | Colorectum | AD | carboxylic acid catabolic process | 70/3918 | 236/18723 | 9.06e-04 | 8.71e-03 | 70 |
| Page: 1 2 3 4 5 6 7 |
| Pathway ID | Tissue | Disease Stage | Description | Gene Ratio | Bg Ratio | pvalue | p.adjust | qvalue | Count |
| Page: 1 |
Top |
Cell-cell communication analysis |
| Identification of potential cell-cell interactions between two cell types and their ligand-receptor pairs for different disease states |
| Ligand | Receptor | LRpair | Pathway | Tissue | Disease Stage |
| Page: 1 |
Top |
Single-cell gene regulatory network inference analysis |
| Find out the significant the regulons (TFs) and the target genes of each regulon across cell types for different disease states |
| TF | Cell Type | Tissue | Disease Stage | Target Gene | RSS | Regulon Activity |
| ∗The dot plots of a searched regulon are shown for all cell subpopulations in each disease state of each tissue based on the regulon specific score inferred using pySCENIC and by calculating the average expression. |
| Page: 1 |
Top |
Somatic mutation of malignant transformation related genes |
| Annotation of somatic variants for genes involved in malignant transformation |
| Hugo Symbol | Variant Class | Variant Classification | dbSNP RS | HGVSc | HGVSp | HGVSp Short | SWISSPROT | BIOTYPE | SIFT | PolyPhen | Tumor Sample Barcode | Tissue | Histology | Sex | Age | Stage | Therapy Types | Drugs | Outcome |
| Page: 1 |
Top |
Related drugs of malignant transformation related genes |
| Identification of chemicals and drugs interact with genes involved in malignant transfromation |
| (DGIdb 4.0) |
| Entrez ID | Symbol | Category | Interaction Types | Drug Claim Name | Drug Name | PMIDs |
| Page: 1 |

Copyright 2023-Present -The University of Texas Health Science Center at Houston |