Schematic overview of the cellular and molecular mechanisms involved in the cancer progression, including the proposed cellular and molecular mechanisms in cancer cells trajectory. AT1: alveolar type 1 cells; AT2: alveolar type 2 cells; AAH: atypical adenomatous hyperplasia; AIS: adenocarcinoma in situ; MIA: minimally invasive adenocarcinoma; IA: invasive adenocarcinoma; EMT: epithelial-mesenchymal transition

Home

Download

Statistics

Help

Contact

Center for Computational Systems Medicine
leaf

Gene summary

leaf

Malignant transformation analysis

leaf

Malignant transformation related pathway analysis

leaf

Cell-cell communication analysis

leaf

Single-cell gene regulatory network inference analysis

leaf

Somatic mutation of malignant transformation related genes

leaf

Related drugs of malignant transformation related genes

Gene: MTIF2

Gene summary for MTIF2

check button Gene summary.

Gene informationSpeciesHuman
Gene symbol

MTIF2

Gene ID

4528

Gene namemitochondrial translational initiation factor 2
Gene AliasMTIF2
Cytomap2p16.1
Gene Typeprotein-coding
GO ID

GO:0006412

UniProtAcc

P46199


Top

Malignant transformation analysis

check button Identification of the aberrant gene expression in precancerous and cancerous lesions by comparing the gene expression of stem-like cells in diseased tissues with normal stem cells
check button Malignant transformation involving gene list.
Entrez IDSymbolReplicatesSpeciesOrganTissueAdj P-valueLog2FCMalignancy
4528MTIF2HTA11_347_2000001011HumanColorectumAD1.16e-125.42e-01-0.1954
4528MTIF2A015-C-203HumanColorectumFAP2.71e-081.02e-02-0.1294
4528MTIF2A001-C-108HumanColorectumFAP3.54e-031.12e-01-0.0272
4528MTIF2A002-C-205HumanColorectumFAP6.12e-036.08e-02-0.1236
4528MTIF2A015-C-006HumanColorectumFAP8.65e-042.74e-01-0.0994
4528MTIF2A002-C-114HumanColorectumFAP1.81e-021.49e-01-0.1561
4528MTIF2A015-C-104HumanColorectumFAP4.03e-097.33e-02-0.1899
4528MTIF2A002-C-016HumanColorectumFAP3.54e-044.46e-030.0521
4528MTIF2A002-C-116HumanColorectumFAP5.31e-09-9.12e-02-0.0452
4528MTIF2A018-E-020HumanColorectumFAP9.22e-03-3.95e-02-0.2034
4528MTIF2F034HumanColorectumFAP1.09e-036.92e-02-0.0665
4528MTIF2CRC-1-8810HumanColorectumCRC3.60e-03-8.54e-020.6257
4528MTIF2CRC-3-11773HumanColorectumCRC3.18e-02-7.31e-020.2564
4528MTIF2LZE2THumanEsophagusESCC1.76e-044.44e-010.082
4528MTIF2LZE4THumanEsophagusESCC1.65e-132.83e-010.0811
4528MTIF2LZE8THumanEsophagusESCC4.69e-025.11e-020.067
4528MTIF2LZE24THumanEsophagusESCC1.77e-103.03e-010.0596
4528MTIF2LZE6THumanEsophagusESCC5.80e-031.02e-010.0845
4528MTIF2P1T-EHumanEsophagusESCC4.56e-053.45e-010.0875
4528MTIF2P2T-EHumanEsophagusESCC5.35e-255.30e-010.1177
Page: 1 2 3 4 5 6 

check button Transcriptomic changes along malignancy continuum.
TissueExpression DynamicsAbbreviation
Colorectum (GSE201348)The image shows the transcriptomic changes along malignancy continuum.log2FC in expression of this searched gene in stem-like cells from each diseased tissue sample relative to stem-like cells in normal samples in each tissue plotted against the malignancy continuum. Samples are colored based on if they are from different disease stage.FAP: Familial adenomatous polyposis
CRC: Colorectal cancer
Colorectum (HTA11)The image shows the transcriptomic changes along malignancy continuum.log2FC in expression of this searched gene in stem-like cells from each diseased tissue sample relative to stem-like cells in normal samples in each tissue plotted against the malignancy continuum. Samples are colored based on if they are from different disease stage.AD: Adenomas
SER: Sessile serrated lesions
MSI-H: Microsatellite-high colorectal cancer
MSS: Microsatellite stable colorectal cancer
EsophagusThe image shows the transcriptomic changes along malignancy continuum.log2FC in expression of this searched gene in stem-like cells from each diseased tissue sample relative to stem-like cells in normal samples in each tissue plotted against the malignancy continuum. Samples are colored based on if they are from different disease stage.
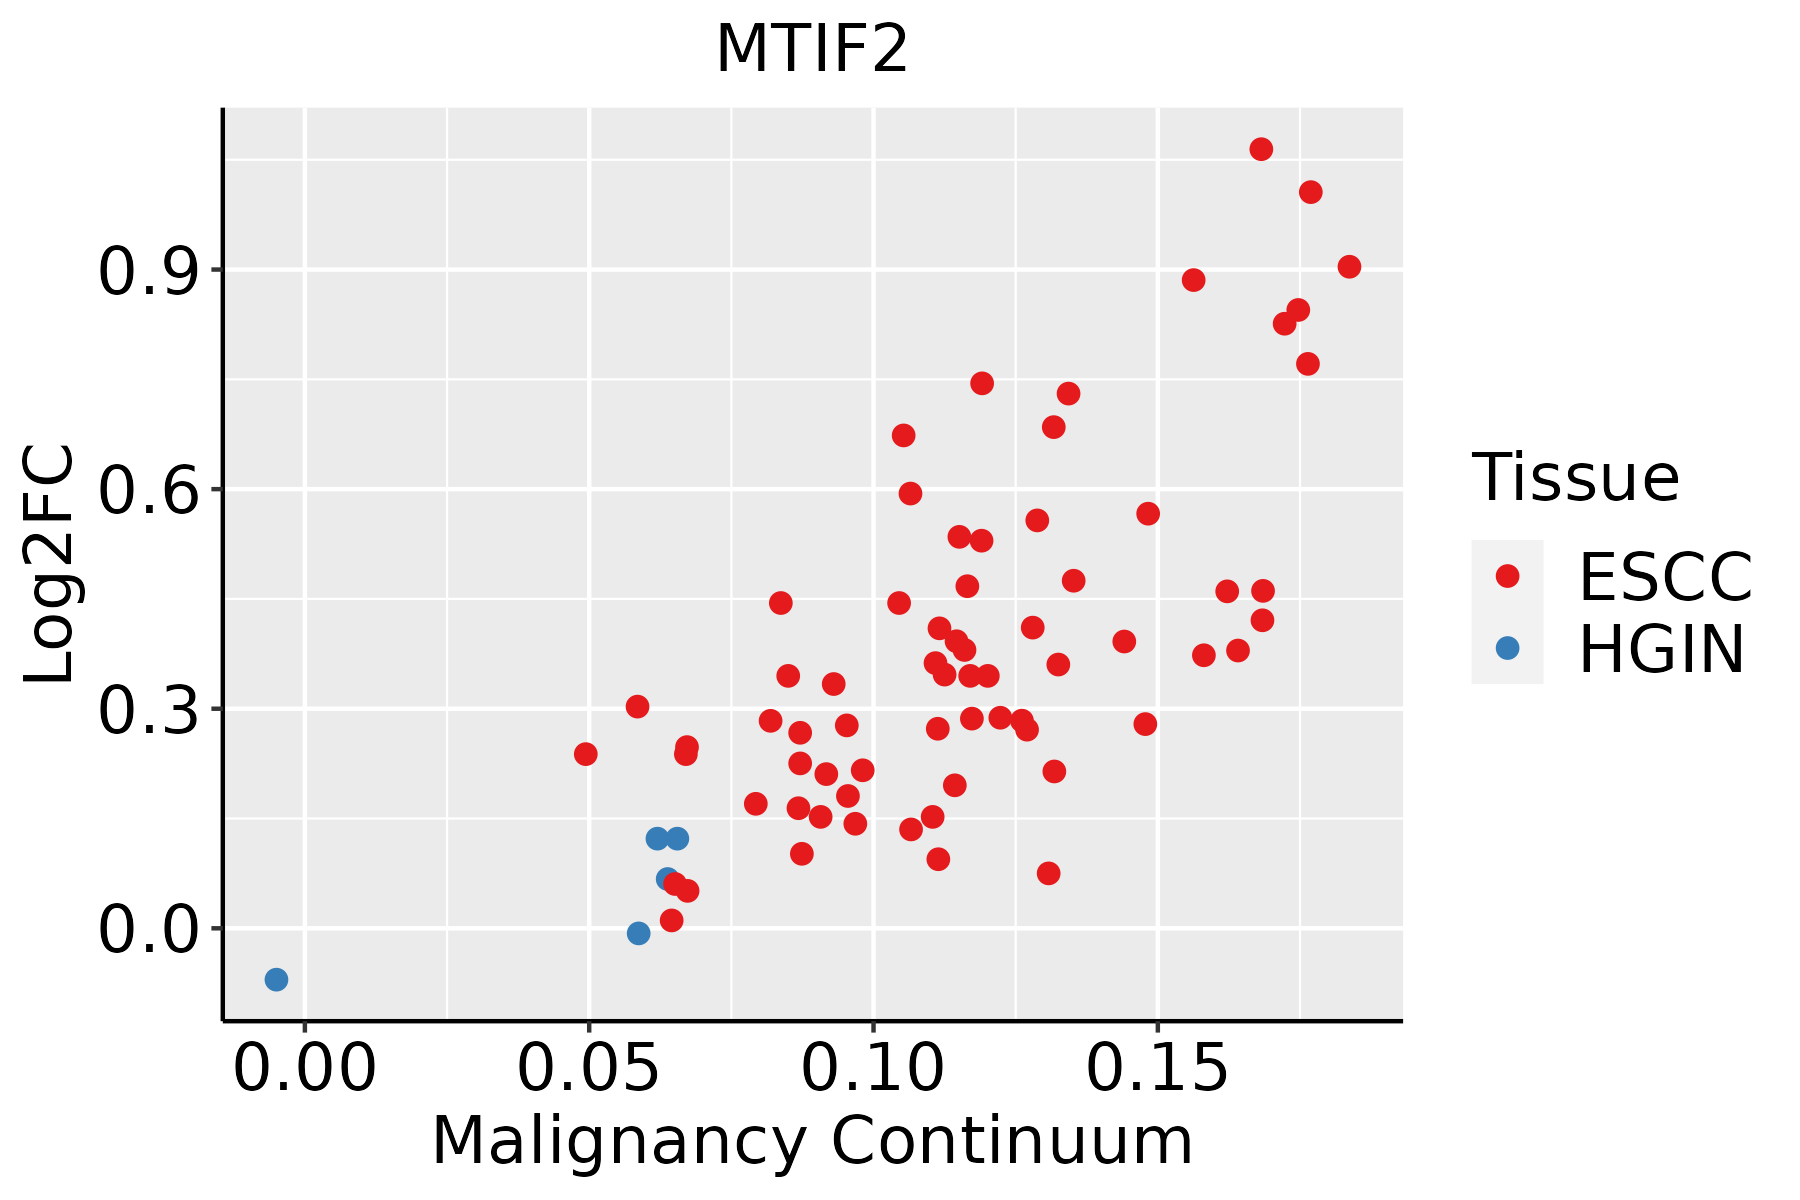
ESCC: Esophageal squamous cell carcinoma
HGIN: High-grade intraepithelial neoplasias
LGIN: Low-grade intraepithelial neoplasias
LiverThe image shows the transcriptomic changes along malignancy continuum.log2FC in expression of this searched gene in stem-like cells from each diseased tissue sample relative to stem-like cells in normal samples in each tissue plotted against the malignancy continuum. Samples are colored based on if they are from different disease stage.
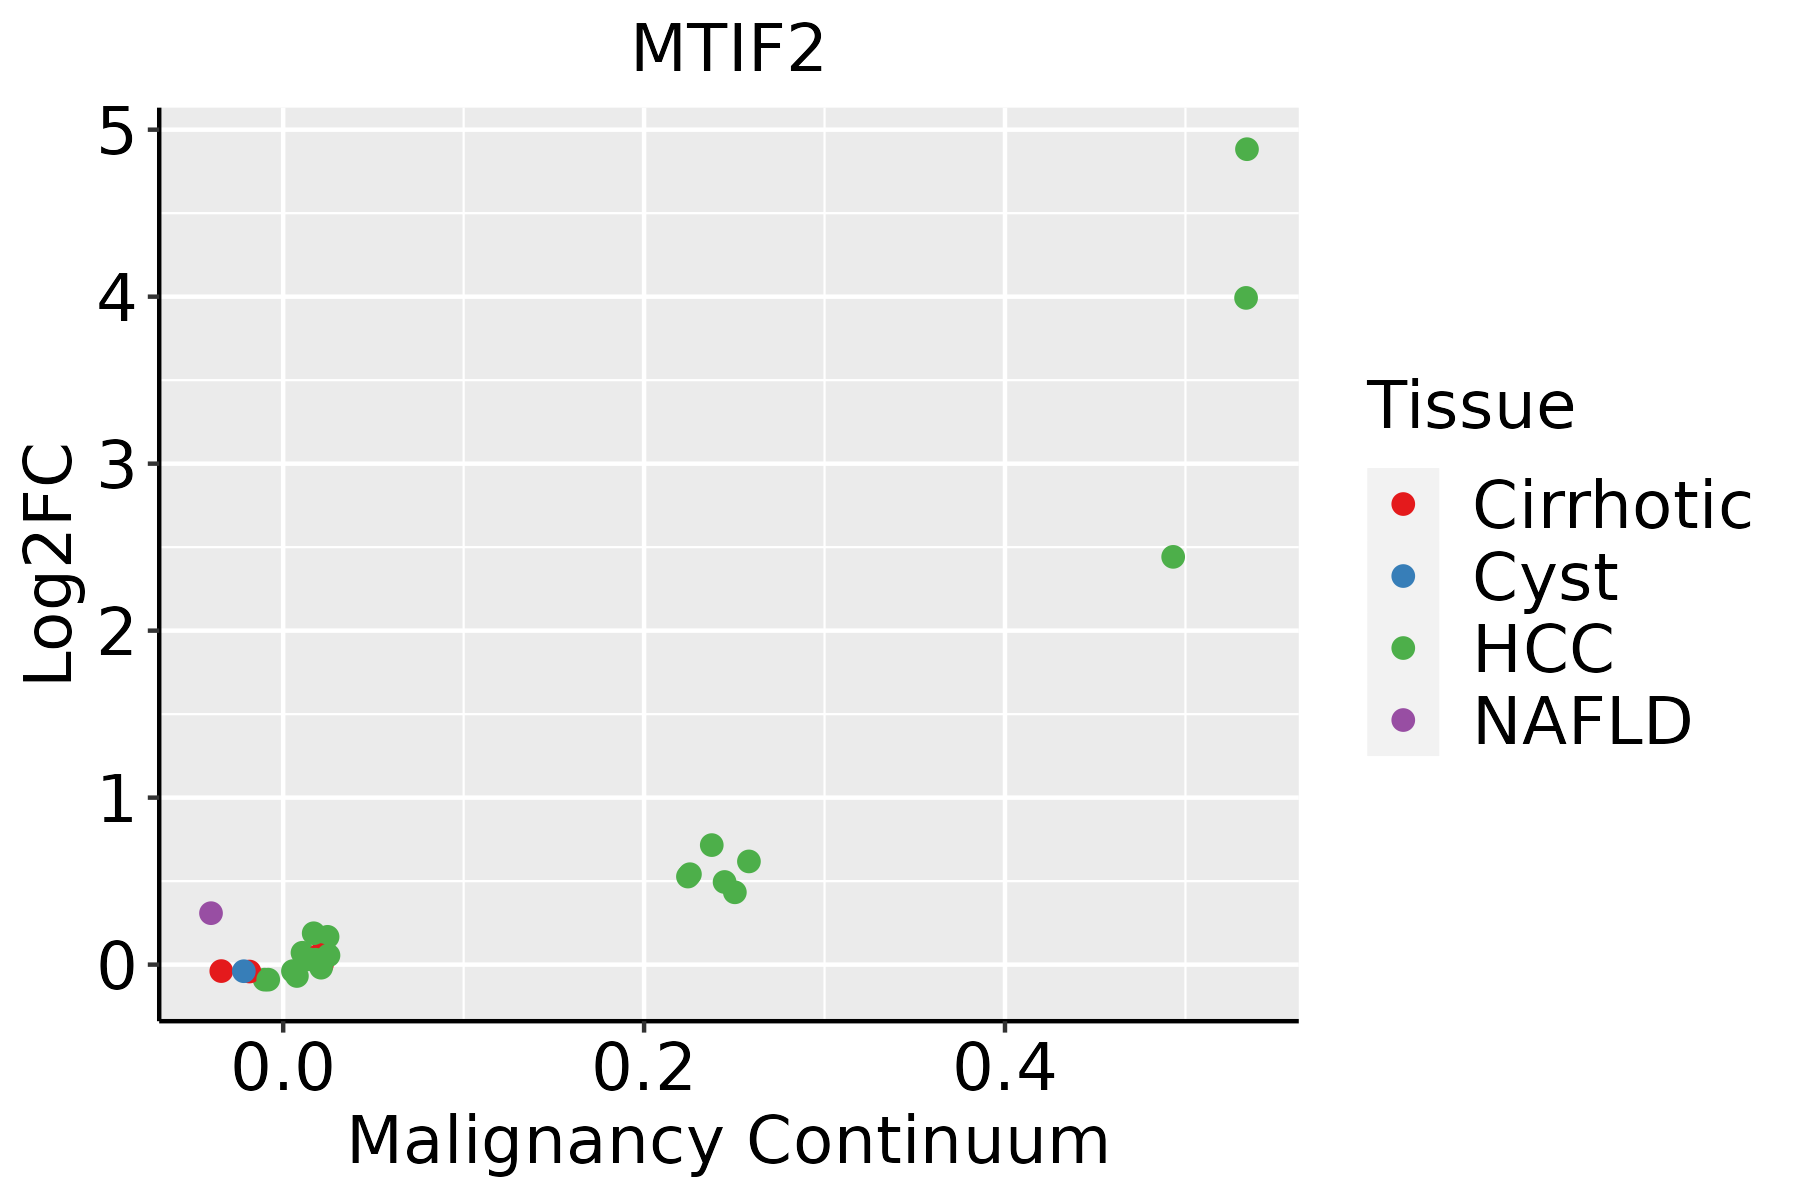
HCC: Hepatocellular carcinoma
NAFLD: Non-alcoholic fatty liver disease
Oral CavityThe image shows the transcriptomic changes along malignancy continuum.log2FC in expression of this searched gene in stem-like cells from each diseased tissue sample relative to stem-like cells in normal samples in each tissue plotted against the malignancy continuum. Samples are colored based on if they are from different disease stage.EOLP: Erosive Oral lichen planus
LP: leukoplakia
NEOLP: Non-erosive oral lichen planus
OSCC: Oral squamous cell carcinoma
SkinThe image shows the transcriptomic changes along malignancy continuum.log2FC in expression of this searched gene in stem-like cells from each diseased tissue sample relative to stem-like cells in normal samples in each tissue plotted against the malignancy continuum. Samples are colored based on if they are from different disease stage.
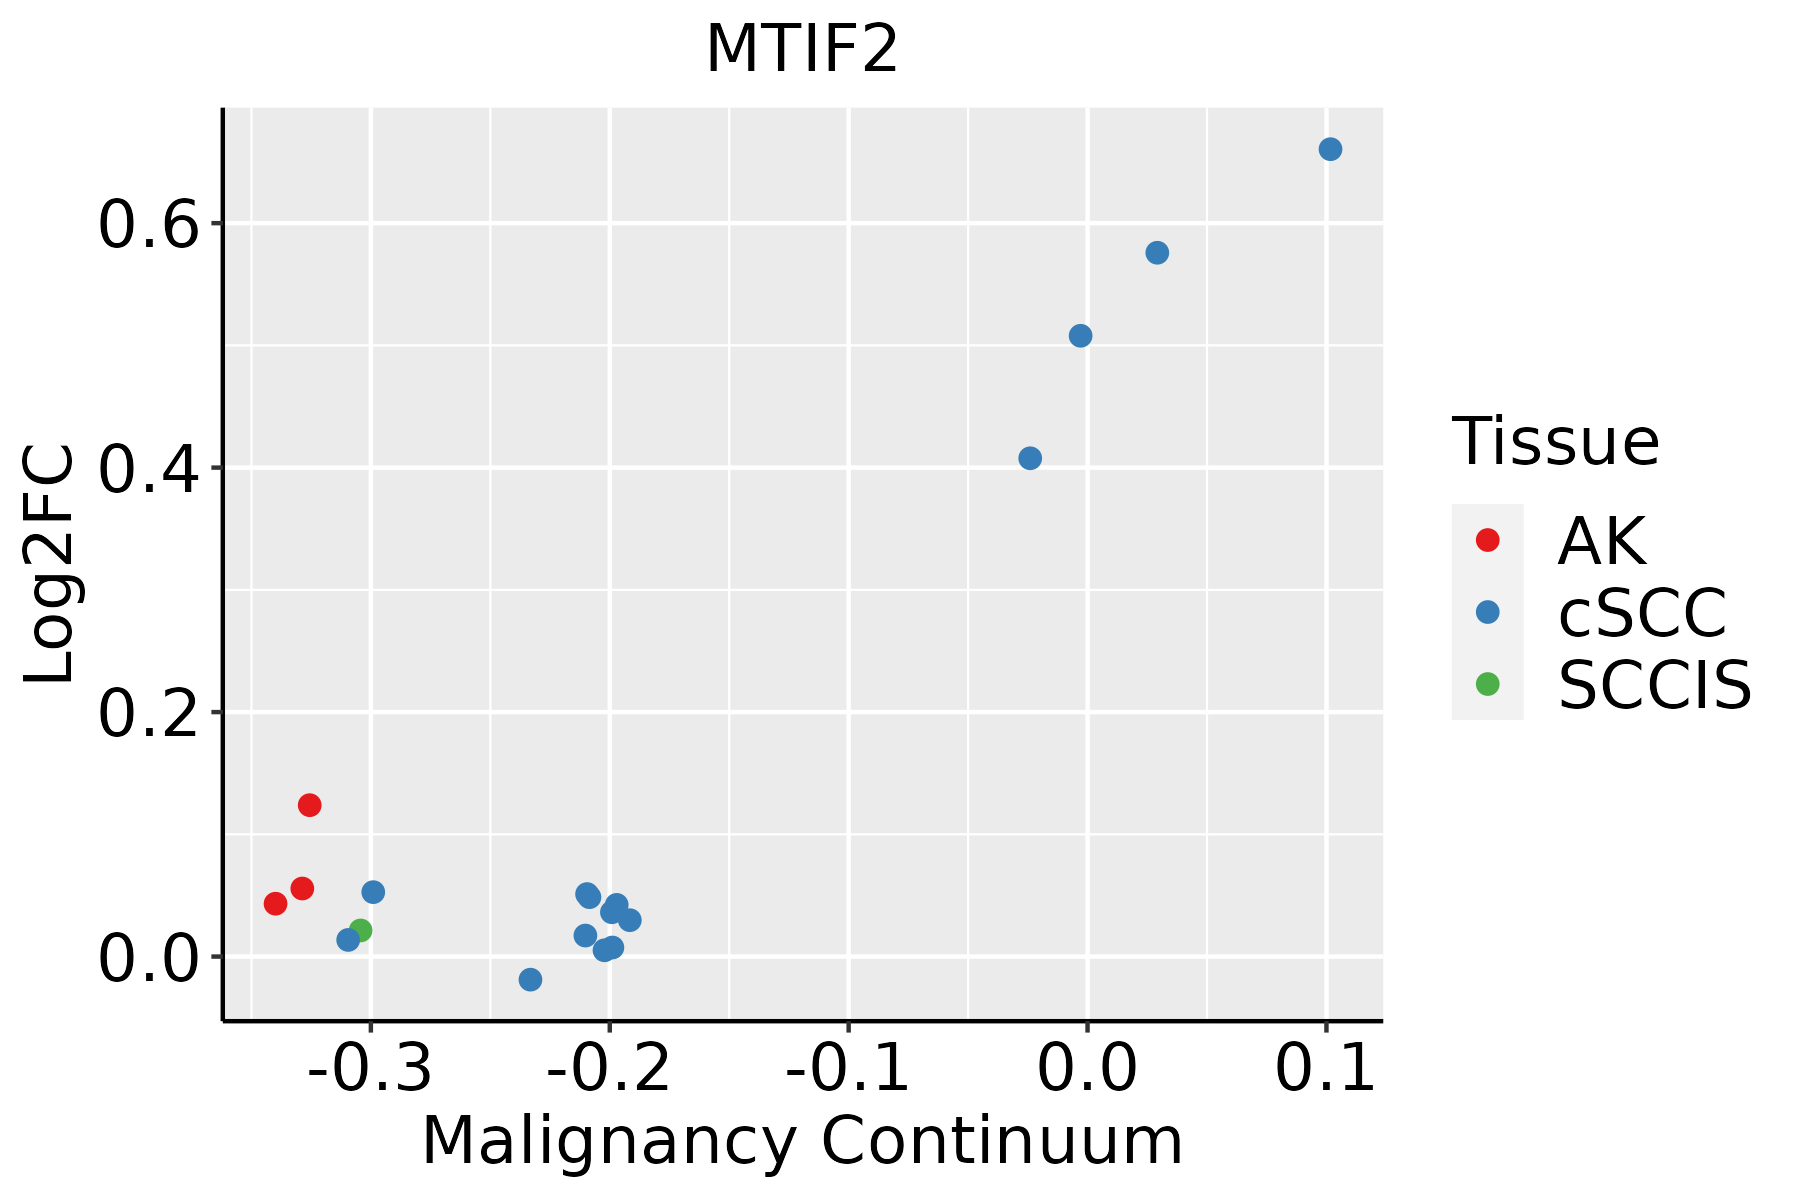
AK: Actinic keratosis
cSCC: Cutaneous squamous cell carcinoma
SCCIS:squamous cell carcinoma in situ
∗log2FC in expression of this searched gene in stem-like cells from each diseased tissue sample relative to stem-like cells in normal samples in each tissue plotted against the malignancy continuum. Samples are colored based on if they are from different disease stage.

Top

Malignant transformation related pathway analysis

check buttonFind out the enriched GO biological processes and KEGG pathways involved in transition from healthy to precancer to cancer
check button Figure of enriched GO biological processes.
TissueDisease StageEnriched GO biological Processes
ColorectumADGO analysis - Figure of enriched GO biological processes: Top 15 enriched GO BP terms are showed in the bar plot of each disease state in each tissue. Each row represents a significant GO biological process which is colored according to the -log10(p.adjust).
ColorectumSERGO analysis - Figure of enriched GO biological processes: Top 15 enriched GO BP terms are showed in the bar plot of each disease state in each tissue. Each row represents a significant GO biological process which is colored according to the -log10(p.adjust).
ColorectumMSSGO analysis - Figure of enriched GO biological processes: Top 15 enriched GO BP terms are showed in the bar plot of each disease state in each tissue. Each row represents a significant GO biological process which is colored according to the -log10(p.adjust).
ColorectumMSI-HGO analysis - Figure of enriched GO biological processes: Top 15 enriched GO BP terms are showed in the bar plot of each disease state in each tissue. Each row represents a significant GO biological process which is colored according to the -log10(p.adjust).
ColorectumFAPGO analysis - Figure of enriched GO biological processes: Top 15 enriched GO BP terms are showed in the bar plot of each disease state in each tissue. Each row represents a significant GO biological process which is colored according to the -log10(p.adjust).
∗Top 15 enriched GO BP terms are showed in the bar plot of each disease state in each tissue. Each row represents a significant GO biological process which is colored according to the -log10(p.adjust).
Page: 1 2 3 4 5 6 7 8 9 

check button Enriched GO biological processes.
GO IDTissueDisease StageDescriptionGene RatioBg Ratiopvaluep.adjustCount
GO:0022411ColorectumADcellular component disassembly147/3918443/187238.53e-106.76e-08147
GO:0006417ColorectumADregulation of translation141/3918468/187231.32e-064.22e-05141
GO:1903008ColorectumADorganelle disassembly46/3918114/187231.81e-065.48e-0546
GO:0006413ColorectumADtranslational initiation45/3918118/187231.35e-052.92e-0445
GO:0006446ColorectumADregulation of translational initiation28/391879/187232.02e-031.63e-0228
GO:00064174ColorectumFAPregulation of translation111/2622468/187238.47e-091.13e-06111
GO:00224114ColorectumFAPcellular component disassembly97/2622443/187233.44e-061.23e-0497
GO:00064463ColorectumFAPregulation of translational initiation26/262279/187231.54e-054.01e-0426
GO:00064134ColorectumFAPtranslational initiation34/2622118/187232.13e-055.12e-0434
GO:19030083ColorectumFAPorganelle disassembly30/2622114/187233.71e-044.63e-0330
GO:00064175ColorectumCRCregulation of translation82/2078468/187231.79e-055.40e-0482
GO:00224115ColorectumCRCcellular component disassembly75/2078443/187231.26e-042.42e-0375
GO:0022411111EsophagusESCCcellular component disassembly305/8552443/187231.94e-234.57e-21305
GO:0006413110EsophagusESCCtranslational initiation100/8552118/187231.16e-181.25e-16100
GO:014005313EsophagusESCCmitochondrial gene expression93/8552108/187231.96e-182.03e-1693
GO:0006417111EsophagusESCCregulation of translation304/8552468/187231.53e-171.33e-15304
GO:003254314EsophagusESCCmitochondrial translation68/855276/187231.02e-156.86e-1468
GO:190300816EsophagusESCCorganelle disassembly89/8552114/187231.36e-125.80e-1189
GO:000644617EsophagusESCCregulation of translational initiation65/855279/187232.04e-117.07e-1065
GO:002241112LiverHCCcellular component disassembly282/7958443/187231.02e-191.38e-17282
Page: 1 2 3 

check button Enriched KEGG pathways.
Pathway IDTissueDisease StageDescriptionGene RatioBg Ratiopvaluep.adjustqvalueCount
Page: 1 

Top

Cell-cell communication analysis

check buttonIdentification of potential cell-cell interactions between two cell types and their ligand-receptor pairs for different disease states
LigandReceptorLRpairPathwayTissueDisease Stage
Page: 1 

Top

Single-cell gene regulatory network inference analysis

check buttonFind out the significant the regulons (TFs) and the target genes of each regulon across cell types for different disease states
TFCell TypeTissueDisease StageTarget GeneRSSRegulon Activity
∗The dot plots of a searched regulon are shown for all cell subpopulations in each disease state of each tissue based on the regulon specific score inferred using pySCENIC and by calculating the average expression.
Page: 1 

Top

Somatic mutation of malignant transformation related genes

check buttonAnnotation of somatic variants for genes involved in malignant transformation
Hugo SymbolVariant ClassVariant ClassificationdbSNP RSHGVScHGVSpHGVSp ShortSWISSPROTBIOTYPESIFTPolyPhenTumor Sample BarcodeTissueHistologySexAgeStageTherapy TypesDrugsOutcome
MTIF2SNVMissense_Mutationc.732G>Ap.Met244Ilep.M244IP46199protein_codingtolerated(0.06)possibly_damaging(0.606)TCGA-A2-A0EQ-01Breastbreast invasive carcinomaFemale<65I/IIChemotherapyadriamycinSD
MTIF2SNVMissense_Mutationnovelc.1741N>Ap.Val581Ilep.V581IP46199protein_codingtolerated(0.19)benign(0)TCGA-A2-A3Y0-01Breastbreast invasive carcinomaFemale<65I/IIChemotherapyadriamycinCR
MTIF2SNVMissense_Mutationc.219N>Cp.Lys73Asnp.K73NP46199protein_codingdeleterious(0.04)benign(0.255)TCGA-B6-A0RG-01Breastbreast invasive carcinomaFemale<65I/IIUnknownUnknownSD
MTIF2SNVMissense_Mutationc.2044N>Ap.Asp682Asnp.D682NP46199protein_codingdeleterious(0.04)benign(0.051)TCGA-BH-A0BP-01Breastbreast invasive carcinomaFemale>=65I/IIUnknownUnknownSD
MTIF2SNVMissense_Mutationnovelc.1006G>Ap.Glu336Lysp.E336KP46199protein_codingdeleterious(0)probably_damaging(0.997)TCGA-E2-A574-01Breastbreast invasive carcinomaFemale<65I/IIChemotherapyadriamycinSD
MTIF2deletionIn_Frame_Delc.2128_2130delNNNp.Val710delp.V710delP46199protein_codingTCGA-A8-A092-01Breastbreast invasive carcinomaFemale<65III/IVChemotherapypaclitaxelCR
MTIF2SNVMissense_Mutationnovelc.1151G>Tp.Gly384Valp.G384VP46199protein_codingdeleterious(0)probably_damaging(0.999)TCGA-2W-A8YY-01Cervixcervical & endocervical cancerFemale<65I/IIChemotherapycisplatinCR
MTIF2SNVMissense_Mutationnovelc.1057G>Ap.Gly353Serp.G353SP46199protein_codingdeleterious(0.02)probably_damaging(0.92)TCGA-2W-A8YY-01Cervixcervical & endocervical cancerFemale<65I/IIChemotherapycisplatinCR
MTIF2SNVMissense_Mutationnovelc.172C>Ap.Leu58Ilep.L58IP46199protein_codingtolerated_low_confidence(0.07)benign(0)TCGA-2W-A8YY-01Cervixcervical & endocervical cancerFemale<65I/IIChemotherapycisplatinCR
MTIF2SNVMissense_Mutationnovelc.441N>Ap.Met147Ilep.M147IP46199protein_codingtolerated(0.06)benign(0.017)TCGA-C5-A1MH-01Cervixcervical & endocervical cancerFemale>=65III/IVChemotherapycisplatinPD
Page: 1 2 3 4 5 6 7 8 9 10 

Top

Related drugs of malignant transformation related genes

check buttonIdentification of chemicals and drugs interact with genes involved in malignant transfromation
(DGIdb 4.0)
Entrez IDSymbolCategoryInteraction TypesDrug Claim NameDrug NamePMIDs
Page: 1