
|
|||||
|
 | |
| |
| |
| |
| |
| |
|
Gene: MTHFS |
Gene summary for MTHFS |
| Gene information | Species | Human | Gene symbol | MTHFS | Gene ID | 10588 |
| Gene name | methenyltetrahydrofolate synthetase | |
| Gene Alias | HsT19268 | |
| Cytomap | 15q25.1 | |
| Gene Type | protein-coding | GO ID | GO:0006082 | UniProtAcc | P49914 |
Top |
Malignant transformation analysis |
| Identification of the aberrant gene expression in precancerous and cancerous lesions by comparing the gene expression of stem-like cells in diseased tissues with normal stem cells |
| Entrez ID | Symbol | Replicates | Species | Organ | Tissue | Adj P-value | Log2FC | Malignancy |
| 10588 | MTHFS | HTA11_2487_2000001011 | Human | Colorectum | SER | 1.83e-02 | 1.90e-01 | -0.1808 |
| 10588 | MTHFS | HTA11_1938_2000001011 | Human | Colorectum | AD | 1.11e-07 | 3.16e-01 | -0.0811 |
| 10588 | MTHFS | HTA11_78_2000001011 | Human | Colorectum | AD | 4.21e-08 | 2.94e-01 | -0.1088 |
| 10588 | MTHFS | HTA11_347_2000001011 | Human | Colorectum | AD | 8.80e-18 | 4.43e-01 | -0.1954 |
| 10588 | MTHFS | HTA11_411_2000001011 | Human | Colorectum | SER | 3.29e-02 | 3.07e-01 | -0.2602 |
| 10588 | MTHFS | HTA11_696_2000001011 | Human | Colorectum | AD | 1.68e-06 | 2.15e-01 | -0.1464 |
| 10588 | MTHFS | HTA11_866_2000001011 | Human | Colorectum | AD | 8.10e-03 | 1.40e-01 | -0.1001 |
| 10588 | MTHFS | HTA11_1391_2000001011 | Human | Colorectum | AD | 3.34e-10 | 3.74e-01 | -0.059 |
| 10588 | MTHFS | HTA11_866_3004761011 | Human | Colorectum | AD | 7.75e-04 | 1.70e-01 | 0.096 |
| 10588 | MTHFS | HTA11_7663_2000001011 | Human | Colorectum | SER | 5.18e-05 | 4.06e-01 | 0.0131 |
| 10588 | MTHFS | HTA11_6801_2000001011 | Human | Colorectum | SER | 3.80e-02 | 3.34e-01 | 0.0171 |
| 10588 | MTHFS | HTA11_6818_2000001021 | Human | Colorectum | AD | 8.19e-07 | 3.83e-01 | 0.0588 |
| 10588 | MTHFS | HTA11_99999970781_79442 | Human | Colorectum | MSS | 2.12e-14 | 3.77e-01 | 0.294 |
| 10588 | MTHFS | HTA11_99999965062_69753 | Human | Colorectum | MSI-H | 2.27e-06 | 8.23e-01 | 0.3487 |
| 10588 | MTHFS | HTA11_99999965104_69814 | Human | Colorectum | MSS | 2.06e-04 | 2.64e-01 | 0.281 |
| 10588 | MTHFS | HTA11_99999971662_82457 | Human | Colorectum | MSS | 9.41e-03 | 1.87e-01 | 0.3859 |
| 10588 | MTHFS | LZE2D | Human | Esophagus | HGIN | 4.36e-02 | 4.18e-01 | 0.0642 |
| 10588 | MTHFS | LZE2T | Human | Esophagus | ESCC | 4.83e-05 | 6.27e-01 | 0.082 |
| 10588 | MTHFS | LZE4T | Human | Esophagus | ESCC | 1.81e-28 | 7.56e-01 | 0.0811 |
| 10588 | MTHFS | LZE5T | Human | Esophagus | ESCC | 4.55e-05 | 3.47e-01 | 0.0514 |
| Page: 1 2 3 4 5 6 7 |
| Tissue | Expression Dynamics | Abbreviation |
| Colorectum (GSE201348) |  | FAP: Familial adenomatous polyposis |
| CRC: Colorectal cancer | ||
| Colorectum (HTA11) |  | AD: Adenomas |
| SER: Sessile serrated lesions | ||
| MSI-H: Microsatellite-high colorectal cancer | ||
| MSS: Microsatellite stable colorectal cancer | ||
| Esophagus |  | ESCC: Esophageal squamous cell carcinoma |
| HGIN: High-grade intraepithelial neoplasias | ||
| LGIN: Low-grade intraepithelial neoplasias | ||
| Liver | 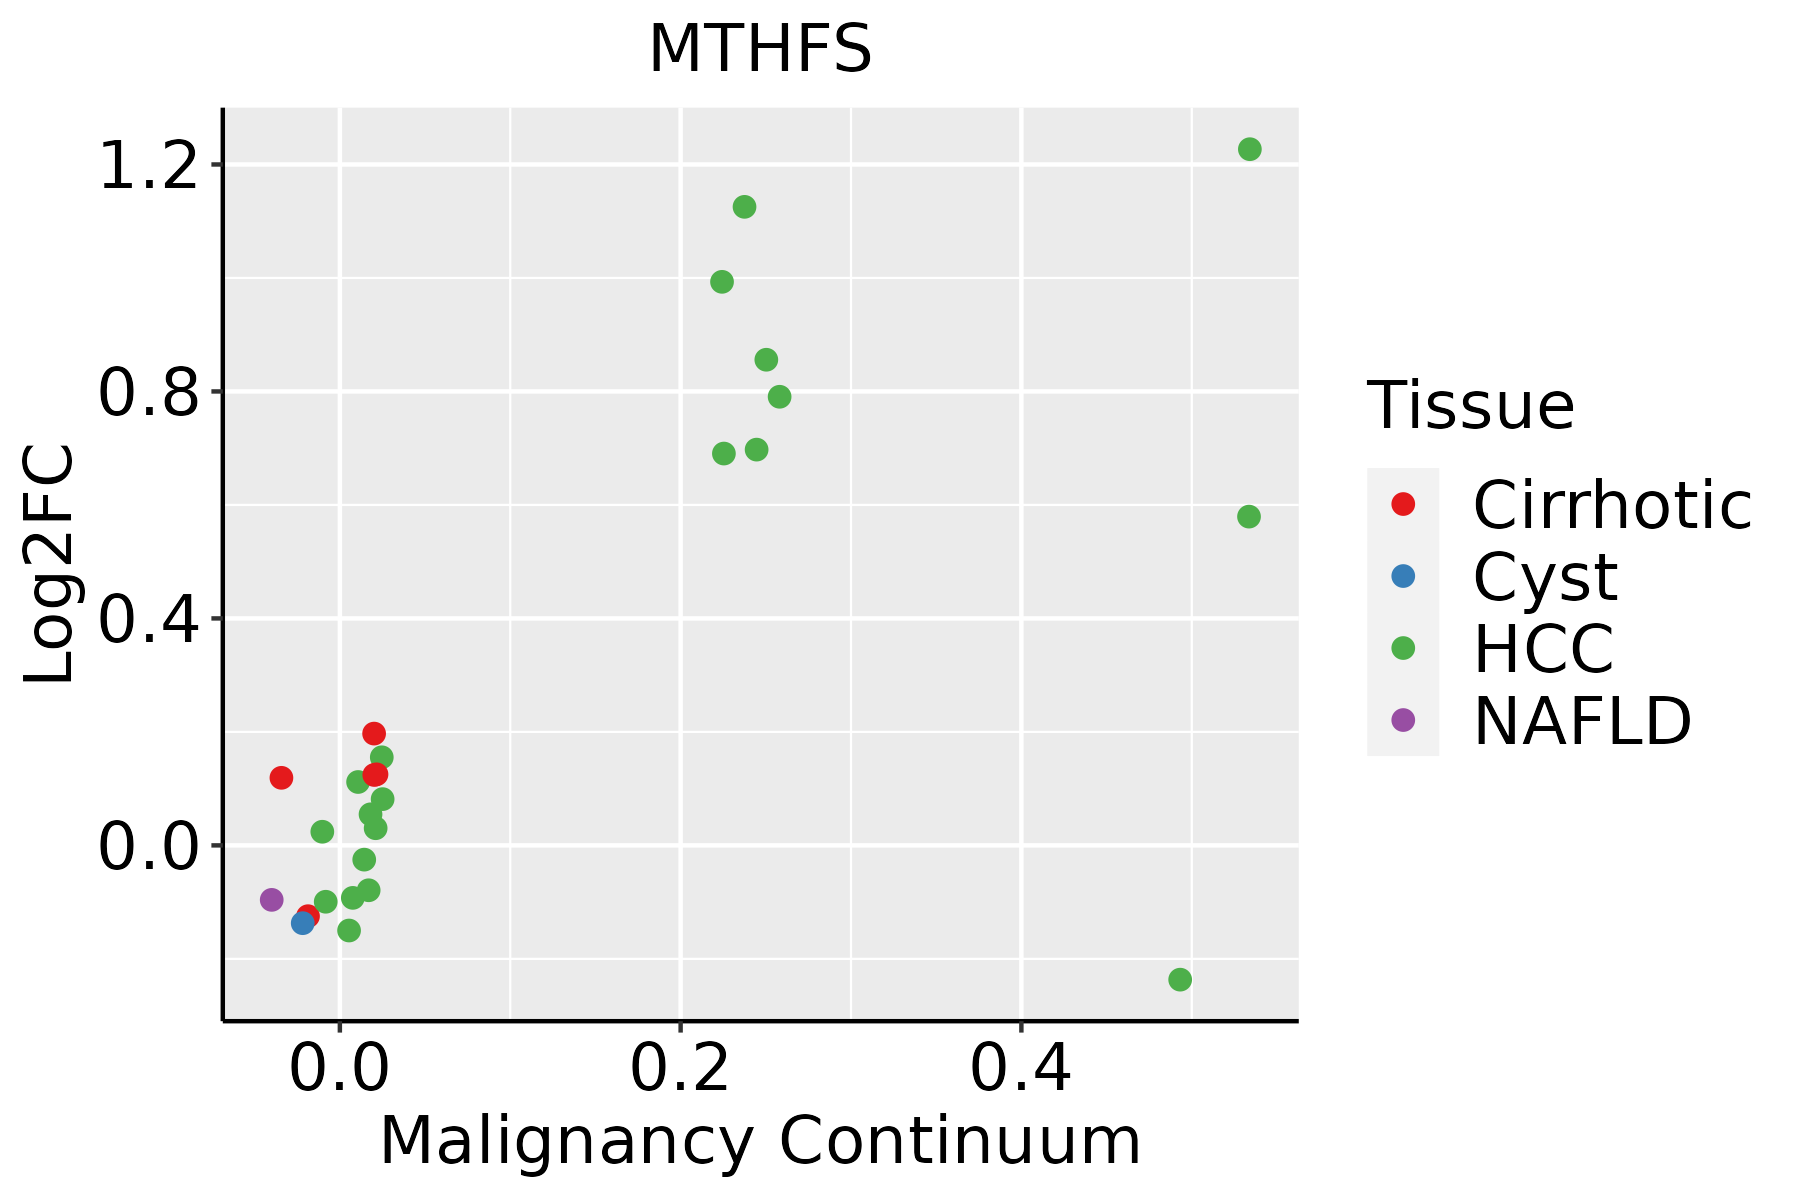 | HCC: Hepatocellular carcinoma |
| NAFLD: Non-alcoholic fatty liver disease | ||
| Oral Cavity | 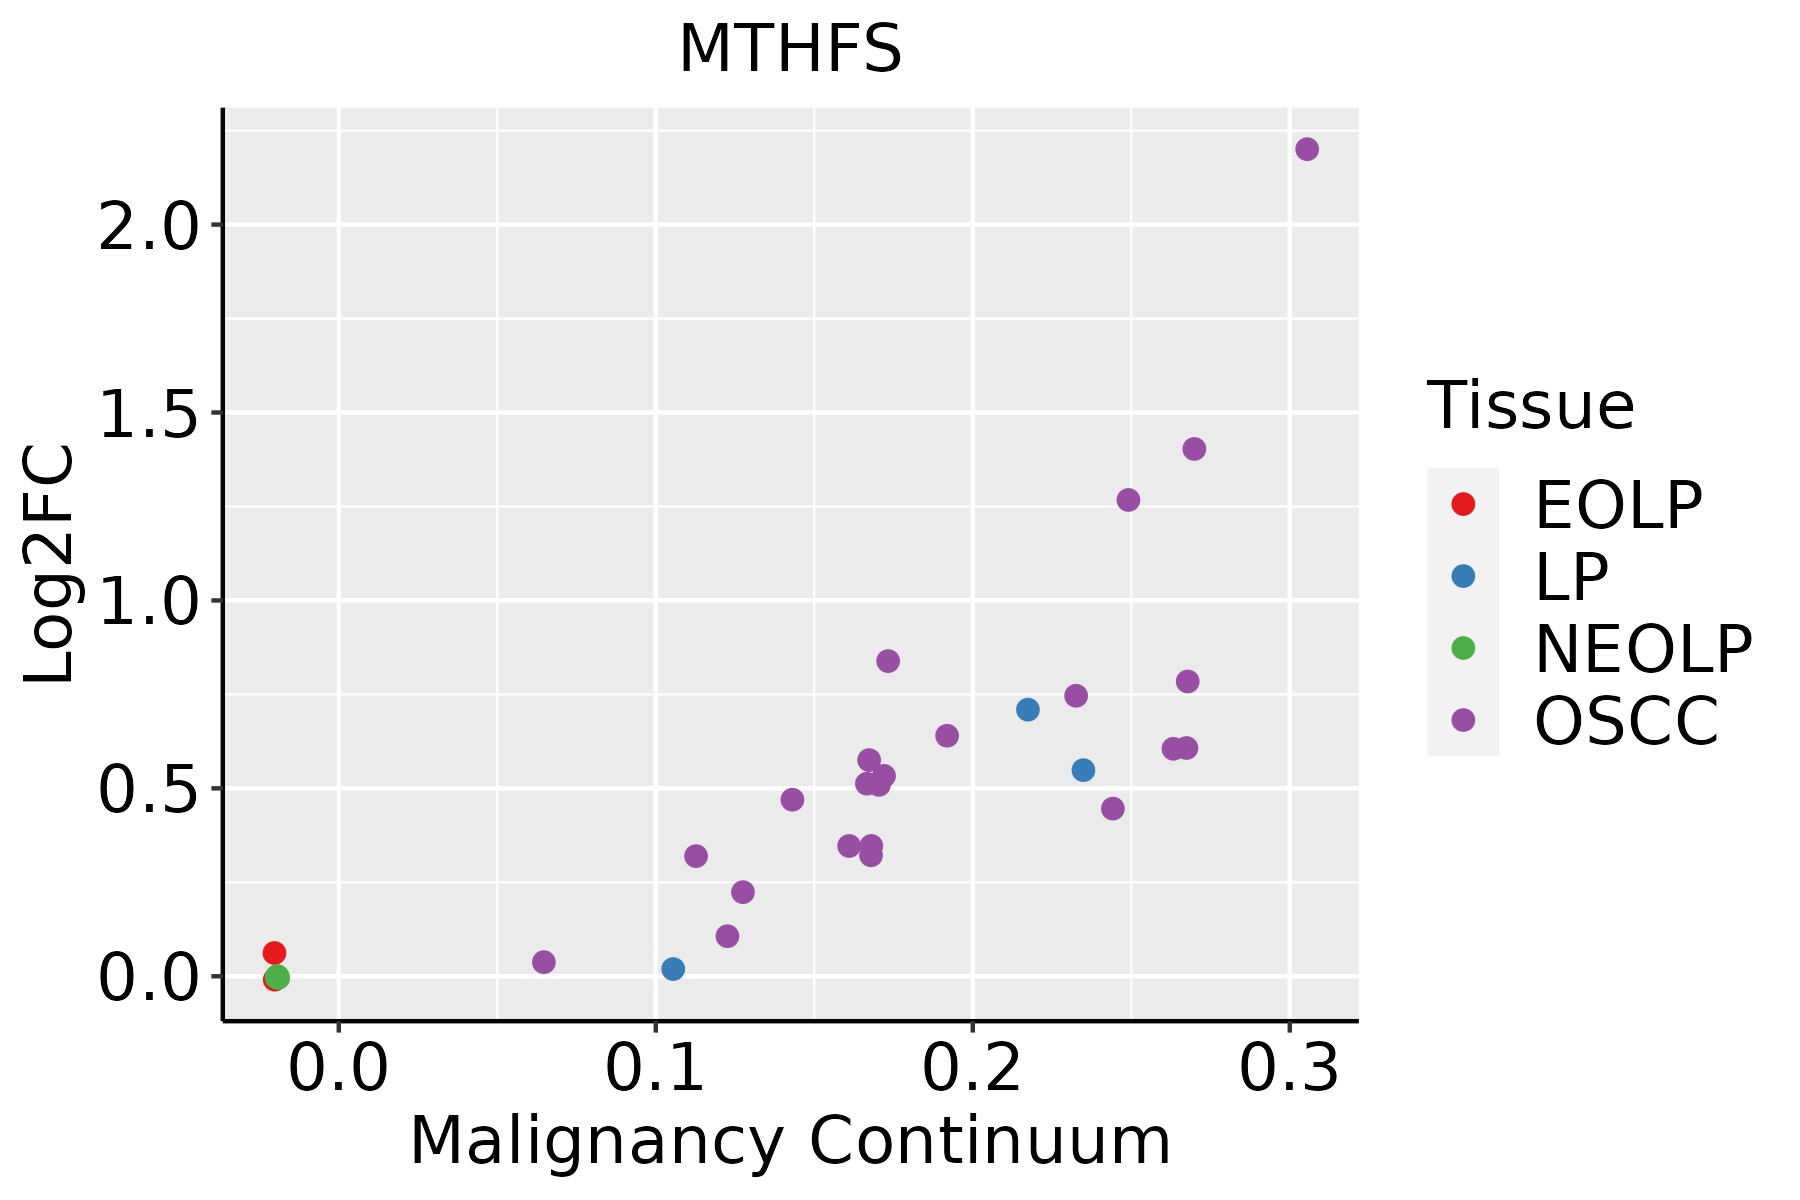 | EOLP: Erosive Oral lichen planus |
| LP: leukoplakia | ||
| NEOLP: Non-erosive oral lichen planus | ||
| OSCC: Oral squamous cell carcinoma | ||
| Skin | 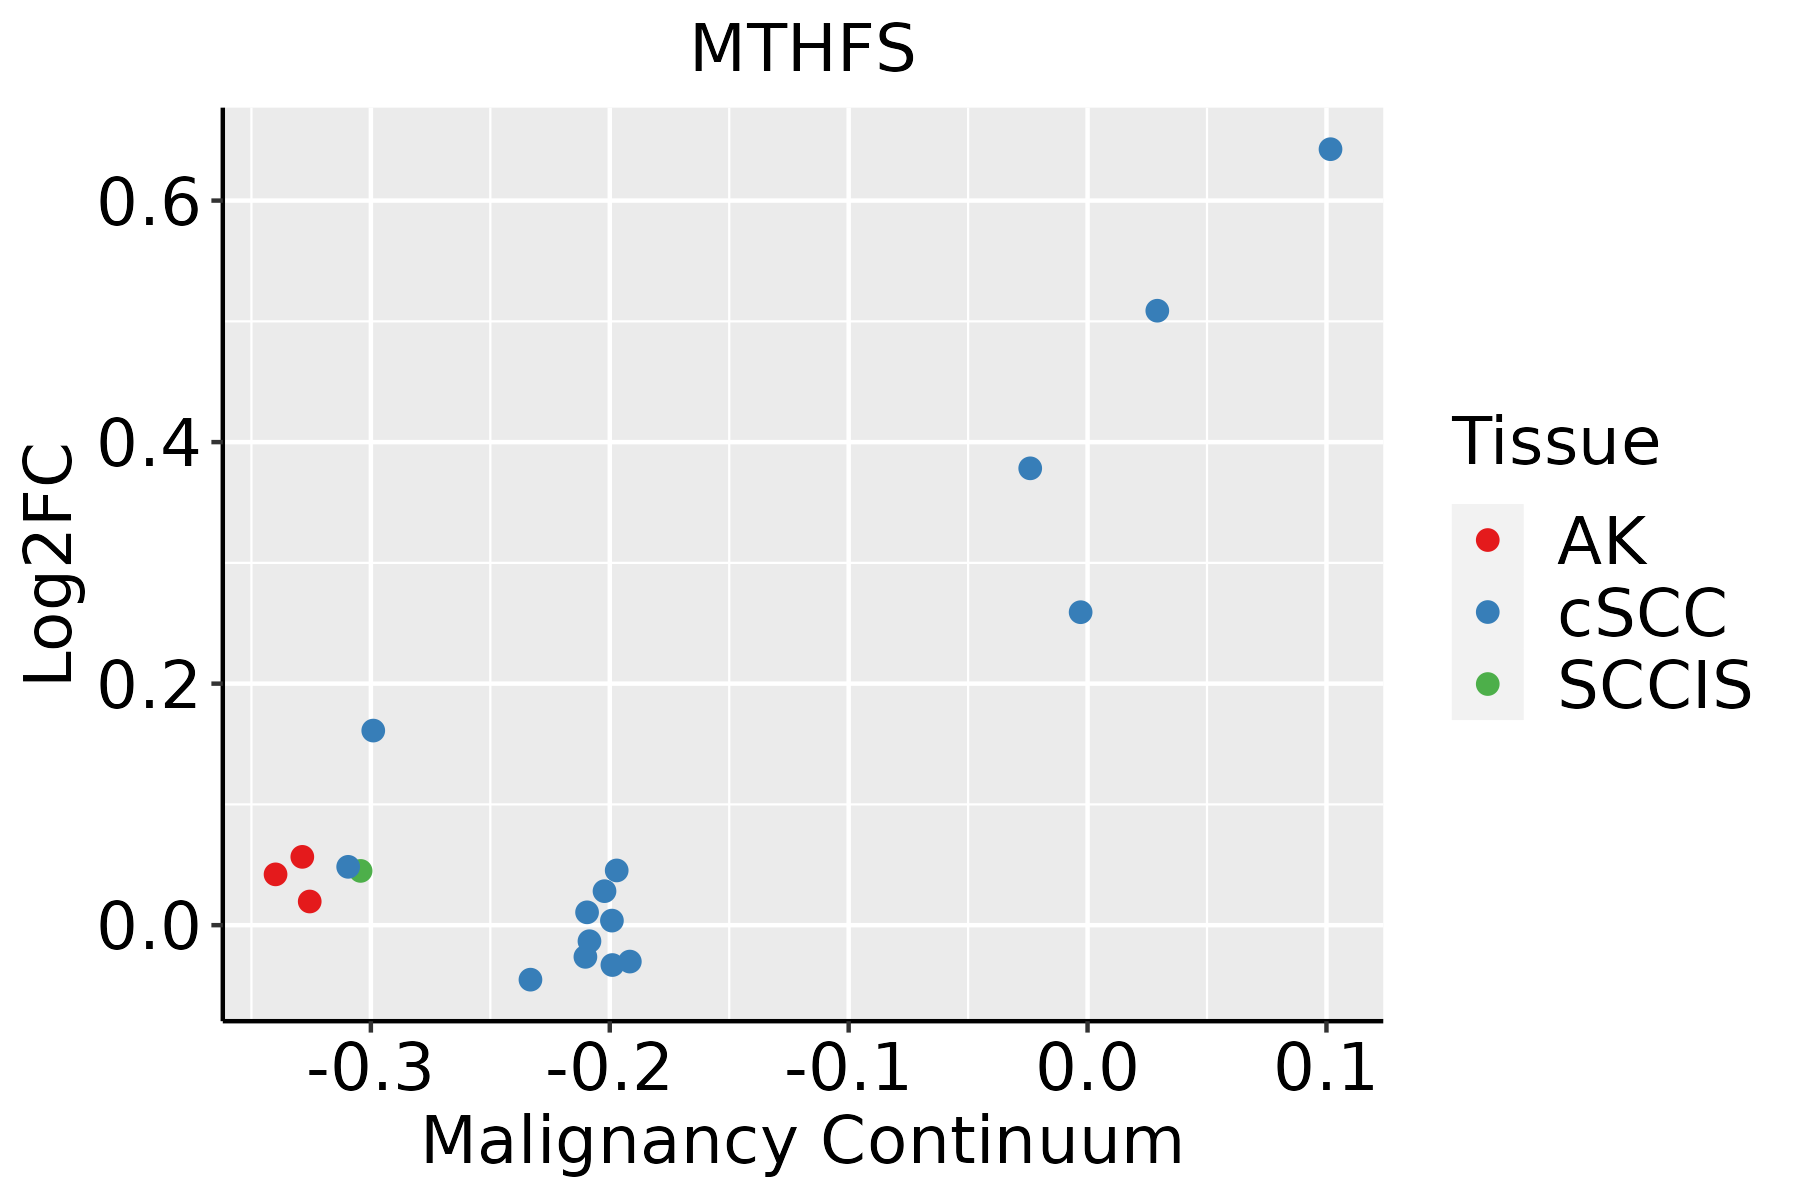 | AK: Actinic keratosis |
| cSCC: Cutaneous squamous cell carcinoma | ||
| SCCIS:squamous cell carcinoma in situ |
| ∗log2FC in expression of this searched gene in stem-like cells from each diseased tissue sample relative to stem-like cells in normal samples in each tissue plotted against the malignancy continuum. Samples are colored based on if they are from different disease stage. |
Top |
Malignant transformation related pathway analysis |
| Find out the enriched GO biological processes and KEGG pathways involved in transition from healthy to precancer to cancer |
| Tissue | Disease Stage | Enriched GO biological Processes |
| Colorectum | AD |  |
| Colorectum | SER |  |
| Colorectum | MSS |  |
| Colorectum | MSI-H |  |
| Colorectum | FAP |  |
| ∗Top 15 enriched GO BP terms are showed in the bar plot of each disease state in each tissue. Each row represents a significant GO biological process which is colored according to the -log10(p.adjust). |
| Page: 1 2 3 4 5 6 7 8 9 |
| GO ID | Tissue | Disease Stage | Description | Gene Ratio | Bg Ratio | pvalue | p.adjust | Count |
| GO:0044270 | Colorectum | AD | cellular nitrogen compound catabolic process | 147/3918 | 451/18723 | 3.35e-09 | 2.23e-07 | 147 |
| GO:0046700 | Colorectum | AD | heterocycle catabolic process | 145/3918 | 445/18723 | 4.37e-09 | 2.84e-07 | 145 |
| GO:0019439 | Colorectum | AD | aromatic compound catabolic process | 146/3918 | 467/18723 | 7.48e-08 | 3.84e-06 | 146 |
| GO:1901361 | Colorectum | AD | organic cyclic compound catabolic process | 153/3918 | 495/18723 | 8.23e-08 | 4.18e-06 | 153 |
| GO:0044282 | Colorectum | AD | small molecule catabolic process | 118/3918 | 376/18723 | 1.05e-06 | 3.55e-05 | 118 |
| GO:0016054 | Colorectum | AD | organic acid catabolic process | 73/3918 | 240/18723 | 3.20e-04 | 3.81e-03 | 73 |
| GO:0006575 | Colorectum | AD | cellular modified amino acid metabolic process | 59/3918 | 188/18723 | 4.80e-04 | 5.27e-03 | 59 |
| GO:0006730 | Colorectum | AD | one-carbon metabolic process | 18/3918 | 40/18723 | 5.36e-04 | 5.74e-03 | 18 |
| GO:0043648 | Colorectum | AD | dicarboxylic acid metabolic process | 34/3918 | 96/18723 | 7.22e-04 | 7.28e-03 | 34 |
| GO:0046395 | Colorectum | AD | carboxylic acid catabolic process | 70/3918 | 236/18723 | 9.06e-04 | 8.71e-03 | 70 |
| GO:0006520 | Colorectum | AD | cellular amino acid metabolic process | 81/3918 | 284/18723 | 1.37e-03 | 1.19e-02 | 81 |
| GO:0042398 | Colorectum | AD | cellular modified amino acid biosynthetic process | 18/3918 | 46/18723 | 3.67e-03 | 2.60e-02 | 18 |
| GO:00442821 | Colorectum | SER | small molecule catabolic process | 87/2897 | 376/18723 | 5.31e-05 | 1.27e-03 | 87 |
| GO:00442701 | Colorectum | SER | cellular nitrogen compound catabolic process | 99/2897 | 451/18723 | 1.46e-04 | 2.86e-03 | 99 |
| GO:00467001 | Colorectum | SER | heterocycle catabolic process | 97/2897 | 445/18723 | 2.20e-04 | 3.89e-03 | 97 |
| GO:19013611 | Colorectum | SER | organic cyclic compound catabolic process | 104/2897 | 495/18723 | 5.46e-04 | 7.63e-03 | 104 |
| GO:00067301 | Colorectum | SER | one-carbon metabolic process | 15/2897 | 40/18723 | 5.71e-04 | 7.86e-03 | 15 |
| GO:00194391 | Colorectum | SER | aromatic compound catabolic process | 98/2897 | 467/18723 | 8.09e-04 | 1.01e-02 | 98 |
| GO:00160541 | Colorectum | SER | organic acid catabolic process | 53/2897 | 240/18723 | 4.04e-03 | 3.30e-02 | 53 |
| GO:00065201 | Colorectum | SER | cellular amino acid metabolic process | 61/2897 | 284/18723 | 4.20e-03 | 3.41e-02 | 61 |
| Page: 1 2 3 4 5 6 7 |
| Pathway ID | Tissue | Disease Stage | Description | Gene Ratio | Bg Ratio | pvalue | p.adjust | qvalue | Count |
| hsa00670 | Colorectum | MSI-H | One carbon pool by folate | 7/797 | 20/8465 | 1.65e-03 | 1.73e-02 | 1.45e-02 | 7 |
| hsa006701 | Colorectum | MSI-H | One carbon pool by folate | 7/797 | 20/8465 | 1.65e-03 | 1.73e-02 | 1.45e-02 | 7 |
| hsa006702 | Liver | HCC | One carbon pool by folate | 17/4020 | 20/8465 | 6.04e-04 | 2.50e-03 | 1.39e-03 | 17 |
| hsa0067011 | Liver | HCC | One carbon pool by folate | 17/4020 | 20/8465 | 6.04e-04 | 2.50e-03 | 1.39e-03 | 17 |
| Page: 1 |
Top |
Cell-cell communication analysis |
| Identification of potential cell-cell interactions between two cell types and their ligand-receptor pairs for different disease states |
| Ligand | Receptor | LRpair | Pathway | Tissue | Disease Stage |
| Page: 1 |
Top |
Single-cell gene regulatory network inference analysis |
| Find out the significant the regulons (TFs) and the target genes of each regulon across cell types for different disease states |
| TF | Cell Type | Tissue | Disease Stage | Target Gene | RSS | Regulon Activity |
| ∗The dot plots of a searched regulon are shown for all cell subpopulations in each disease state of each tissue based on the regulon specific score inferred using pySCENIC and by calculating the average expression. |
| Page: 1 |
Top |
Somatic mutation of malignant transformation related genes |
| Annotation of somatic variants for genes involved in malignant transformation |
| Hugo Symbol | Variant Class | Variant Classification | dbSNP RS | HGVSc | HGVSp | HGVSp Short | SWISSPROT | BIOTYPE | SIFT | PolyPhen | Tumor Sample Barcode | Tissue | Histology | Sex | Age | Stage | Therapy Types | Drugs | Outcome |
| MTHFS | SNV | Missense_Mutation | c.270N>C | p.Met90Ile | p.M90I | P49914 | protein_coding | deleterious(0) | possibly_damaging(0.88) | TCGA-D8-A1JP-01 | Breast | breast invasive carcinoma | Female | >=65 | I/II | Hormone Therapy | tamoxiphen | SD | |
| MTHFS | SNV | Missense_Mutation | rs372686234 | c.475N>T | p.Arg159Cys | p.R159C | P49914 | protein_coding | deleterious(0) | probably_damaging(0.996) | TCGA-AA-3492-01 | Colorectum | colon adenocarcinoma | Female | >=65 | I/II | Unknown | Unknown | SD |
| MTHFS | SNV | Missense_Mutation | c.251N>T | p.Arg84Leu | p.R84L | P49914 | protein_coding | tolerated(0.18) | benign(0.018) | TCGA-CI-6623-01 | Colorectum | rectum adenocarcinoma | Male | <65 | I/II | Unknown | Unknown | SD | |
| MTHFS | SNV | Missense_Mutation | rs144767188 | c.221N>A | p.Arg74Gln | p.R74Q | P49914 | protein_coding | tolerated(1) | benign(0) | TCGA-AP-A056-01 | Endometrium | uterine corpus endometrioid carcinoma | Female | <65 | I/II | Unknown | Unknown | SD |
| MTHFS | SNV | Missense_Mutation | novel | c.446N>A | p.Gly149Asp | p.G149D | P49914 | protein_coding | deleterious(0.04) | probably_damaging(1) | TCGA-AP-A1DV-01 | Endometrium | uterine corpus endometrioid carcinoma | Female | <65 | I/II | Unknown | Unknown | SD |
| MTHFS | SNV | Missense_Mutation | novel | c.379G>T | p.Gly127Trp | p.G127W | P49914 | protein_coding | deleterious(0) | probably_damaging(1) | TCGA-DF-A2KU-01 | Endometrium | uterine corpus endometrioid carcinoma | Female | Unknown | I/II | Unknown | Unknown | SD |
| MTHFS | SNV | Missense_Mutation | novel | c.348G>T | p.Glu116Asp | p.E116D | P49914 | protein_coding | tolerated(1) | benign(0.001) | TCGA-MN-A4N4-01 | Lung | lung adenocarcinoma | Male | <65 | I/II | Unknown | Unknown | SD |
| MTHFS | SNV | Missense_Mutation | novel | c.146C>T | p.Ser49Phe | p.S49F | P49914 | protein_coding | deleterious(0) | probably_damaging(0.998) | TCGA-CN-5359-01 | Oral cavity | head & neck squamous cell carcinoma | Male | <65 | I/II | Chemotherapy | cisplatin | PD |
| MTHFS | SNV | Missense_Mutation | novel | c.193G>C | p.Glu65Gln | p.E65Q | P49914 | protein_coding | tolerated(0.27) | benign(0.055) | TCGA-CV-7414-01 | Oral cavity | head & neck squamous cell carcinoma | Male | >=65 | I/II | Unknown | Unknown | SD |
| MTHFS | SNV | Missense_Mutation | c.455N>G | p.Tyr152Cys | p.Y152C | P49914 | protein_coding | deleterious(0) | probably_damaging(0.995) | TCGA-BR-8368-01 | Stomach | stomach adenocarcinoma | Female | >=65 | I/II | Unknown | Unknown | SD |
| Page: 1 2 |
Top |
Related drugs of malignant transformation related genes |
| Identification of chemicals and drugs interact with genes involved in malignant transfromation |
| (DGIdb 4.0) |
| Entrez ID | Symbol | Category | Interaction Types | Drug Claim Name | Drug Name | PMIDs |
| Page: 1 |

Copyright 2023-Present -The University of Texas Health Science Center at Houston |