| Tissue | Expression Dynamics | Abbreviation |
| Esophagus | 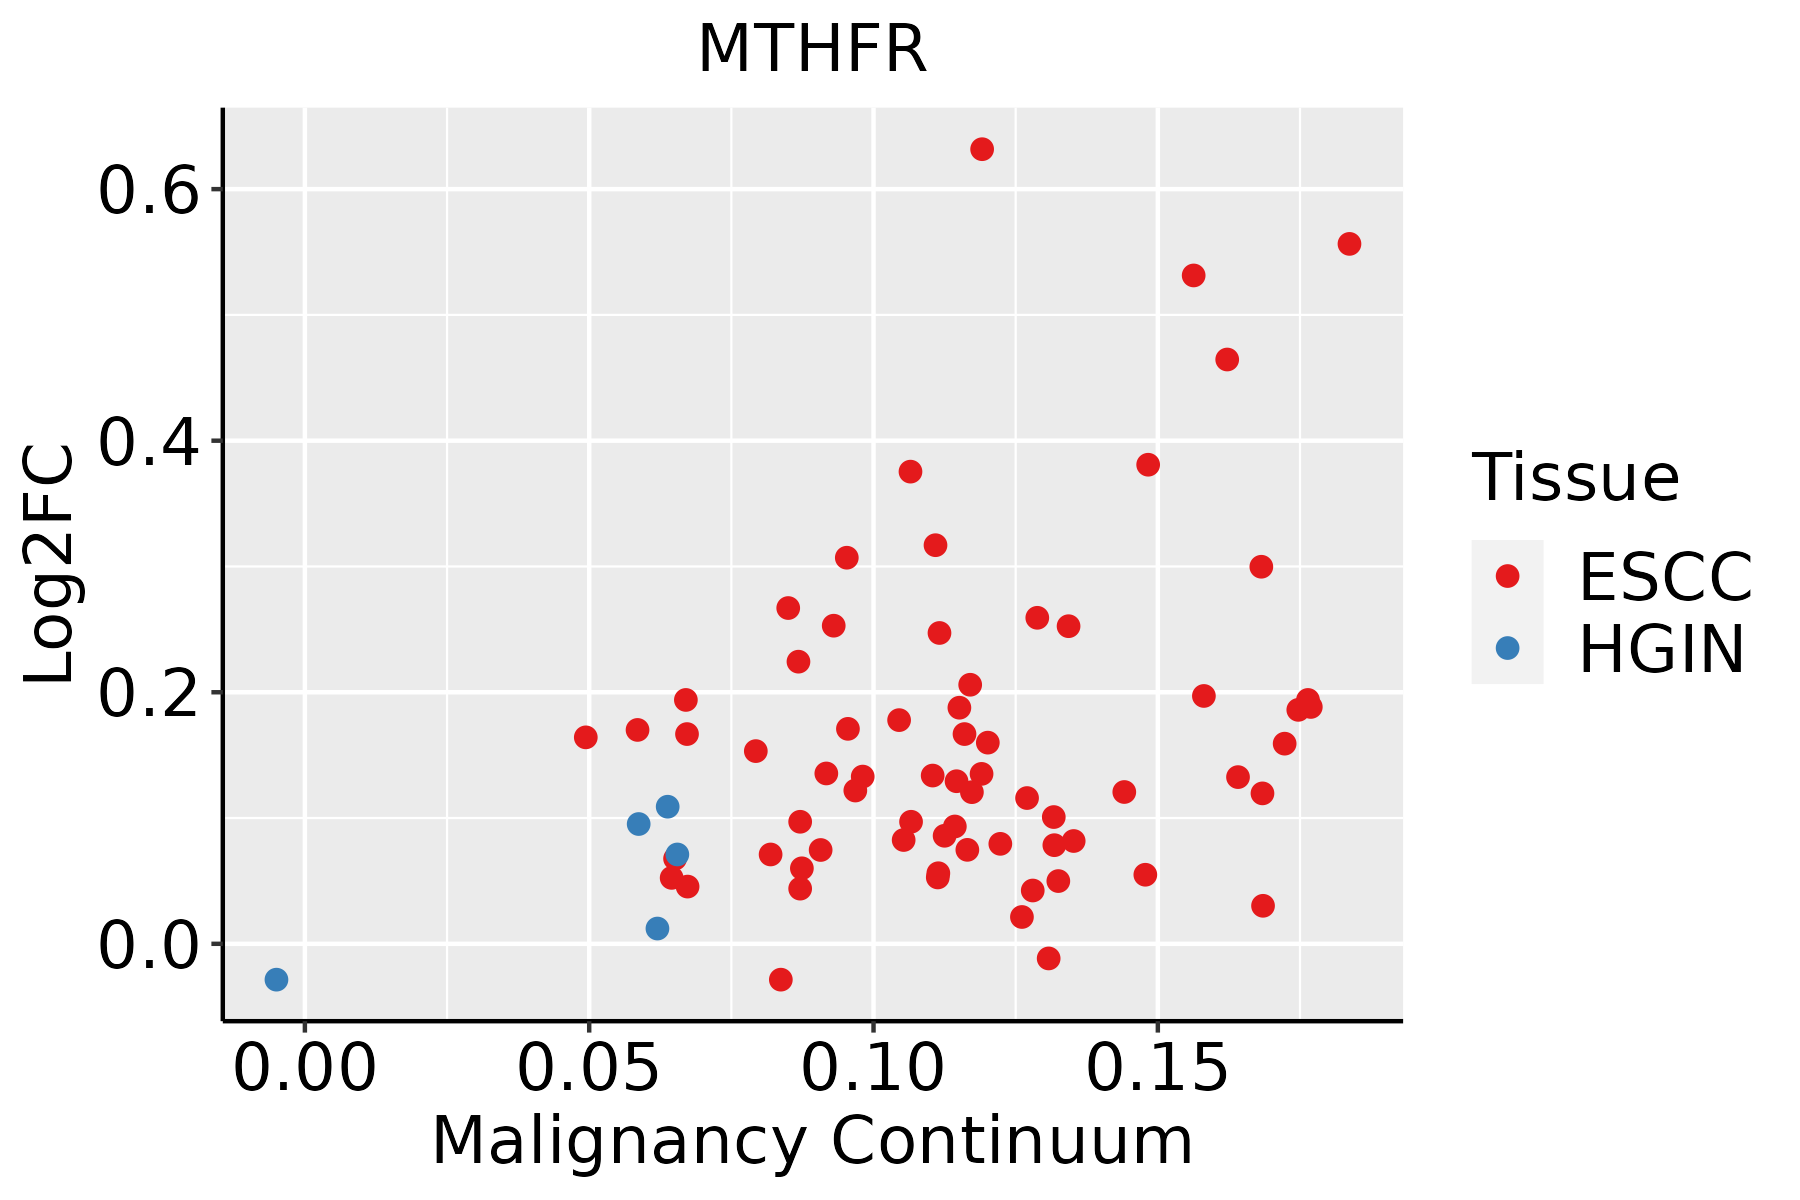 | ESCC: Esophageal squamous cell carcinoma |
| HGIN: High-grade intraepithelial neoplasias |
| LGIN: Low-grade intraepithelial neoplasias |
| Liver |  | HCC: Hepatocellular carcinoma |
| NAFLD: Non-alcoholic fatty liver disease |
| Prostate | 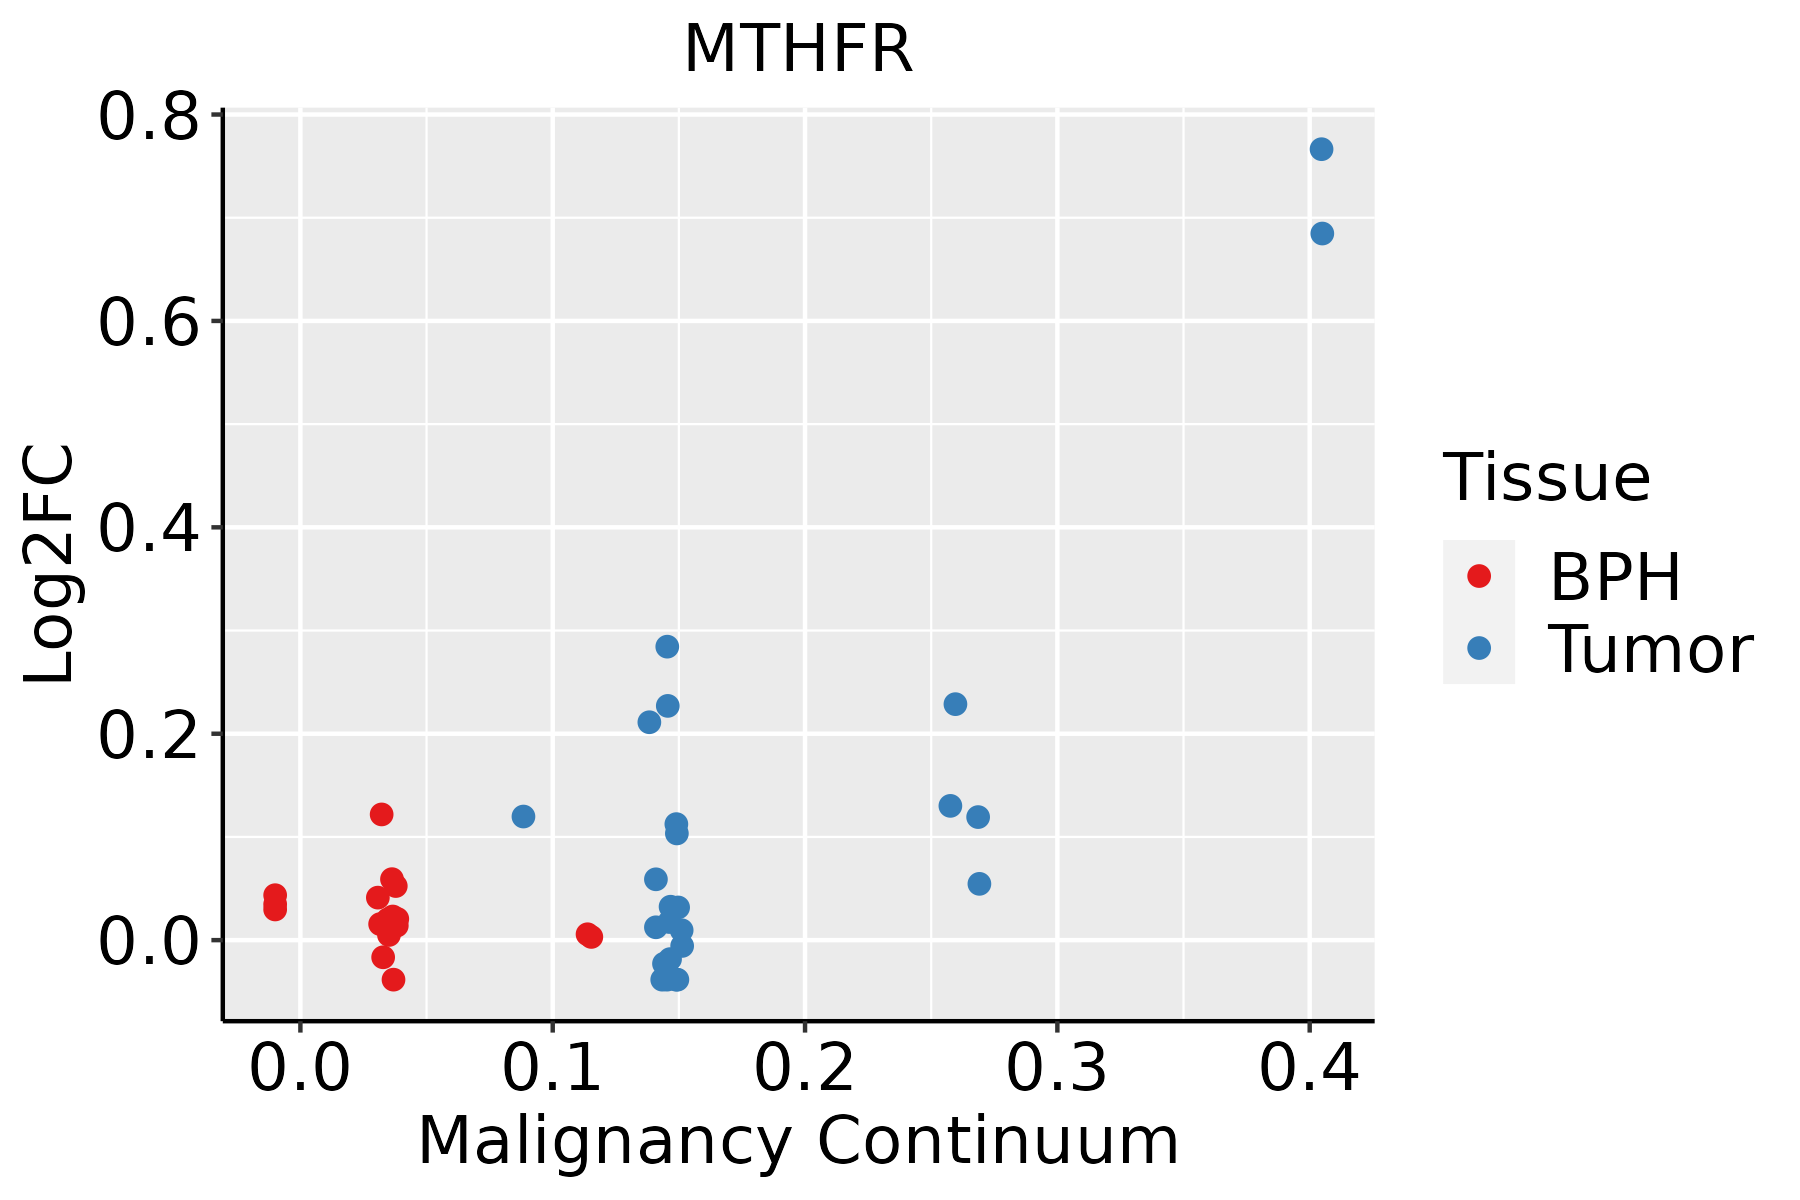 | BPH: Benign Prostatic Hyperplasia |
| Thyroid | 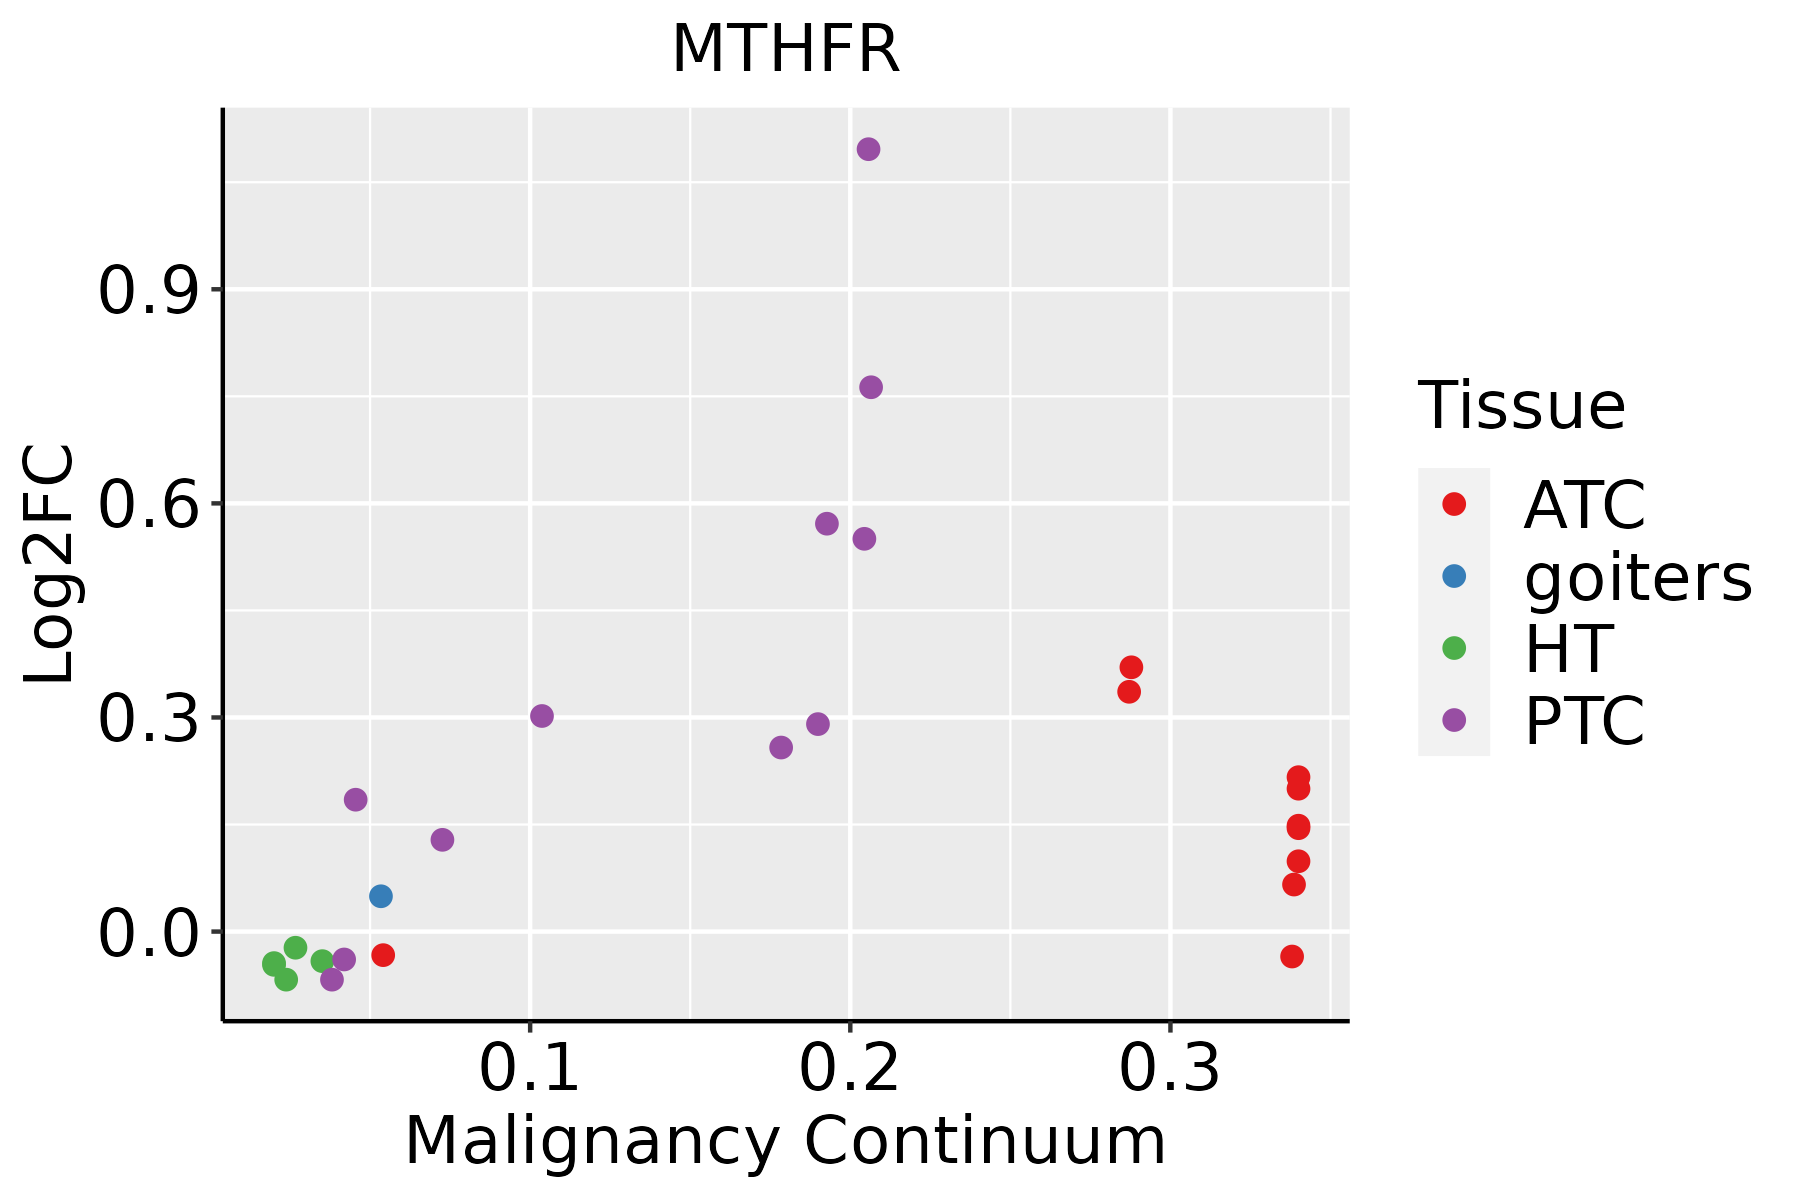 | ATC: Anaplastic thyroid cancer |
| HT: Hashimoto's thyroiditis |
| PTC: Papillary thyroid cancer |
| GO ID | Tissue | Disease Stage | Description | Gene Ratio | Bg Ratio | pvalue | p.adjust | Count |
| GO:001657015 | Esophagus | ESCC | histone modification | 323/8552 | 463/18723 | 2.61e-26 | 7.88e-24 | 323 |
| GO:0031667111 | Esophagus | ESCC | response to nutrient levels | 289/8552 | 474/18723 | 9.25e-12 | 3.47e-10 | 289 |
| GO:0070482111 | Esophagus | ESCC | response to oxygen levels | 218/8552 | 347/18723 | 6.91e-11 | 2.17e-09 | 218 |
| GO:00434143 | Esophagus | ESCC | macromolecule methylation | 199/8552 | 316/18723 | 3.44e-10 | 9.57e-09 | 199 |
| GO:0036293111 | Esophagus | ESCC | response to decreased oxygen levels | 201/8552 | 322/18723 | 8.37e-10 | 2.04e-08 | 201 |
| GO:003105614 | Esophagus | ESCC | regulation of histone modification | 106/8552 | 152/18723 | 1.52e-09 | 3.55e-08 | 106 |
| GO:0001666111 | Esophagus | ESCC | response to hypoxia | 192/8552 | 307/18723 | 1.59e-09 | 3.69e-08 | 192 |
| GO:00322592 | Esophagus | ESCC | methylation | 222/8552 | 364/18723 | 2.26e-09 | 5.09e-08 | 222 |
| GO:000184115 | Esophagus | ESCC | neural tube formation | 75/8552 | 102/18723 | 9.68e-09 | 1.95e-07 | 75 |
| GO:000184314 | Esophagus | ESCC | neural tube closure | 66/8552 | 88/18723 | 1.98e-08 | 3.82e-07 | 66 |
| GO:001402014 | Esophagus | ESCC | primary neural tube formation | 69/8552 | 94/18723 | 4.22e-08 | 7.76e-07 | 69 |
| GO:006060614 | Esophagus | ESCC | tube closure | 66/8552 | 89/18723 | 4.24e-08 | 7.76e-07 | 66 |
| GO:000758410 | Esophagus | ESCC | response to nutrient | 114/8552 | 174/18723 | 9.43e-08 | 1.56e-06 | 114 |
| GO:00219159 | Esophagus | ESCC | neural tube development | 101/8552 | 152/18723 | 1.78e-07 | 2.79e-06 | 101 |
| GO:00163316 | Esophagus | ESCC | morphogenesis of embryonic epithelium | 98/8552 | 147/18723 | 2.12e-07 | 3.27e-06 | 98 |
| GO:00067906 | Esophagus | ESCC | sulfur compound metabolic process | 201/8552 | 339/18723 | 2.64e-07 | 3.94e-06 | 201 |
| GO:000183814 | Esophagus | ESCC | embryonic epithelial tube formation | 83/8552 | 121/18723 | 2.78e-07 | 4.08e-06 | 83 |
| GO:000647914 | Esophagus | ESCC | protein methylation | 115/8552 | 181/18723 | 9.07e-07 | 1.16e-05 | 115 |
| GO:000821314 | Esophagus | ESCC | protein alkylation | 115/8552 | 181/18723 | 9.07e-07 | 1.16e-05 | 115 |
| GO:003514815 | Esophagus | ESCC | tube formation | 96/8552 | 148/18723 | 1.86e-06 | 2.16e-05 | 96 |
| Hugo Symbol | Variant Class | Variant Classification | dbSNP RS | HGVSc | HGVSp | HGVSp Short | SWISSPROT | BIOTYPE | SIFT | PolyPhen | Tumor Sample Barcode | Tissue | Histology | Sex | Age | Stage | Therapy Types | Drugs | Outcome |
| MTHFR | SNV | Missense_Mutation | | c.632G>A | p.Gly211Glu | p.G211E | P42898 | protein_coding | tolerated(0.18) | benign(0.01) | TCGA-AC-A23H-01 | Breast | breast invasive carcinoma | Female | >=65 | I/II | Unknown | Unknown | PD |
| MTHFR | SNV | Missense_Mutation | rs757268352 | c.1390N>A | p.Glu464Lys | p.E464K | P42898 | protein_coding | tolerated(0.21) | benign(0.013) | TCGA-AO-A128-01 | Breast | breast invasive carcinoma | Female | <65 | I/II | Chemotherapy | doxorubicin | SD |
| MTHFR | SNV | Missense_Mutation | | c.1681G>C | p.Glu561Gln | p.E561Q | P42898 | protein_coding | tolerated(0.08) | possibly_damaging(0.623) | TCGA-D8-A1XQ-01 | Breast | breast invasive carcinoma | Female | >=65 | I/II | Unknown | Unknown | SD |
| MTHFR | SNV | Missense_Mutation | | c.1585A>G | p.Ile529Val | p.I529V | P42898 | protein_coding | tolerated(1) | benign(0.003) | TCGA-D8-A1XQ-01 | Breast | breast invasive carcinoma | Female | >=65 | I/II | Unknown | Unknown | SD |
| MTHFR | SNV | Missense_Mutation | | c.1499N>T | p.Pro500Leu | p.P500L | P42898 | protein_coding | tolerated(0.07) | possibly_damaging(0.741) | TCGA-C5-A1M9-01 | Cervix | cervical & endocervical cancer | Female | <65 | I/II | Chemotherapy | cisplatin | PD |
| MTHFR | SNV | Missense_Mutation | rs772932189 | c.596N>A | p.Gly199Glu | p.G199E | P42898 | protein_coding | deleterious(0) | probably_damaging(0.995) | TCGA-C5-A1MH-01 | Cervix | cervical & endocervical cancer | Female | >=65 | III/IV | Chemotherapy | cisplatin | PD |
| MTHFR | SNV | Missense_Mutation | rs121434297 | c.1091N>C | p.Leu364Pro | p.L364P | P42898 | protein_coding | deleterious(0) | probably_damaging(0.999) | TCGA-C5-A3HL-01 | Cervix | cervical & endocervical cancer | Female | >=65 | I/II | Unknown | Unknown | SD |
| MTHFR | SNV | Missense_Mutation | | c.456N>A | p.Met152Ile | p.M152I | P42898 | protein_coding | tolerated(0.19) | benign(0.001) | TCGA-EK-A2R7-01 | Cervix | cervical & endocervical cancer | Female | <65 | I/II | Unknown | Unknown | SD |
| MTHFR | SNV | Missense_Mutation | | c.139A>G | p.Arg47Gly | p.R47G | P42898 | protein_coding | tolerated_low_confidence(0.07) | benign(0) | TCGA-Q1-A73O-01 | Cervix | cervical & endocervical cancer | Female | <65 | I/II | Chemotherapy | cisplatin | CR |
| MTHFR | SNV | Missense_Mutation | novel | c.867N>G | p.Ile289Met | p.I289M | P42898 | protein_coding | deleterious(0) | probably_damaging(1) | TCGA-ZJ-AB0I-01 | Cervix | cervical & endocervical cancer | Female | <65 | I/II | Unknown | Unknown | SD |
| Entrez ID | Symbol | Category | Interaction Types | Drug Claim Name | Drug Name | PMIDs |
| 4524 | MTHFR | ENZYME, CLINICALLY ACTIONABLE | | pravastatin | PRAVASTATIN | 18622257 |
| 4524 | MTHFR | ENZYME, CLINICALLY ACTIONABLE | | sulfasalazine | SULFASALAZINE | 12083967 |
| 4524 | MTHFR | ENZYME, CLINICALLY ACTIONABLE | | ETHANOL | ALCOHOL | 15894672 |
| 4524 | MTHFR | ENZYME, CLINICALLY ACTIONABLE | | olanzapine | OLANZAPINE | 24725652 |
| 4524 | MTHFR | ENZYME, CLINICALLY ACTIONABLE | | ALBUMIN | ALBUMIN HUMAN | 11531629 |
| 4524 | MTHFR | ENZYME, CLINICALLY ACTIONABLE | | leucovorin | LEUCOVORIN | 18245544,17700593,29845393,27864592,20819423,29134491,25331073,20385995,27557140,24980946,23407049 |
| 4524 | MTHFR | ENZYME, CLINICALLY ACTIONABLE | | l-methylfolate | | 27035272,27520898,31058543 |
| 4524 | MTHFR | ENZYME, CLINICALLY ACTIONABLE | | cisplatin | CISPLATIN | 21605004,29662106,27995989,20634689,19159907,19307503 |
| 4524 | MTHFR | ENZYME, CLINICALLY ACTIONABLE | | Vitamin B-complex, Incl. Combinations | | 27035272,27520898,31058543 |
| 4524 | MTHFR | ENZYME, CLINICALLY ACTIONABLE | | pemetrexed | PEMETREXED | 29662106,24732178,20634689,19307503 |


