
|
|||||
|
 | |
| |
| |
| |
| |
| |
|
Gene: MTHFD2 |
Gene summary for MTHFD2 |
| Gene information | Species | Human | Gene symbol | MTHFD2 | Gene ID | 10797 |
| Gene name | methylenetetrahydrofolate dehydrogenase (NADP+ dependent) 2, methenyltetrahydrofolate cyclohydrolase | |
| Gene Alias | NMDMC | |
| Cytomap | 2p13.1 | |
| Gene Type | protein-coding | GO ID | GO:0006082 | UniProtAcc | P13995 |
Top |
Malignant transformation analysis |
| Identification of the aberrant gene expression in precancerous and cancerous lesions by comparing the gene expression of stem-like cells in diseased tissues with normal stem cells |
| Entrez ID | Symbol | Replicates | Species | Organ | Tissue | Adj P-value | Log2FC | Malignancy |
| 10797 | MTHFD2 | LZE2T | Human | Esophagus | ESCC | 1.02e-08 | 1.32e+00 | 0.082 |
| 10797 | MTHFD2 | LZE4T | Human | Esophagus | ESCC | 4.71e-28 | 8.91e-01 | 0.0811 |
| 10797 | MTHFD2 | LZE7T | Human | Esophagus | ESCC | 8.95e-13 | 1.63e+00 | 0.0667 |
| 10797 | MTHFD2 | LZE8T | Human | Esophagus | ESCC | 1.83e-05 | 2.25e-01 | 0.067 |
| 10797 | MTHFD2 | LZE20T | Human | Esophagus | ESCC | 9.94e-03 | 1.91e-01 | 0.0662 |
| 10797 | MTHFD2 | LZE21D1 | Human | Esophagus | HGIN | 3.13e-07 | 4.58e-01 | 0.0632 |
| 10797 | MTHFD2 | LZE22D1 | Human | Esophagus | HGIN | 5.16e-05 | 3.18e-01 | 0.0595 |
| 10797 | MTHFD2 | LZE22T | Human | Esophagus | ESCC | 1.59e-07 | 8.54e-01 | 0.068 |
| 10797 | MTHFD2 | LZE24T | Human | Esophagus | ESCC | 1.31e-17 | 8.12e-01 | 0.0596 |
| 10797 | MTHFD2 | LZE21T | Human | Esophagus | ESCC | 3.68e-06 | 8.87e-01 | 0.0655 |
| 10797 | MTHFD2 | LZE6T | Human | Esophagus | ESCC | 3.12e-16 | 1.07e+00 | 0.0845 |
| 10797 | MTHFD2 | P1T-E | Human | Esophagus | ESCC | 4.36e-10 | 9.48e-01 | 0.0875 |
| 10797 | MTHFD2 | P2T-E | Human | Esophagus | ESCC | 8.07e-56 | 1.70e+00 | 0.1177 |
| 10797 | MTHFD2 | P4T-E | Human | Esophagus | ESCC | 7.89e-51 | 1.82e+00 | 0.1323 |
| 10797 | MTHFD2 | P5T-E | Human | Esophagus | ESCC | 1.71e-63 | 1.51e+00 | 0.1327 |
| 10797 | MTHFD2 | P8T-E | Human | Esophagus | ESCC | 9.35e-14 | 3.42e-01 | 0.0889 |
| 10797 | MTHFD2 | P9T-E | Human | Esophagus | ESCC | 3.86e-10 | 3.12e-01 | 0.1131 |
| 10797 | MTHFD2 | P10T-E | Human | Esophagus | ESCC | 2.12e-23 | 9.01e-01 | 0.116 |
| 10797 | MTHFD2 | P11T-E | Human | Esophagus | ESCC | 5.17e-18 | 1.08e+00 | 0.1426 |
| 10797 | MTHFD2 | P12T-E | Human | Esophagus | ESCC | 8.28e-37 | 1.07e+00 | 0.1122 |
| Page: 1 2 3 4 5 6 |
| Tissue | Expression Dynamics | Abbreviation |
| Esophagus | 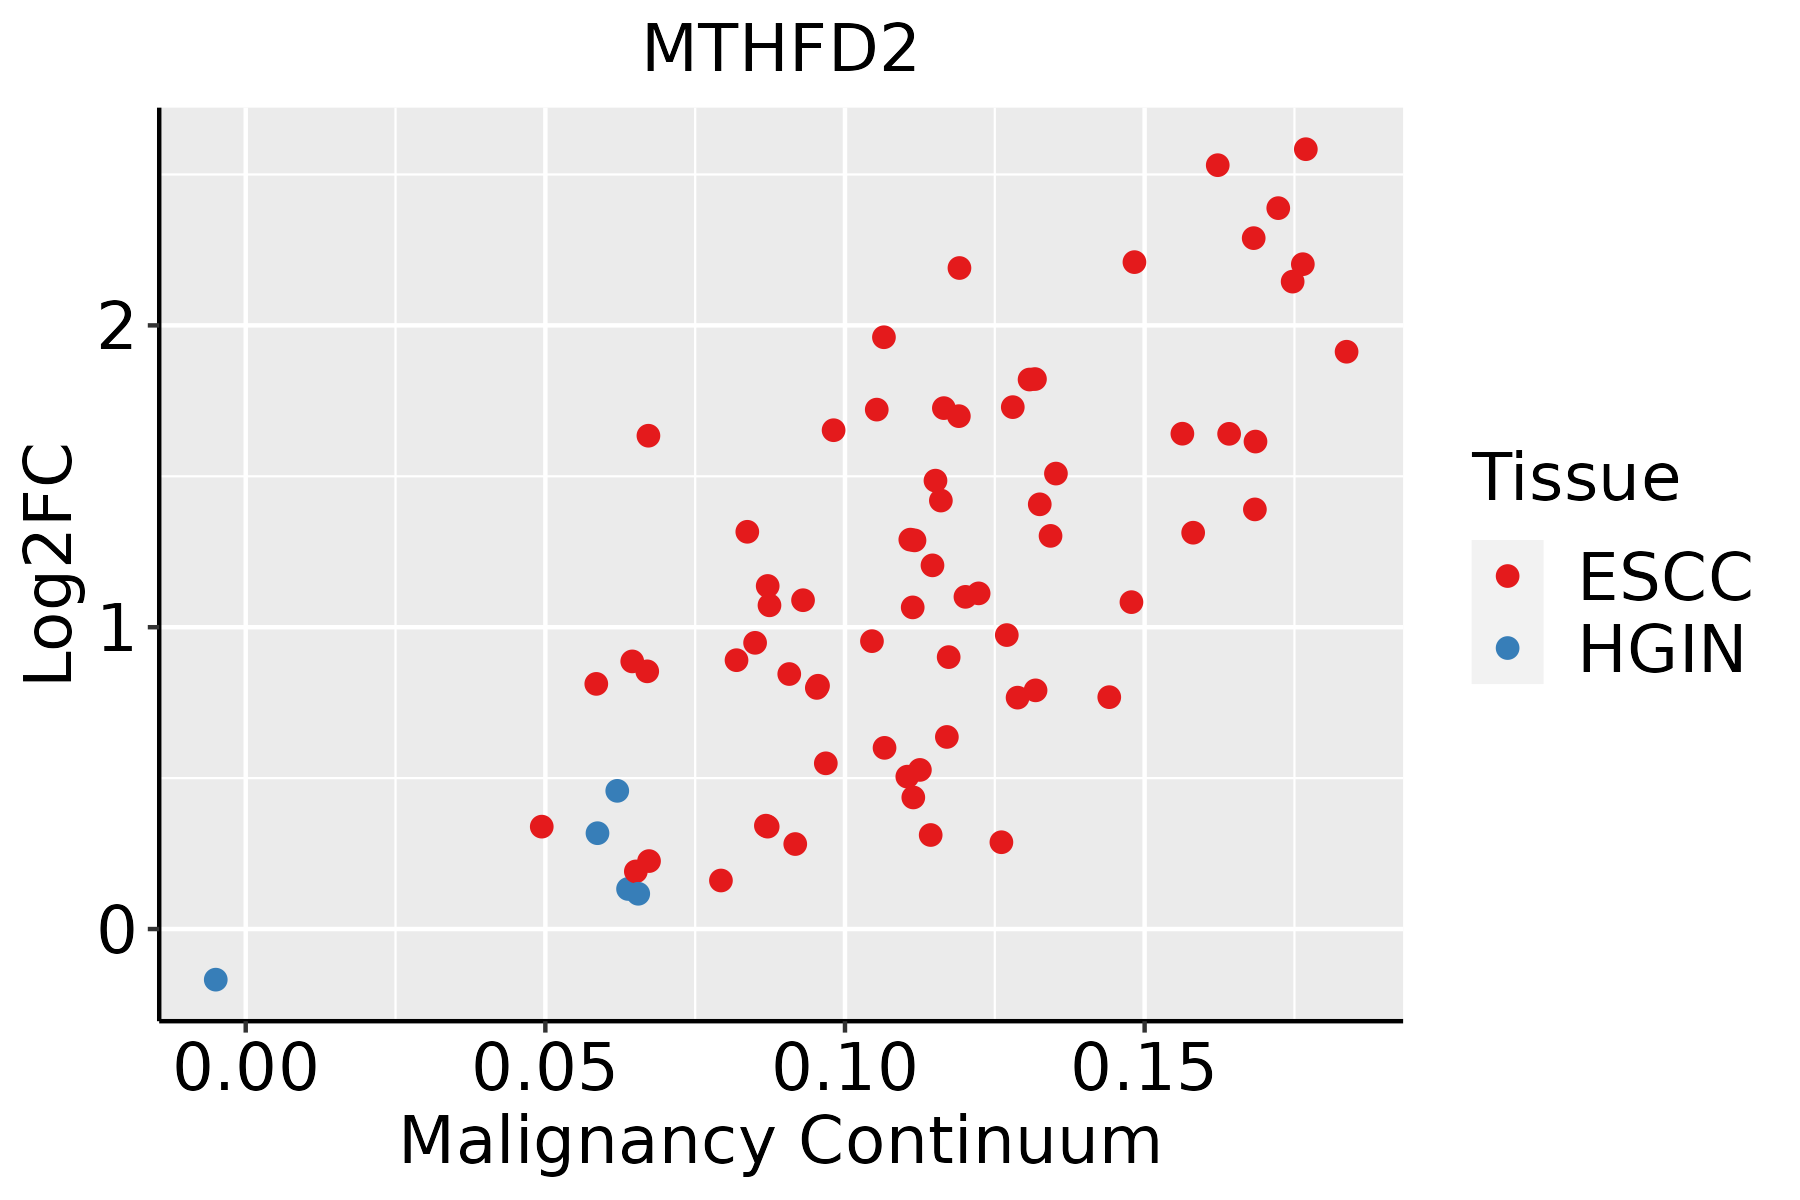 | ESCC: Esophageal squamous cell carcinoma |
| HGIN: High-grade intraepithelial neoplasias | ||
| LGIN: Low-grade intraepithelial neoplasias | ||
| Liver | 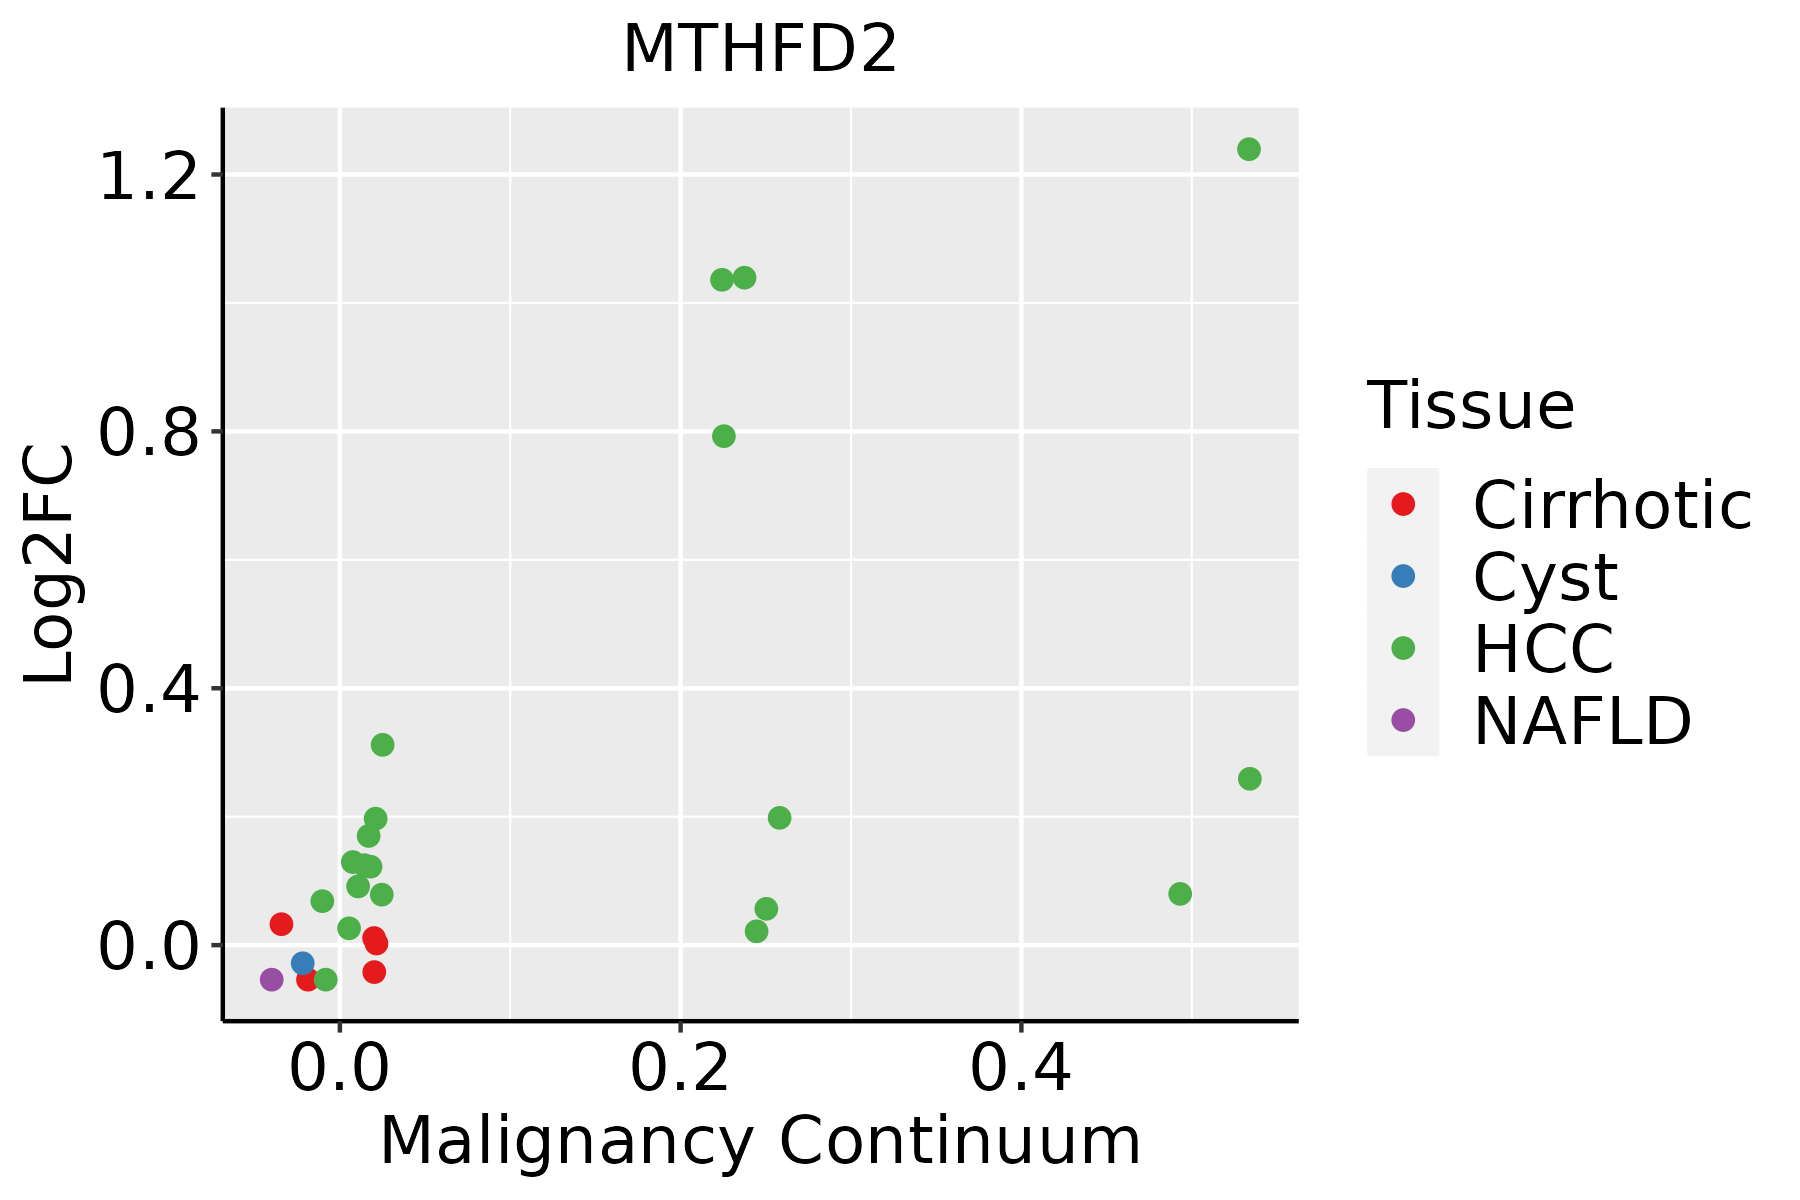 | HCC: Hepatocellular carcinoma |
| NAFLD: Non-alcoholic fatty liver disease | ||
| Oral Cavity | 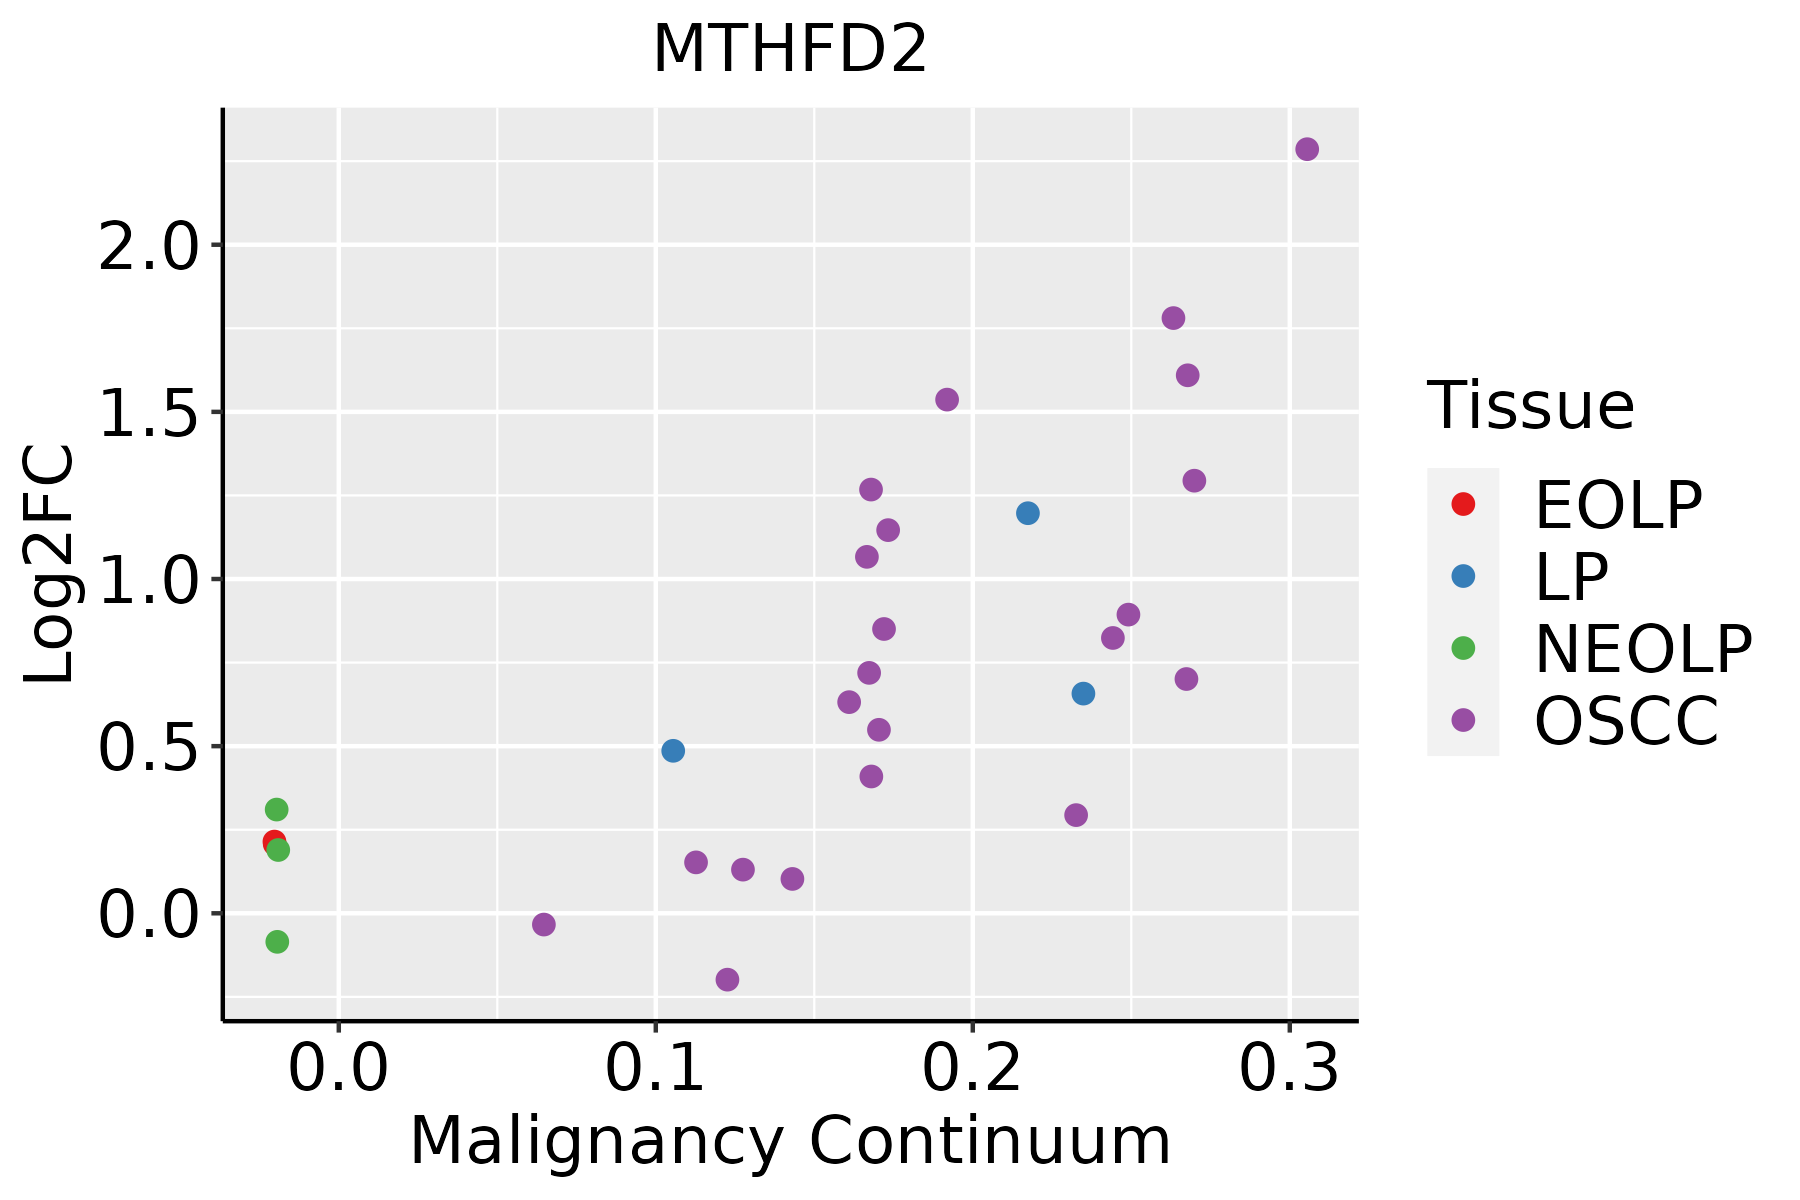 | EOLP: Erosive Oral lichen planus |
| LP: leukoplakia | ||
| NEOLP: Non-erosive oral lichen planus | ||
| OSCC: Oral squamous cell carcinoma | ||
| Skin |  | AK: Actinic keratosis |
| cSCC: Cutaneous squamous cell carcinoma | ||
| SCCIS:squamous cell carcinoma in situ | ||
| Thyroid | 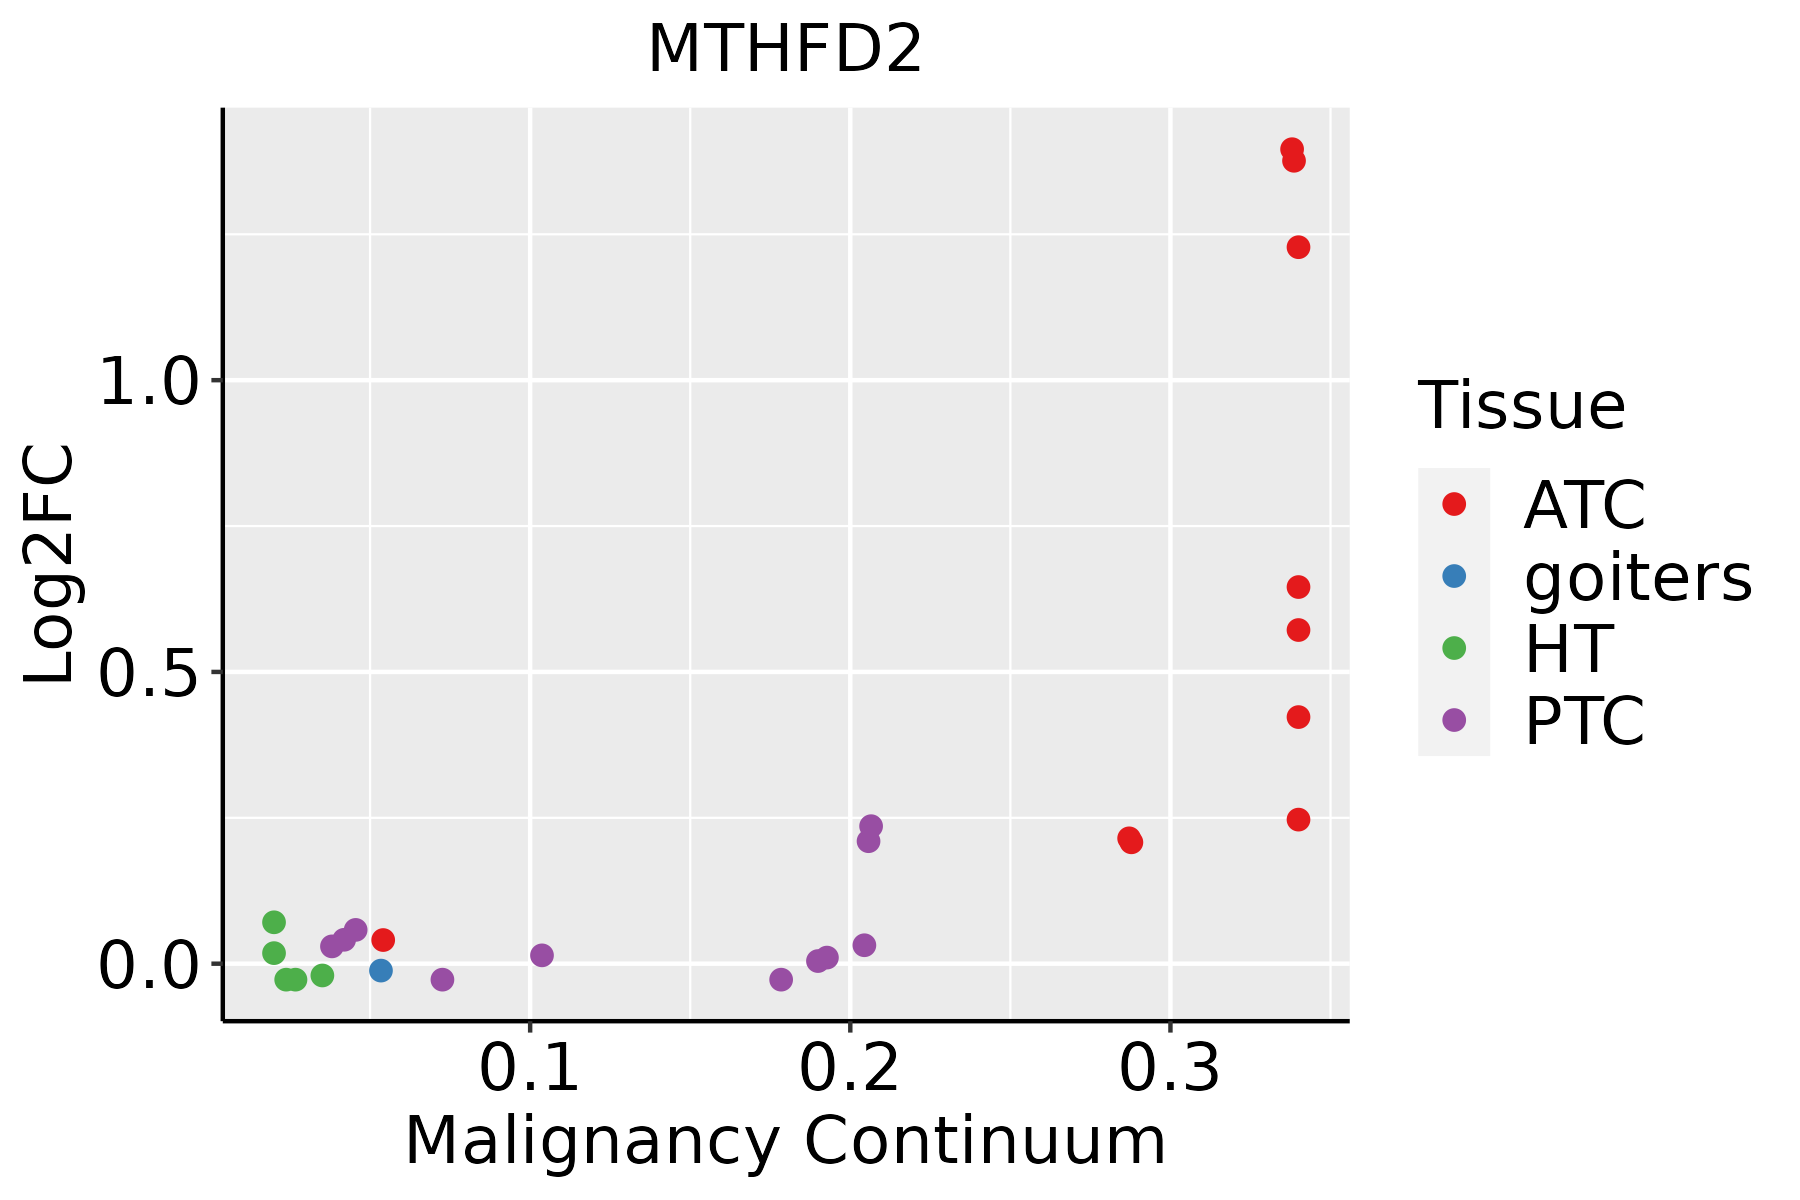 | ATC: Anaplastic thyroid cancer |
| HT: Hashimoto's thyroiditis | ||
| PTC: Papillary thyroid cancer |
| ∗log2FC in expression of this searched gene in stem-like cells from each diseased tissue sample relative to stem-like cells in normal samples in each tissue plotted against the malignancy continuum. Samples are colored based on if they are from different disease stage. |
Top |
Malignant transformation related pathway analysis |
| Find out the enriched GO biological processes and KEGG pathways involved in transition from healthy to precancer to cancer |
| Tissue | Disease Stage | Enriched GO biological Processes |
| Colorectum | AD |  |
| Colorectum | SER |  |
| Colorectum | MSS |  |
| Colorectum | MSI-H |  |
| Colorectum | FAP |  |
| ∗Top 15 enriched GO BP terms are showed in the bar plot of each disease state in each tissue. Each row represents a significant GO biological process which is colored according to the -log10(p.adjust). |
| Page: 1 2 3 4 5 6 7 8 9 |
| GO ID | Tissue | Disease Stage | Description | Gene Ratio | Bg Ratio | pvalue | p.adjust | Count |
| GO:0006753110 | Esophagus | ESCC | nucleoside phosphate metabolic process | 288/8552 | 497/18723 | 1.80e-08 | 3.50e-07 | 288 |
| GO:0009117111 | Esophagus | ESCC | nucleotide metabolic process | 282/8552 | 489/18723 | 4.70e-08 | 8.50e-07 | 282 |
| GO:00067906 | Esophagus | ESCC | sulfur compound metabolic process | 201/8552 | 339/18723 | 2.64e-07 | 3.94e-06 | 201 |
| GO:0072521111 | Esophagus | ESCC | purine-containing compound metabolic process | 238/8552 | 416/18723 | 1.20e-06 | 1.49e-05 | 238 |
| GO:00442725 | Esophagus | ESCC | sulfur compound biosynthetic process | 96/8552 | 148/18723 | 1.86e-06 | 2.16e-05 | 96 |
| GO:0006163111 | Esophagus | ESCC | purine nucleotide metabolic process | 226/8552 | 396/18723 | 2.81e-06 | 3.21e-05 | 226 |
| GO:000916516 | Esophagus | ESCC | nucleotide biosynthetic process | 150/8552 | 254/18723 | 1.12e-05 | 1.06e-04 | 150 |
| GO:190129316 | Esophagus | ESCC | nucleoside phosphate biosynthetic process | 151/8552 | 256/18723 | 1.15e-05 | 1.08e-04 | 151 |
| GO:007252217 | Esophagus | ESCC | purine-containing compound biosynthetic process | 120/8552 | 200/18723 | 3.02e-05 | 2.51e-04 | 120 |
| GO:00065757 | Esophagus | ESCC | cellular modified amino acid metabolic process | 112/8552 | 188/18723 | 8.31e-05 | 6.06e-04 | 112 |
| GO:000616417 | Esophagus | ESCC | purine nucleotide biosynthetic process | 113/8552 | 191/18723 | 1.16e-04 | 8.04e-04 | 113 |
| GO:00086525 | Esophagus | ESCC | cellular amino acid biosynthetic process | 51/8552 | 76/18723 | 1.30e-04 | 8.88e-04 | 51 |
| GO:00067671 | Esophagus | ESCC | water-soluble vitamin metabolic process | 41/8552 | 59/18723 | 1.84e-04 | 1.17e-03 | 41 |
| GO:00463948 | Esophagus | ESCC | carboxylic acid biosynthetic process | 175/8552 | 314/18723 | 1.98e-04 | 1.26e-03 | 175 |
| GO:00067661 | Esophagus | ESCC | vitamin metabolic process | 67/8552 | 106/18723 | 2.03e-04 | 1.28e-03 | 67 |
| GO:00160538 | Esophagus | ESCC | organic acid biosynthetic process | 175/8552 | 316/18723 | 3.04e-04 | 1.82e-03 | 175 |
| GO:00425584 | Esophagus | ESCC | pteridine-containing compound metabolic process | 25/8552 | 33/18723 | 4.30e-04 | 2.43e-03 | 25 |
| GO:19016075 | Esophagus | ESCC | alpha-amino acid biosynthetic process | 45/8552 | 68/18723 | 5.13e-04 | 2.84e-03 | 45 |
| GO:00090674 | Esophagus | ESCC | aspartate family amino acid biosynthetic process | 17/8552 | 21/18723 | 1.03e-03 | 5.19e-03 | 17 |
| GO:00436485 | Esophagus | ESCC | dicarboxylic acid metabolic process | 58/8552 | 96/18723 | 2.55e-03 | 1.09e-02 | 58 |
| Page: 1 2 3 4 5 6 7 8 9 |
| Pathway ID | Tissue | Disease Stage | Description | Gene Ratio | Bg Ratio | pvalue | p.adjust | qvalue | Count |
| hsa012405 | Esophagus | ESCC | Biosynthesis of cofactors | 97/4205 | 153/8465 | 3.88e-04 | 1.35e-03 | 6.94e-04 | 97 |
| hsa0124012 | Esophagus | ESCC | Biosynthesis of cofactors | 97/4205 | 153/8465 | 3.88e-04 | 1.35e-03 | 6.94e-04 | 97 |
| hsa012402 | Liver | HCC | Biosynthesis of cofactors | 103/4020 | 153/8465 | 4.67e-07 | 5.05e-06 | 2.81e-06 | 103 |
| hsa006702 | Liver | HCC | One carbon pool by folate | 17/4020 | 20/8465 | 6.04e-04 | 2.50e-03 | 1.39e-03 | 17 |
| hsa012403 | Liver | HCC | Biosynthesis of cofactors | 103/4020 | 153/8465 | 4.67e-07 | 5.05e-06 | 2.81e-06 | 103 |
| hsa0067011 | Liver | HCC | One carbon pool by folate | 17/4020 | 20/8465 | 6.04e-04 | 2.50e-03 | 1.39e-03 | 17 |
| hsa012404 | Oral cavity | OSCC | Biosynthesis of cofactors | 88/3704 | 153/8465 | 3.84e-04 | 1.20e-03 | 6.12e-04 | 88 |
| hsa0124011 | Oral cavity | OSCC | Biosynthesis of cofactors | 88/3704 | 153/8465 | 3.84e-04 | 1.20e-03 | 6.12e-04 | 88 |
| Page: 1 |
Top |
Cell-cell communication analysis |
| Identification of potential cell-cell interactions between two cell types and their ligand-receptor pairs for different disease states |
| Ligand | Receptor | LRpair | Pathway | Tissue | Disease Stage |
| Page: 1 |
Top |
Single-cell gene regulatory network inference analysis |
| Find out the significant the regulons (TFs) and the target genes of each regulon across cell types for different disease states |
| TF | Cell Type | Tissue | Disease Stage | Target Gene | RSS | Regulon Activity |
| ∗The dot plots of a searched regulon are shown for all cell subpopulations in each disease state of each tissue based on the regulon specific score inferred using pySCENIC and by calculating the average expression. |
| Page: 1 |
Top |
Somatic mutation of malignant transformation related genes |
| Annotation of somatic variants for genes involved in malignant transformation |
| Hugo Symbol | Variant Class | Variant Classification | dbSNP RS | HGVSc | HGVSp | HGVSp Short | SWISSPROT | BIOTYPE | SIFT | PolyPhen | Tumor Sample Barcode | Tissue | Histology | Sex | Age | Stage | Therapy Types | Drugs | Outcome |
| MTHFD2 | SNV | Missense_Mutation | c.582N>C | p.Lys194Asn | p.K194N | P13995 | protein_coding | deleterious(0) | probably_damaging(0.99) | TCGA-A2-A0YK-01 | Breast | breast invasive carcinoma | Female | <65 | I/II | Chemotherapy | cytoxan | SD | |
| MTHFD2 | SNV | Missense_Mutation | c.254N>A | p.Val85Asp | p.V85D | P13995 | protein_coding | deleterious(0) | probably_damaging(0.998) | TCGA-AO-A0JC-01 | Breast | breast invasive carcinoma | Female | <65 | I/II | Chemotherapy | fluorouracil | SD | |
| MTHFD2 | insertion | Frame_Shift_Ins | novel | c.534_535insTCTCTCCCTCCCCATCCCCCTCCTCCTCCCTCTCCTTTCCT | p.Gly179SerfsTer19 | p.G179Sfs*19 | P13995 | protein_coding | TCGA-A8-A09T-01 | Breast | breast invasive carcinoma | Female | >=65 | I/II | Hormone Therapy | anastrozole | SD | ||
| MTHFD2 | SNV | Missense_Mutation | rs771539434 | c.76N>T | p.Arg26Cys | p.R26C | P13995 | protein_coding | tolerated(0.18) | benign(0.006) | TCGA-4J-AA1J-01 | Cervix | cervical & endocervical cancer | Female | <65 | I/II | Unknown | Unknown | SD |
| MTHFD2 | SNV | Missense_Mutation | c.644C>T | p.Thr215Ile | p.T215I | P13995 | protein_coding | deleterious(0.01) | possibly_damaging(0.783) | TCGA-EK-A3GK-01 | Cervix | cervical & endocervical cancer | Female | <65 | I/II | Unknown | Unknown | SD | |
| MTHFD2 | SNV | Missense_Mutation | c.70N>G | p.Arg24Gly | p.R24G | P13995 | protein_coding | tolerated(0.23) | benign(0.026) | TCGA-JW-A5VL-01 | Cervix | cervical & endocervical cancer | Female | <65 | I/II | Unknown | Unknown | SD | |
| MTHFD2 | SNV | Missense_Mutation | c.283N>A | p.Val95Met | p.V95M | P13995 | protein_coding | deleterious(0.02) | possibly_damaging(0.619) | TCGA-AA-3492-01 | Colorectum | colon adenocarcinoma | Female | >=65 | I/II | Unknown | Unknown | SD | |
| MTHFD2 | SNV | Missense_Mutation | c.947N>T | p.Thr316Ile | p.T316I | P13995 | protein_coding | deleterious(0) | probably_damaging(1) | TCGA-AZ-6601-01 | Colorectum | colon adenocarcinoma | Male | >=65 | I/II | Unknown | Unknown | PD | |
| MTHFD2 | SNV | Missense_Mutation | novel | c.1018N>A | p.Leu340Met | p.L340M | P13995 | protein_coding | deleterious_low_confidence(0.05) | benign(0.201) | TCGA-AP-A0LM-01 | Endometrium | uterine corpus endometrioid carcinoma | Female | <65 | III/IV | Chemotherapy | cisplatin | SD |
| MTHFD2 | SNV | Missense_Mutation | novel | c.859N>T | p.Pro287Ser | p.P287S | P13995 | protein_coding | tolerated(0.42) | benign(0.006) | TCGA-AP-A1DK-01 | Endometrium | uterine corpus endometrioid carcinoma | Female | <65 | I/II | Unknown | Unknown | SD |
| Page: 1 2 3 4 |
Top |
Related drugs of malignant transformation related genes |
| Identification of chemicals and drugs interact with genes involved in malignant transfromation |
| (DGIdb 4.0) |
| Entrez ID | Symbol | Category | Interaction Types | Drug Claim Name | Drug Name | PMIDs |
| Page: 1 |

Copyright 2023-Present -The University of Texas Health Science Center at Houston |