| Tissue | Expression Dynamics | Abbreviation |
| Cervix | 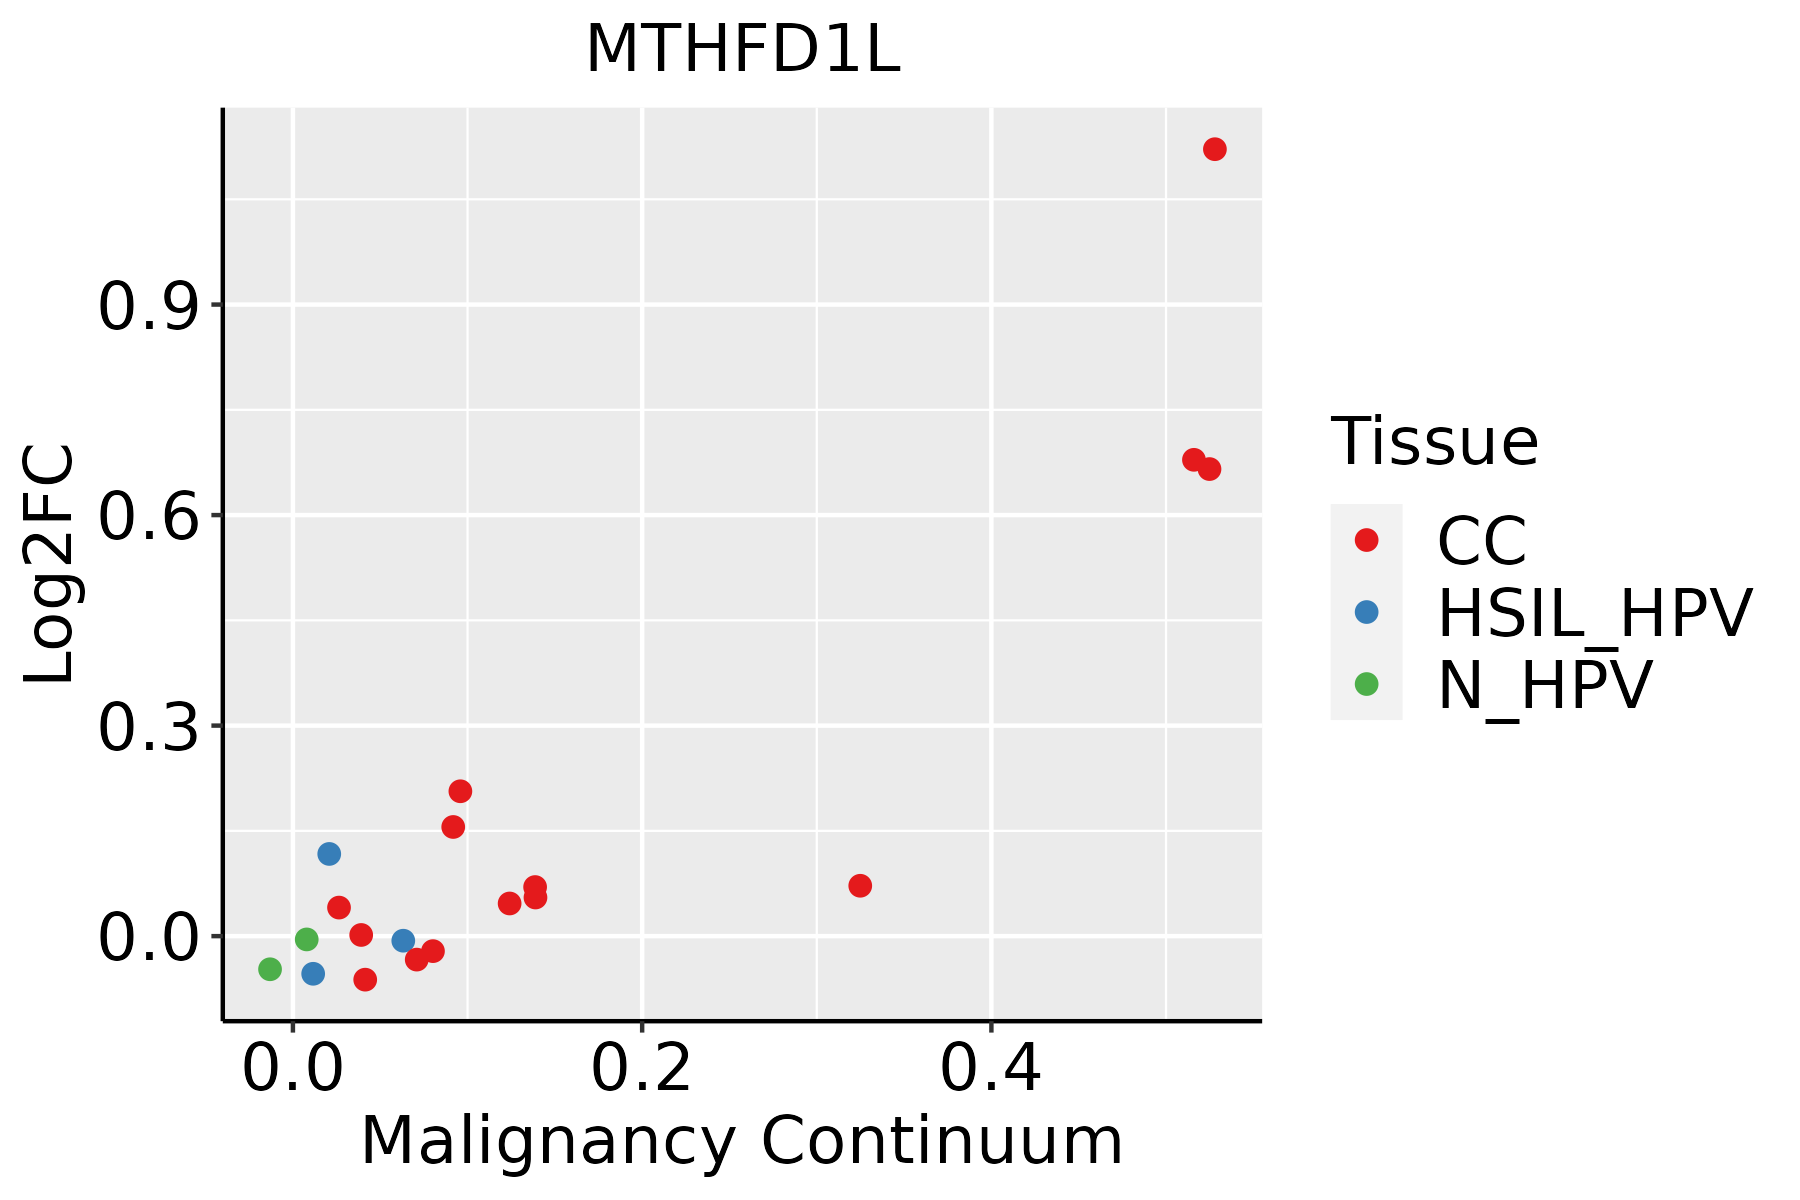 | CC: Cervix cancer |
| HSIL_HPV: HPV-infected high-grade squamous intraepithelial lesions |
| N_HPV: HPV-infected normal cervix |
| Colorectum (GSE201348) | 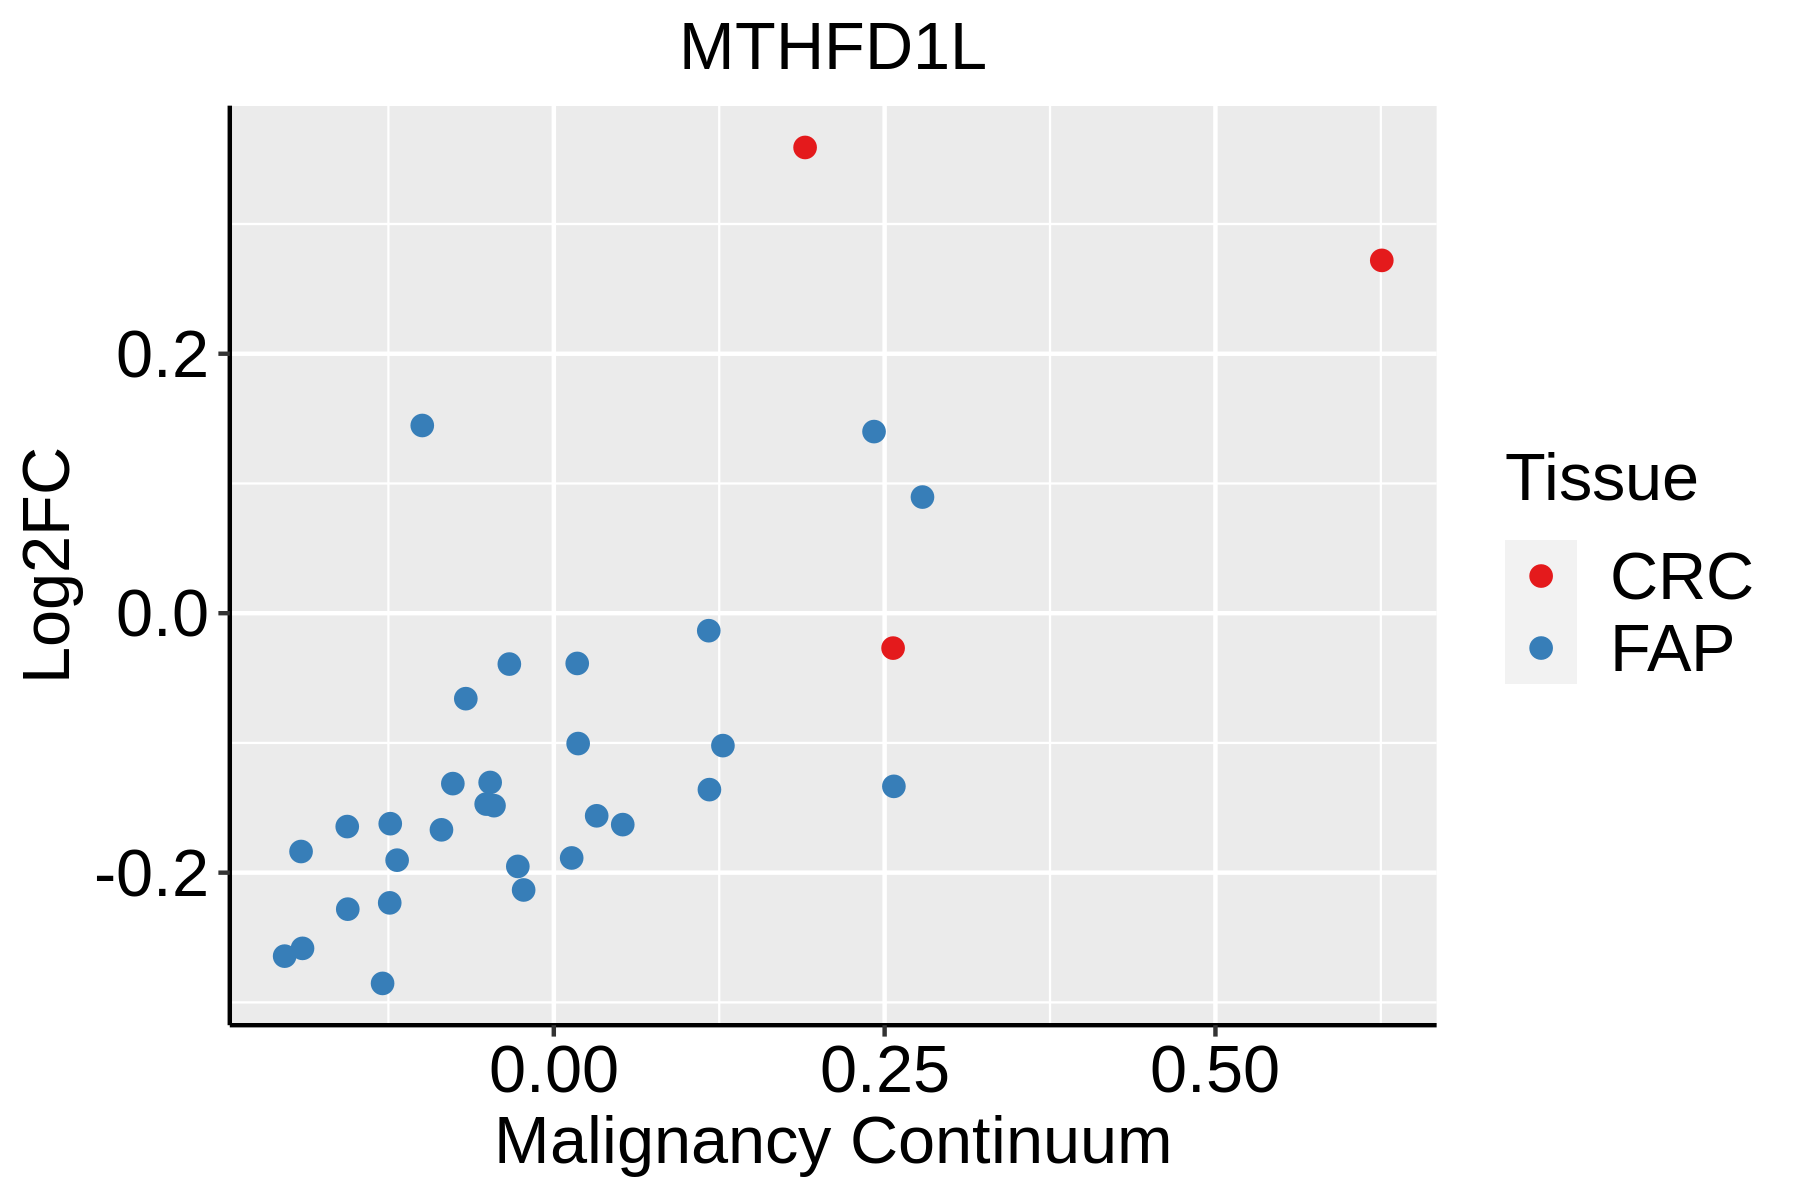 | FAP: Familial adenomatous polyposis |
| CRC: Colorectal cancer |
| Colorectum (HTA11) |  | AD: Adenomas |
| SER: Sessile serrated lesions |
| MSI-H: Microsatellite-high colorectal cancer |
| MSS: Microsatellite stable colorectal cancer |
| Endometrium | 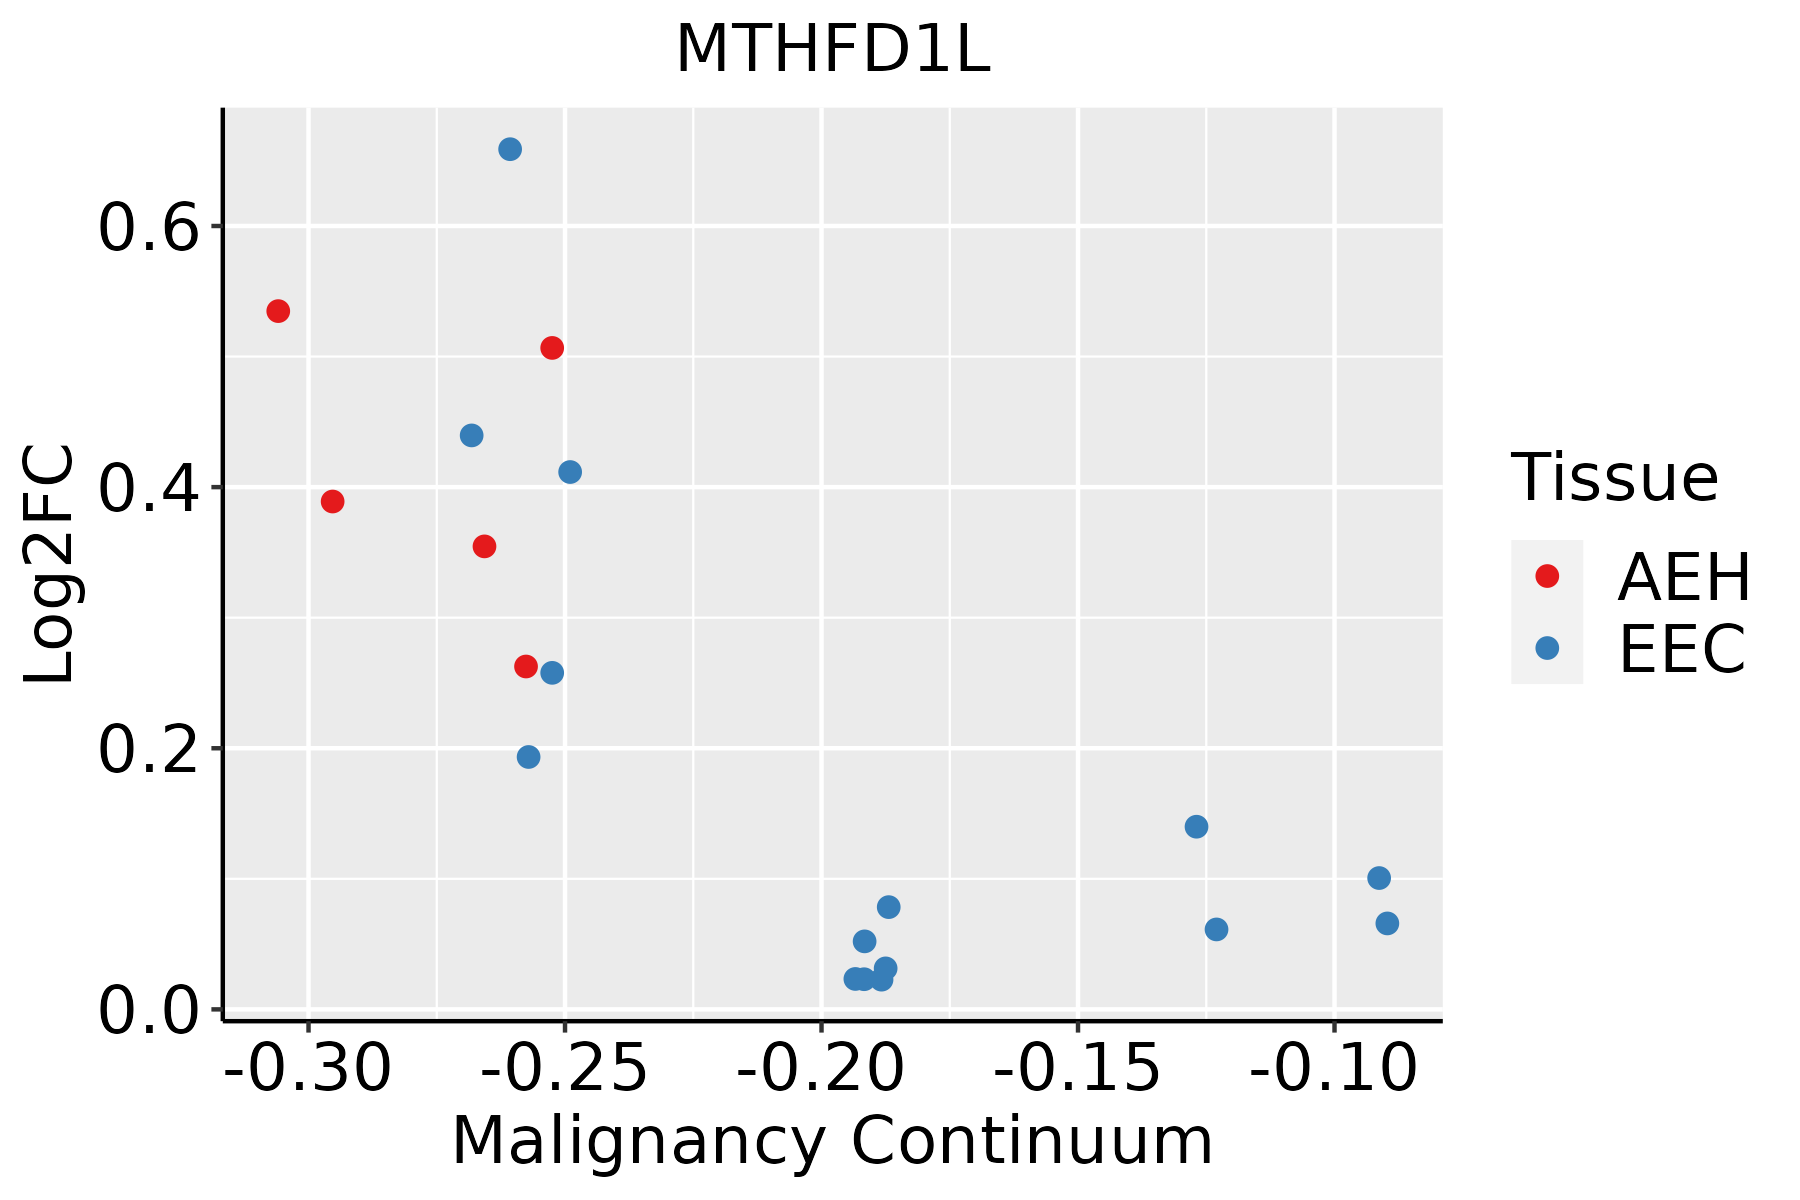 | AEH: Atypical endometrial hyperplasia |
| EEC: Endometrioid Cancer |
| Esophagus | 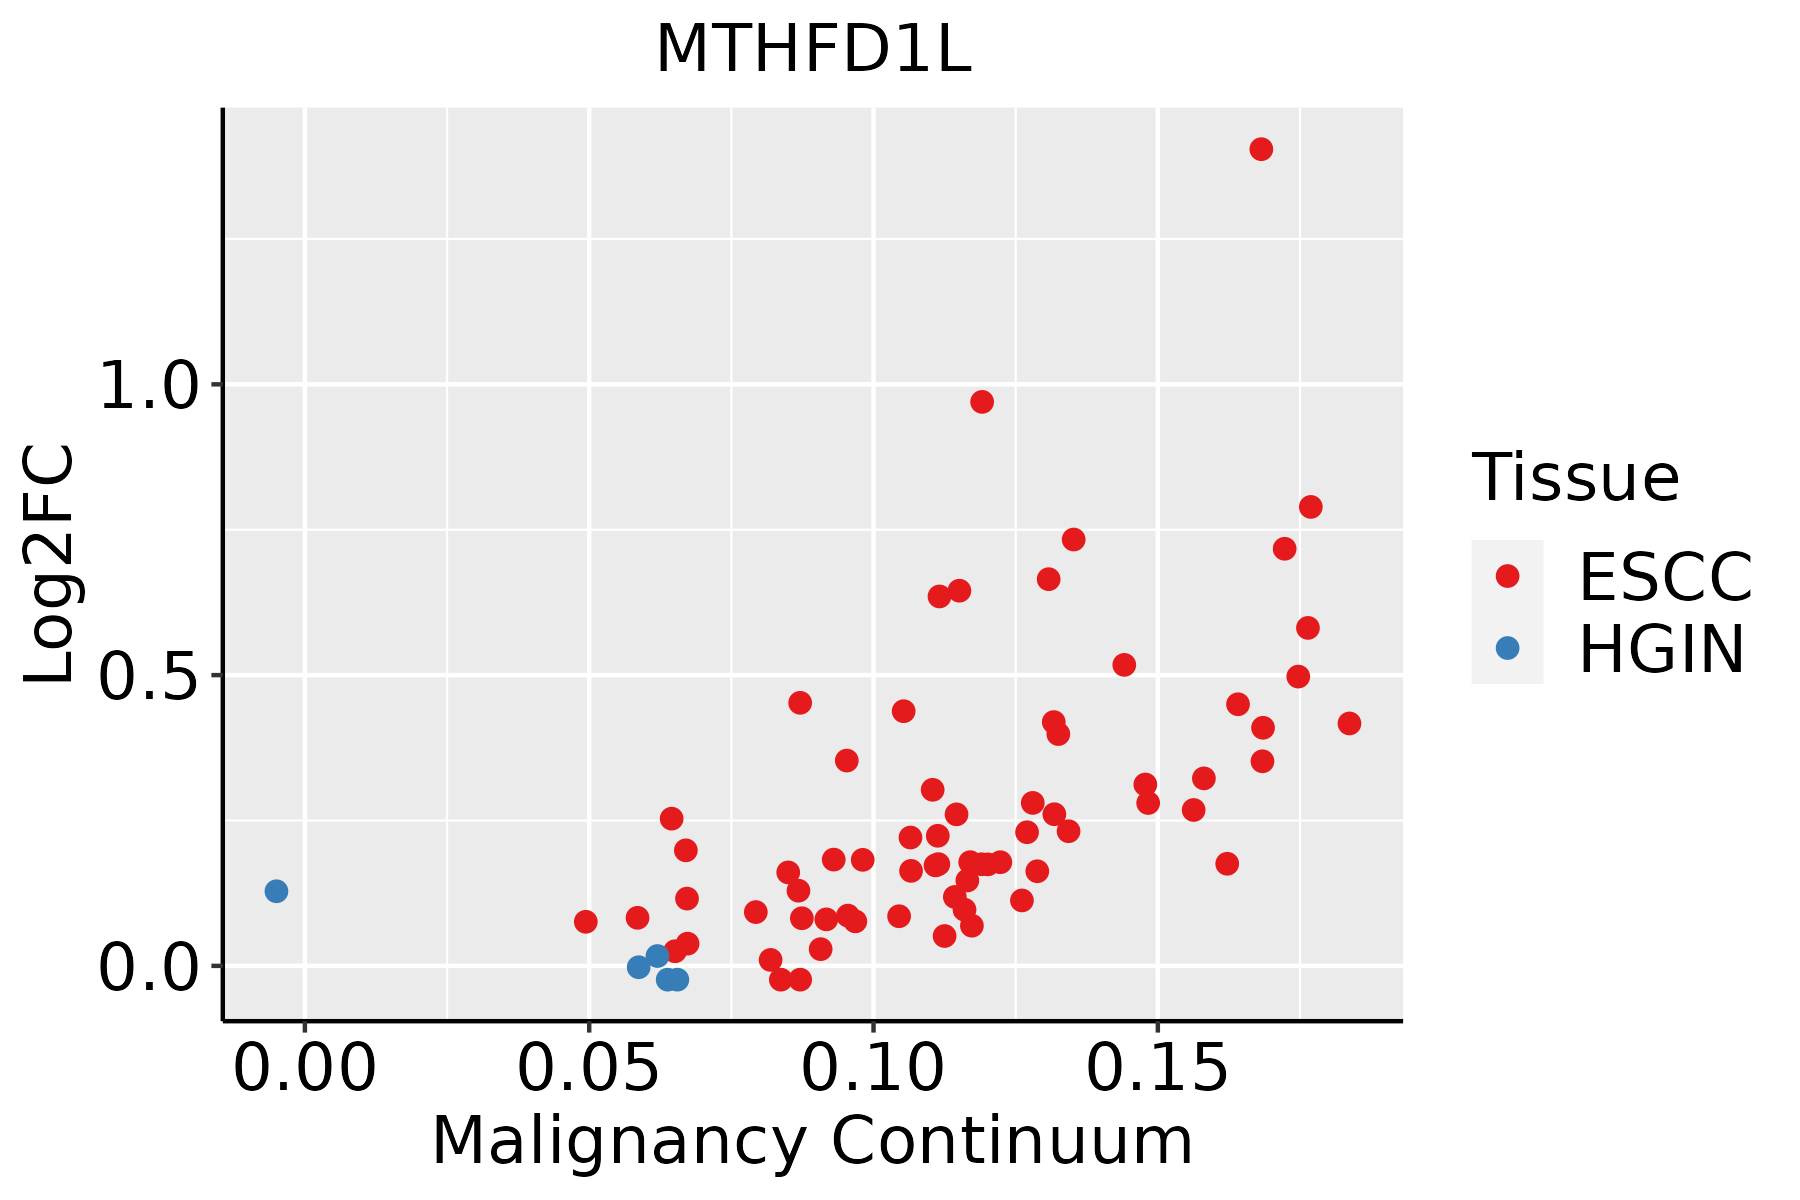 | ESCC: Esophageal squamous cell carcinoma |
| HGIN: High-grade intraepithelial neoplasias |
| LGIN: Low-grade intraepithelial neoplasias |
| Liver | 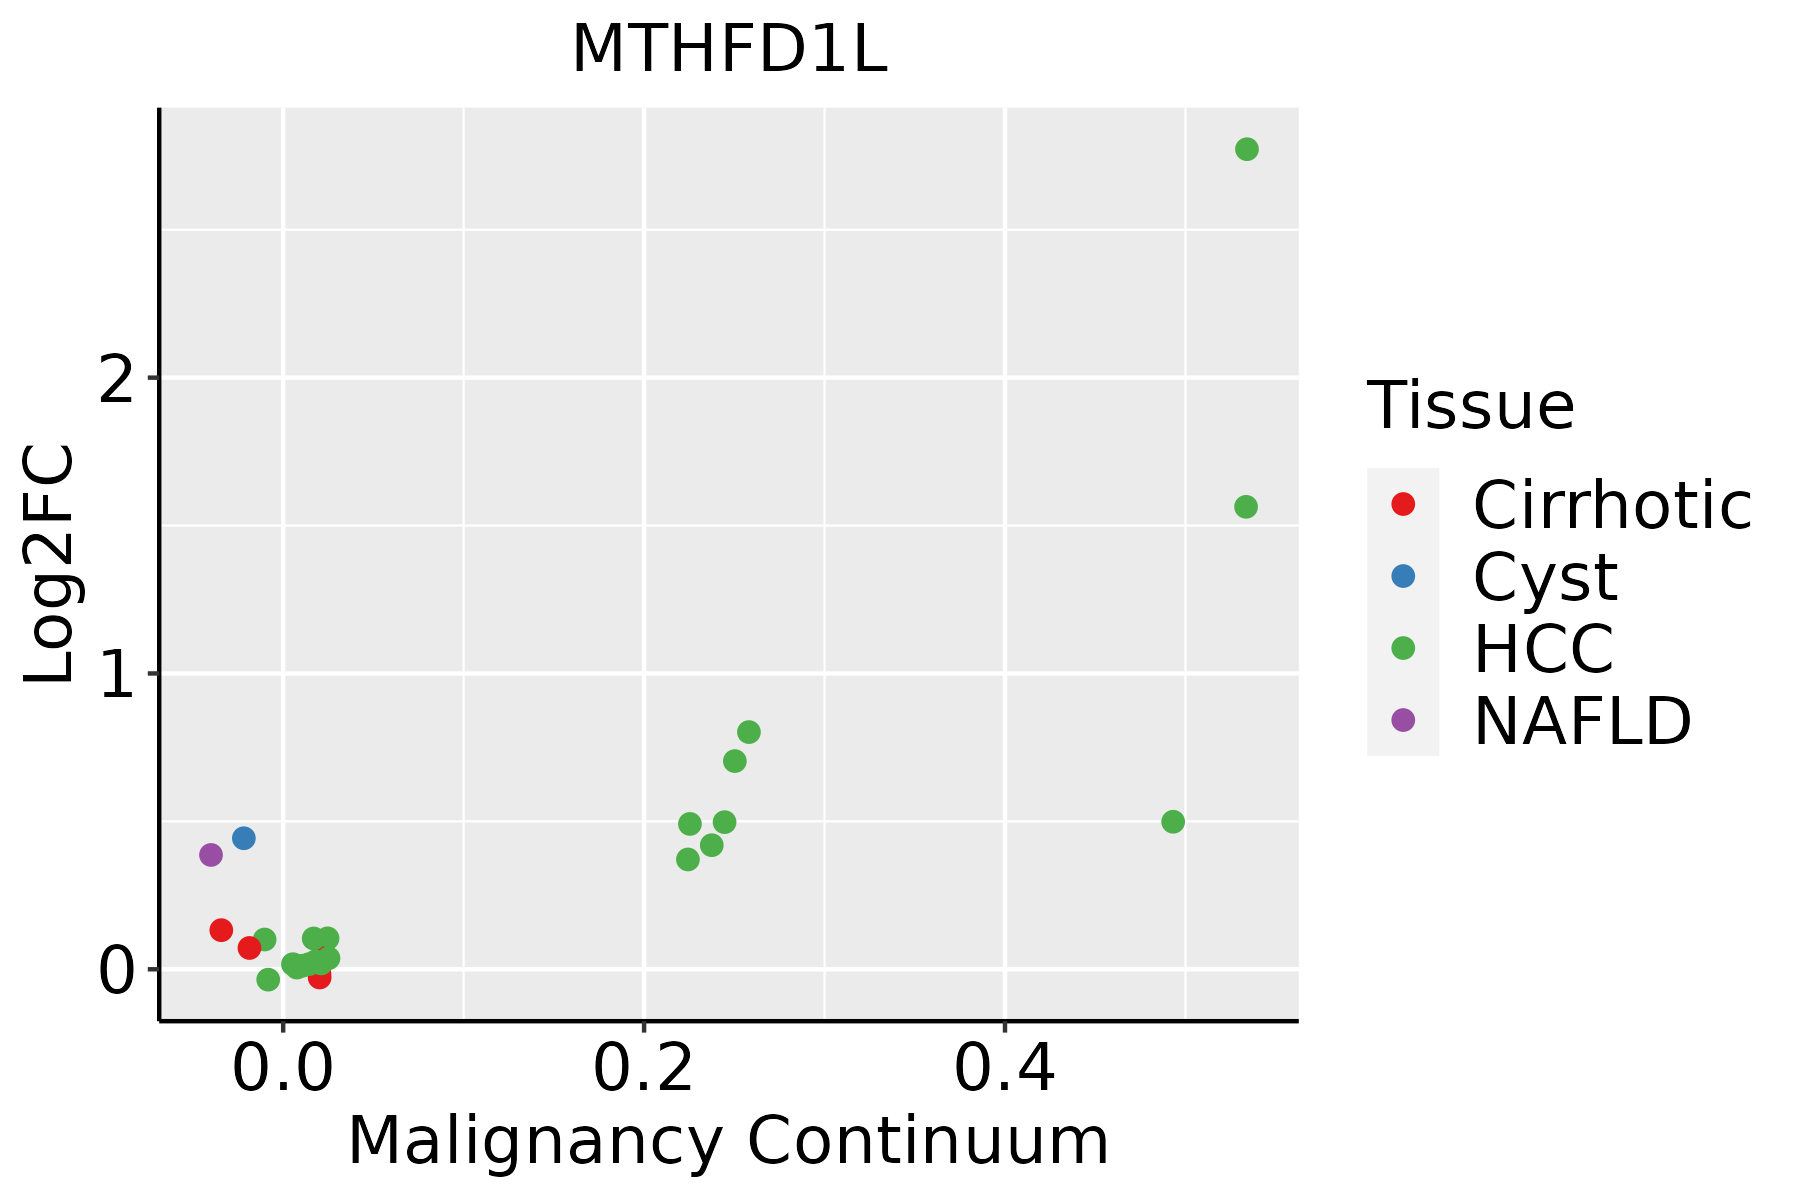 | HCC: Hepatocellular carcinoma |
| NAFLD: Non-alcoholic fatty liver disease |
| Lung |  | AAH: Atypical adenomatous hyperplasia |
| AIS: Adenocarcinoma in situ |
| IAC: Invasive lung adenocarcinoma |
| MIA: Minimally invasive adenocarcinoma |
| Oral Cavity |  | EOLP: Erosive Oral lichen planus |
| LP: leukoplakia |
| NEOLP: Non-erosive oral lichen planus |
| OSCC: Oral squamous cell carcinoma |
| Thyroid | 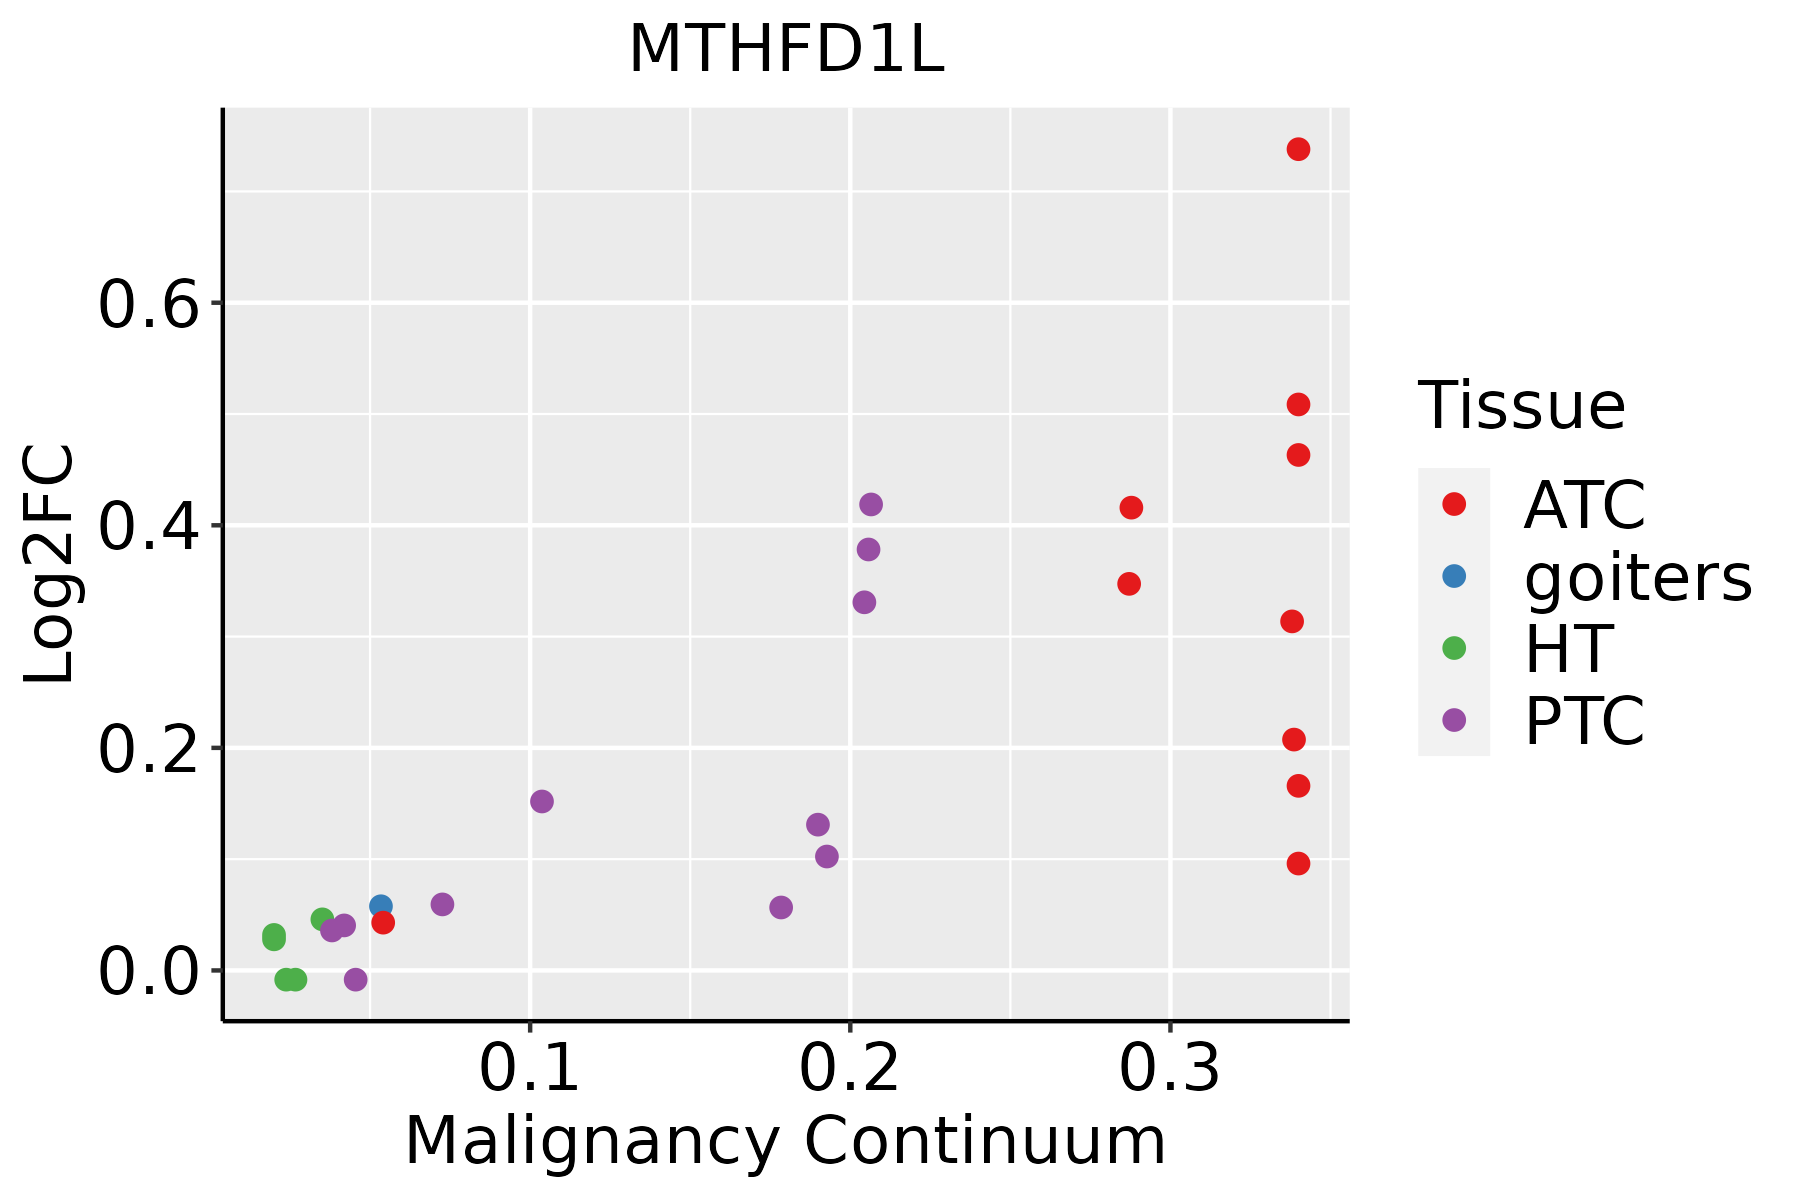 | ATC: Anaplastic thyroid cancer |
| HT: Hashimoto's thyroiditis |
| PTC: Papillary thyroid cancer |
| GO ID | Tissue | Disease Stage | Description | Gene Ratio | Bg Ratio | pvalue | p.adjust | Count |
| GO:00351487 | Cervix | CC | tube formation | 31/2311 | 148/18723 | 2.07e-03 | 1.51e-02 | 31 |
| GO:00018417 | Cervix | CC | neural tube formation | 23/2311 | 102/18723 | 2.80e-03 | 1.87e-02 | 23 |
| GO:00605626 | Cervix | CC | epithelial tube morphogenesis | 57/2311 | 325/18723 | 3.79e-03 | 2.41e-02 | 57 |
| GO:00140206 | Cervix | CC | primary neural tube formation | 21/2311 | 94/18723 | 4.68e-03 | 2.82e-02 | 21 |
| GO:00219156 | Cervix | CC | neural tube development | 30/2311 | 152/18723 | 6.00e-03 | 3.43e-02 | 30 |
| GO:00018435 | Cervix | CC | neural tube closure | 19/2311 | 88/18723 | 1.01e-02 | 4.91e-02 | 19 |
| GO:0006575 | Colorectum | AD | cellular modified amino acid metabolic process | 59/3918 | 188/18723 | 4.80e-04 | 5.27e-03 | 59 |
| GO:0006730 | Colorectum | AD | one-carbon metabolic process | 18/3918 | 40/18723 | 5.36e-04 | 5.74e-03 | 18 |
| GO:0060562 | Colorectum | AD | epithelial tube morphogenesis | 93/3918 | 325/18723 | 5.65e-04 | 6.00e-03 | 93 |
| GO:0043648 | Colorectum | AD | dicarboxylic acid metabolic process | 34/3918 | 96/18723 | 7.22e-04 | 7.28e-03 | 34 |
| GO:0014020 | Colorectum | AD | primary neural tube formation | 33/3918 | 94/18723 | 1.02e-03 | 9.50e-03 | 33 |
| GO:0001841 | Colorectum | AD | neural tube formation | 35/3918 | 102/18723 | 1.16e-03 | 1.05e-02 | 35 |
| GO:0001843 | Colorectum | AD | neural tube closure | 30/3918 | 88/18723 | 2.83e-03 | 2.12e-02 | 30 |
| GO:0060606 | Colorectum | AD | tube closure | 30/3918 | 89/18723 | 3.42e-03 | 2.49e-02 | 30 |
| GO:0042398 | Colorectum | AD | cellular modified amino acid biosynthetic process | 18/3918 | 46/18723 | 3.67e-03 | 2.60e-02 | 18 |
| GO:0035148 | Colorectum | AD | tube formation | 45/3918 | 148/18723 | 4.13e-03 | 2.87e-02 | 45 |
| GO:0001838 | Colorectum | AD | embryonic epithelial tube formation | 38/3918 | 121/18723 | 4.40e-03 | 3.01e-02 | 38 |
| GO:0048568 | Colorectum | AD | embryonic organ development | 112/3918 | 427/18723 | 4.60e-03 | 3.14e-02 | 112 |
| GO:0072175 | Colorectum | AD | epithelial tube formation | 40/3918 | 132/18723 | 6.98e-03 | 4.29e-02 | 40 |
| GO:0021915 | Colorectum | AD | neural tube development | 45/3918 | 152/18723 | 7.05e-03 | 4.31e-02 | 45 |
| Pathway ID | Tissue | Disease Stage | Description | Gene Ratio | Bg Ratio | pvalue | p.adjust | qvalue | Count |
| hsa00670 | Colorectum | MSI-H | One carbon pool by folate | 7/797 | 20/8465 | 1.65e-03 | 1.73e-02 | 1.45e-02 | 7 |
| hsa006701 | Colorectum | MSI-H | One carbon pool by folate | 7/797 | 20/8465 | 1.65e-03 | 1.73e-02 | 1.45e-02 | 7 |
| hsa012405 | Esophagus | ESCC | Biosynthesis of cofactors | 97/4205 | 153/8465 | 3.88e-04 | 1.35e-03 | 6.94e-04 | 97 |
| hsa0124012 | Esophagus | ESCC | Biosynthesis of cofactors | 97/4205 | 153/8465 | 3.88e-04 | 1.35e-03 | 6.94e-04 | 97 |
| hsa012402 | Liver | HCC | Biosynthesis of cofactors | 103/4020 | 153/8465 | 4.67e-07 | 5.05e-06 | 2.81e-06 | 103 |
| hsa006702 | Liver | HCC | One carbon pool by folate | 17/4020 | 20/8465 | 6.04e-04 | 2.50e-03 | 1.39e-03 | 17 |
| hsa012403 | Liver | HCC | Biosynthesis of cofactors | 103/4020 | 153/8465 | 4.67e-07 | 5.05e-06 | 2.81e-06 | 103 |
| hsa0067011 | Liver | HCC | One carbon pool by folate | 17/4020 | 20/8465 | 6.04e-04 | 2.50e-03 | 1.39e-03 | 17 |
| hsa012404 | Oral cavity | OSCC | Biosynthesis of cofactors | 88/3704 | 153/8465 | 3.84e-04 | 1.20e-03 | 6.12e-04 | 88 |
| hsa0124011 | Oral cavity | OSCC | Biosynthesis of cofactors | 88/3704 | 153/8465 | 3.84e-04 | 1.20e-03 | 6.12e-04 | 88 |
| Hugo Symbol | Variant Class | Variant Classification | dbSNP RS | HGVSc | HGVSp | HGVSp Short | SWISSPROT | BIOTYPE | SIFT | PolyPhen | Tumor Sample Barcode | Tissue | Histology | Sex | Age | Stage | Therapy Types | Drugs | Outcome |
| MTHFD1L | SNV | Missense_Mutation | | c.1213G>C | p.Glu405Gln | p.E405Q | | protein_coding | tolerated(0.1) | possibly_damaging(0.502) | TCGA-AR-A0TX-01 | Breast | breast invasive carcinoma | Female | <65 | I/II | Unknown | Unknown | SD |
| MTHFD1L | SNV | Missense_Mutation | | c.1087N>A | p.Asp363Asn | p.D363N | | protein_coding | deleterious(0) | probably_damaging(0.999) | TCGA-BH-A0E1-01 | Breast | breast invasive carcinoma | Female | <65 | I/II | Chemotherapy | cytoxan | SD |
| MTHFD1L | SNV | Missense_Mutation | | c.658N>T | p.Asp220Tyr | p.D220Y | | protein_coding | deleterious(0.02) | benign(0.255) | TCGA-C8-A1HK-01 | Breast | breast invasive carcinoma | Female | <65 | I/II | Unknown | Unknown | SD |
| MTHFD1L | SNV | Missense_Mutation | | c.631C>G | p.Leu211Val | p.L211V | | protein_coding | deleterious(0.04) | benign(0.028) | TCGA-D8-A1JA-01 | Breast | breast invasive carcinoma | Female | <65 | III/IV | Chemotherapy | adriamycin | PD |
| MTHFD1L | SNV | Missense_Mutation | rs759525027 | c.1847N>G | p.Val616Gly | p.V616G | | protein_coding | deleterious(0) | probably_damaging(0.977) | TCGA-D8-A1JT-01 | Breast | breast invasive carcinoma | Female | >=65 | I/II | Hormone Therapy | arimidex | SD |
| MTHFD1L | SNV | Missense_Mutation | | c.2278N>A | p.Gly760Ser | p.G760S | | protein_coding | deleterious(0) | probably_damaging(1) | TCGA-E2-A14Z-01 | Breast | breast invasive carcinoma | Female | <65 | I/II | Hormone Therapy | arimidex | PD |
| MTHFD1L | SNV | Missense_Mutation | | c.1073C>G | p.Ser358Cys | p.S358C | | protein_coding | deleterious(0.05) | benign(0.009) | TCGA-E9-A226-01 | Breast | breast invasive carcinoma | Female | <65 | III/IV | Hormone Therapy | tamoxiphen | PD |
| MTHFD1L | insertion | Nonsense_Mutation | novel | c.2689_2690insTCTAGATGTCAAAGAAGAGGATGCTCACATGTGC | p.Thr897IlefsTer2 | p.T897Ifs*2 | | protein_coding | | | TCGA-BH-A0E7-01 | Breast | breast invasive carcinoma | Female | >=65 | I/II | Hormone Therapy | arimidex | SD |
| MTHFD1L | deletion | Frame_Shift_Del | | c.1124_1145delNNNNNNNNNNNNNNNNNNNNNN | p.Val377CysfsTer21 | p.V377Cfs*21 | | protein_coding | | | TCGA-E2-A1LS-01 | Breast | breast invasive carcinoma | Female | <65 | I/II | Unspecific | Cyclophosphamide | SD |
| MTHFD1L | SNV | Missense_Mutation | novel | c.2425G>A | p.Ala809Thr | p.A809T | | protein_coding | deleterious(0.02) | probably_damaging(0.995) | TCGA-2W-A8YY-01 | Cervix | cervical & endocervical cancer | Female | <65 | I/II | Chemotherapy | cisplatin | CR |


