
|
|||||
|
 | |
| |
| |
| |
| |
| |
|
Gene: MTG2 |
Gene summary for MTG2 |
| Gene information | Species | Human | Gene symbol | MTG2 | Gene ID | 26164 |
| Gene name | mitochondrial ribosome associated GTPase 2 | |
| Gene Alias | GTPBP5 | |
| Cytomap | 20q13.33 | |
| Gene Type | protein-coding | GO ID | GO:0003008 | UniProtAcc | Q9H4K7 |
Top |
Malignant transformation analysis |
| Identification of the aberrant gene expression in precancerous and cancerous lesions by comparing the gene expression of stem-like cells in diseased tissues with normal stem cells |
| Entrez ID | Symbol | Replicates | Species | Organ | Tissue | Adj P-value | Log2FC | Malignancy |
| 26164 | MTG2 | LZE4T | Human | Esophagus | ESCC | 1.14e-04 | 1.89e-01 | 0.0811 |
| 26164 | MTG2 | LZE7T | Human | Esophagus | ESCC | 2.64e-02 | 2.14e-01 | 0.0667 |
| 26164 | MTG2 | LZE20T | Human | Esophagus | ESCC | 1.53e-03 | 3.18e-01 | 0.0662 |
| 26164 | MTG2 | LZE24T | Human | Esophagus | ESCC | 5.88e-03 | 1.87e-01 | 0.0596 |
| 26164 | MTG2 | P1T-E | Human | Esophagus | ESCC | 1.13e-04 | 3.29e-01 | 0.0875 |
| 26164 | MTG2 | P2T-E | Human | Esophagus | ESCC | 3.42e-08 | 2.53e-01 | 0.1177 |
| 26164 | MTG2 | P4T-E | Human | Esophagus | ESCC | 2.67e-05 | 1.89e-01 | 0.1323 |
| 26164 | MTG2 | P5T-E | Human | Esophagus | ESCC | 9.16e-14 | 3.01e-01 | 0.1327 |
| 26164 | MTG2 | P8T-E | Human | Esophagus | ESCC | 7.66e-08 | 1.31e-01 | 0.0889 |
| 26164 | MTG2 | P9T-E | Human | Esophagus | ESCC | 2.50e-10 | 1.56e-01 | 0.1131 |
| 26164 | MTG2 | P10T-E | Human | Esophagus | ESCC | 1.48e-16 | 4.02e-01 | 0.116 |
| 26164 | MTG2 | P11T-E | Human | Esophagus | ESCC | 1.97e-09 | 5.09e-01 | 0.1426 |
| 26164 | MTG2 | P12T-E | Human | Esophagus | ESCC | 1.28e-19 | 4.45e-01 | 0.1122 |
| 26164 | MTG2 | P15T-E | Human | Esophagus | ESCC | 4.28e-09 | 2.16e-01 | 0.1149 |
| 26164 | MTG2 | P16T-E | Human | Esophagus | ESCC | 1.25e-15 | 4.11e-01 | 0.1153 |
| 26164 | MTG2 | P17T-E | Human | Esophagus | ESCC | 3.28e-11 | 3.20e-01 | 0.1278 |
| 26164 | MTG2 | P20T-E | Human | Esophagus | ESCC | 4.73e-17 | 4.11e-01 | 0.1124 |
| 26164 | MTG2 | P21T-E | Human | Esophagus | ESCC | 1.57e-24 | 5.68e-01 | 0.1617 |
| 26164 | MTG2 | P22T-E | Human | Esophagus | ESCC | 3.81e-10 | 2.16e-01 | 0.1236 |
| 26164 | MTG2 | P23T-E | Human | Esophagus | ESCC | 1.03e-18 | 4.79e-01 | 0.108 |
| Page: 1 2 3 4 5 |
| Tissue | Expression Dynamics | Abbreviation |
| Esophagus | 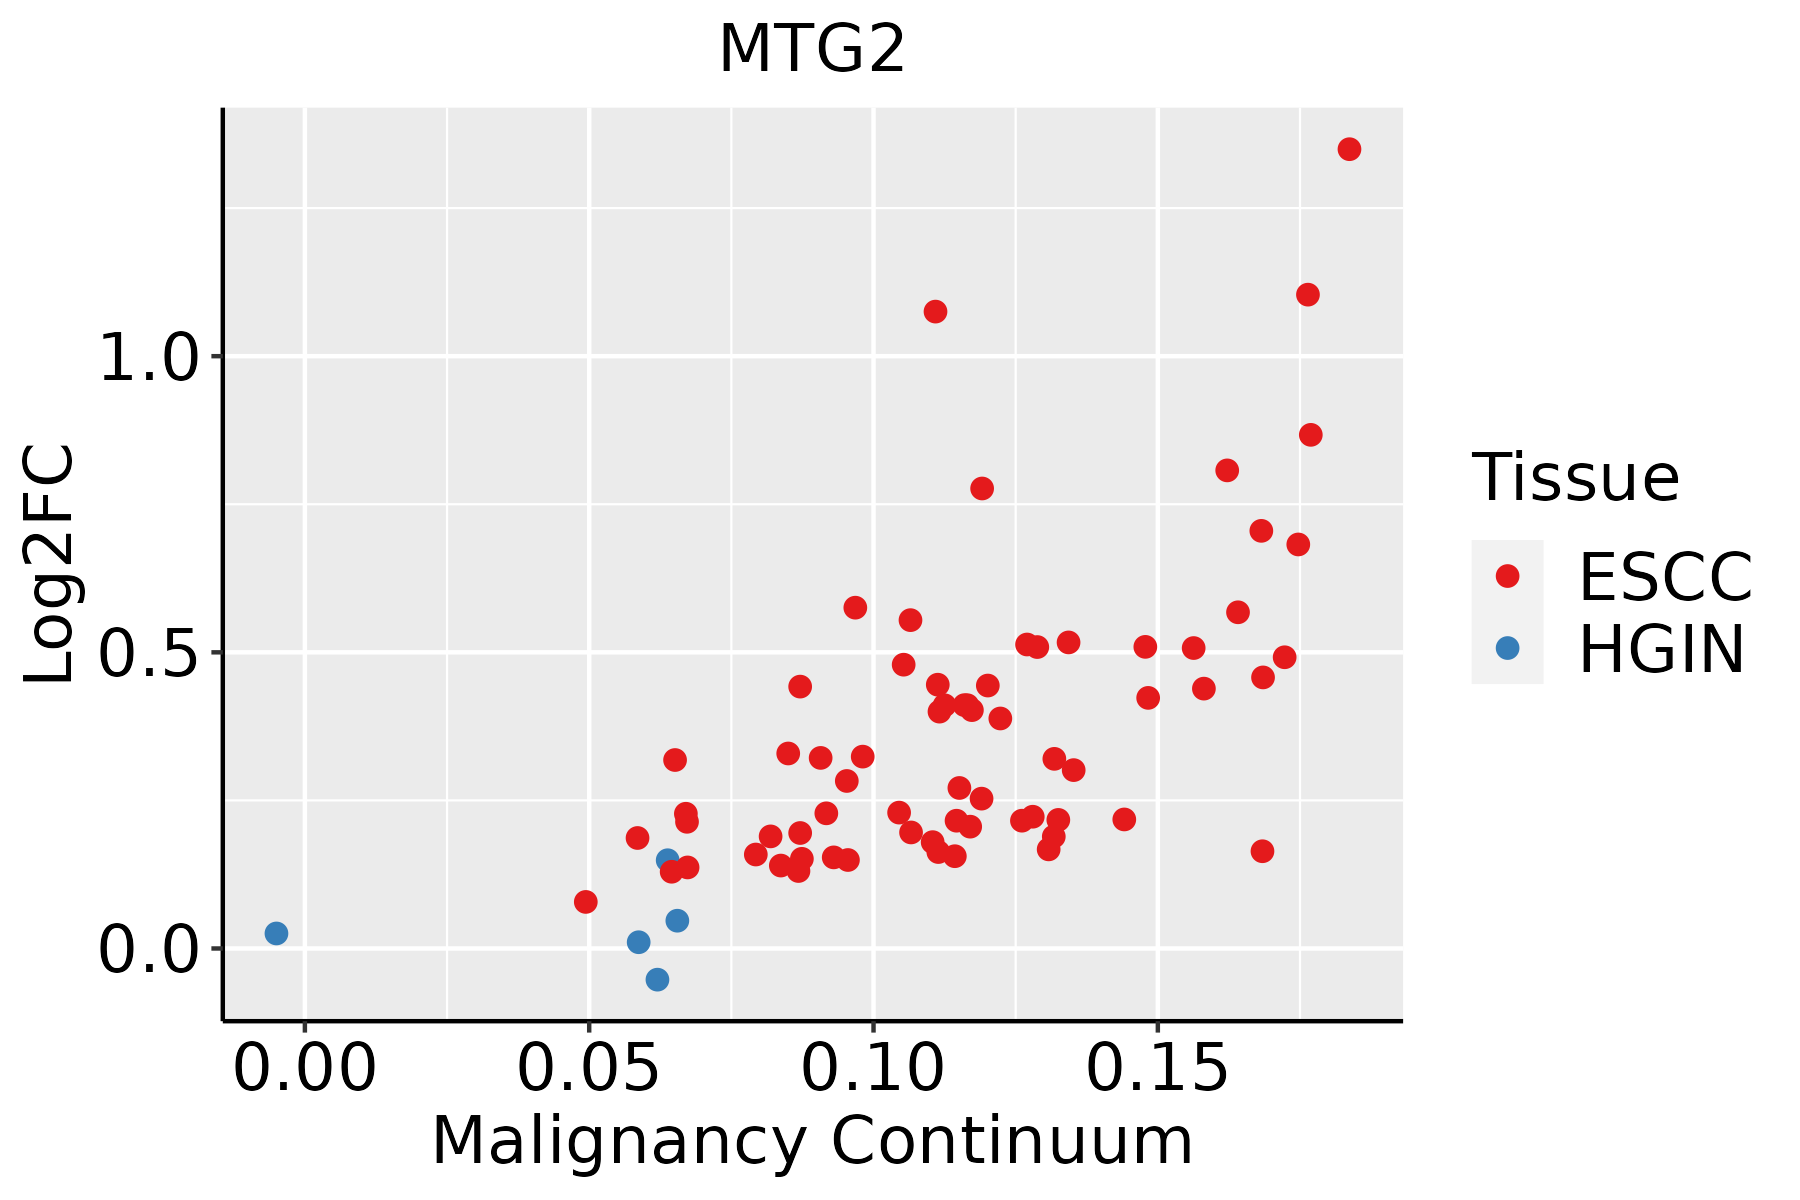 | ESCC: Esophageal squamous cell carcinoma |
| HGIN: High-grade intraepithelial neoplasias | ||
| LGIN: Low-grade intraepithelial neoplasias | ||
| Liver | 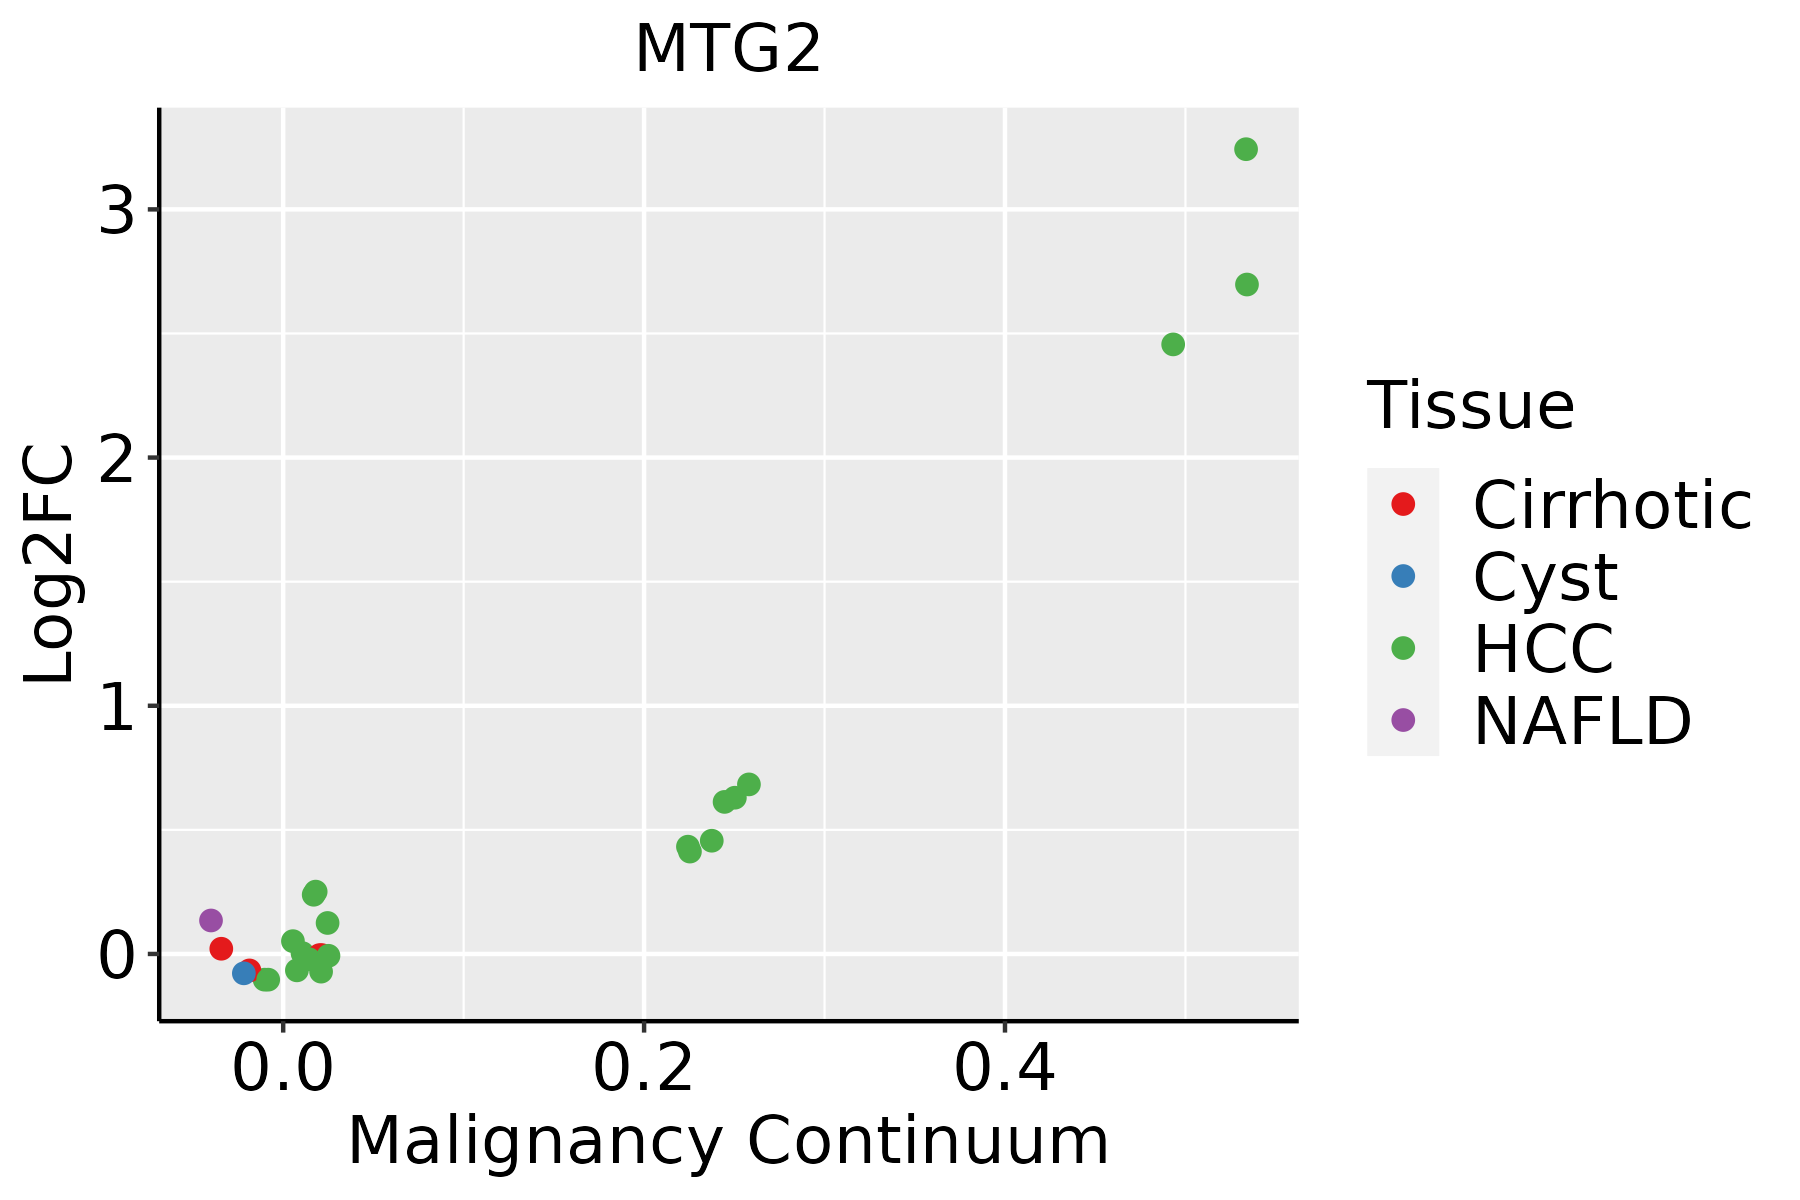 | HCC: Hepatocellular carcinoma |
| NAFLD: Non-alcoholic fatty liver disease | ||
| Oral Cavity | 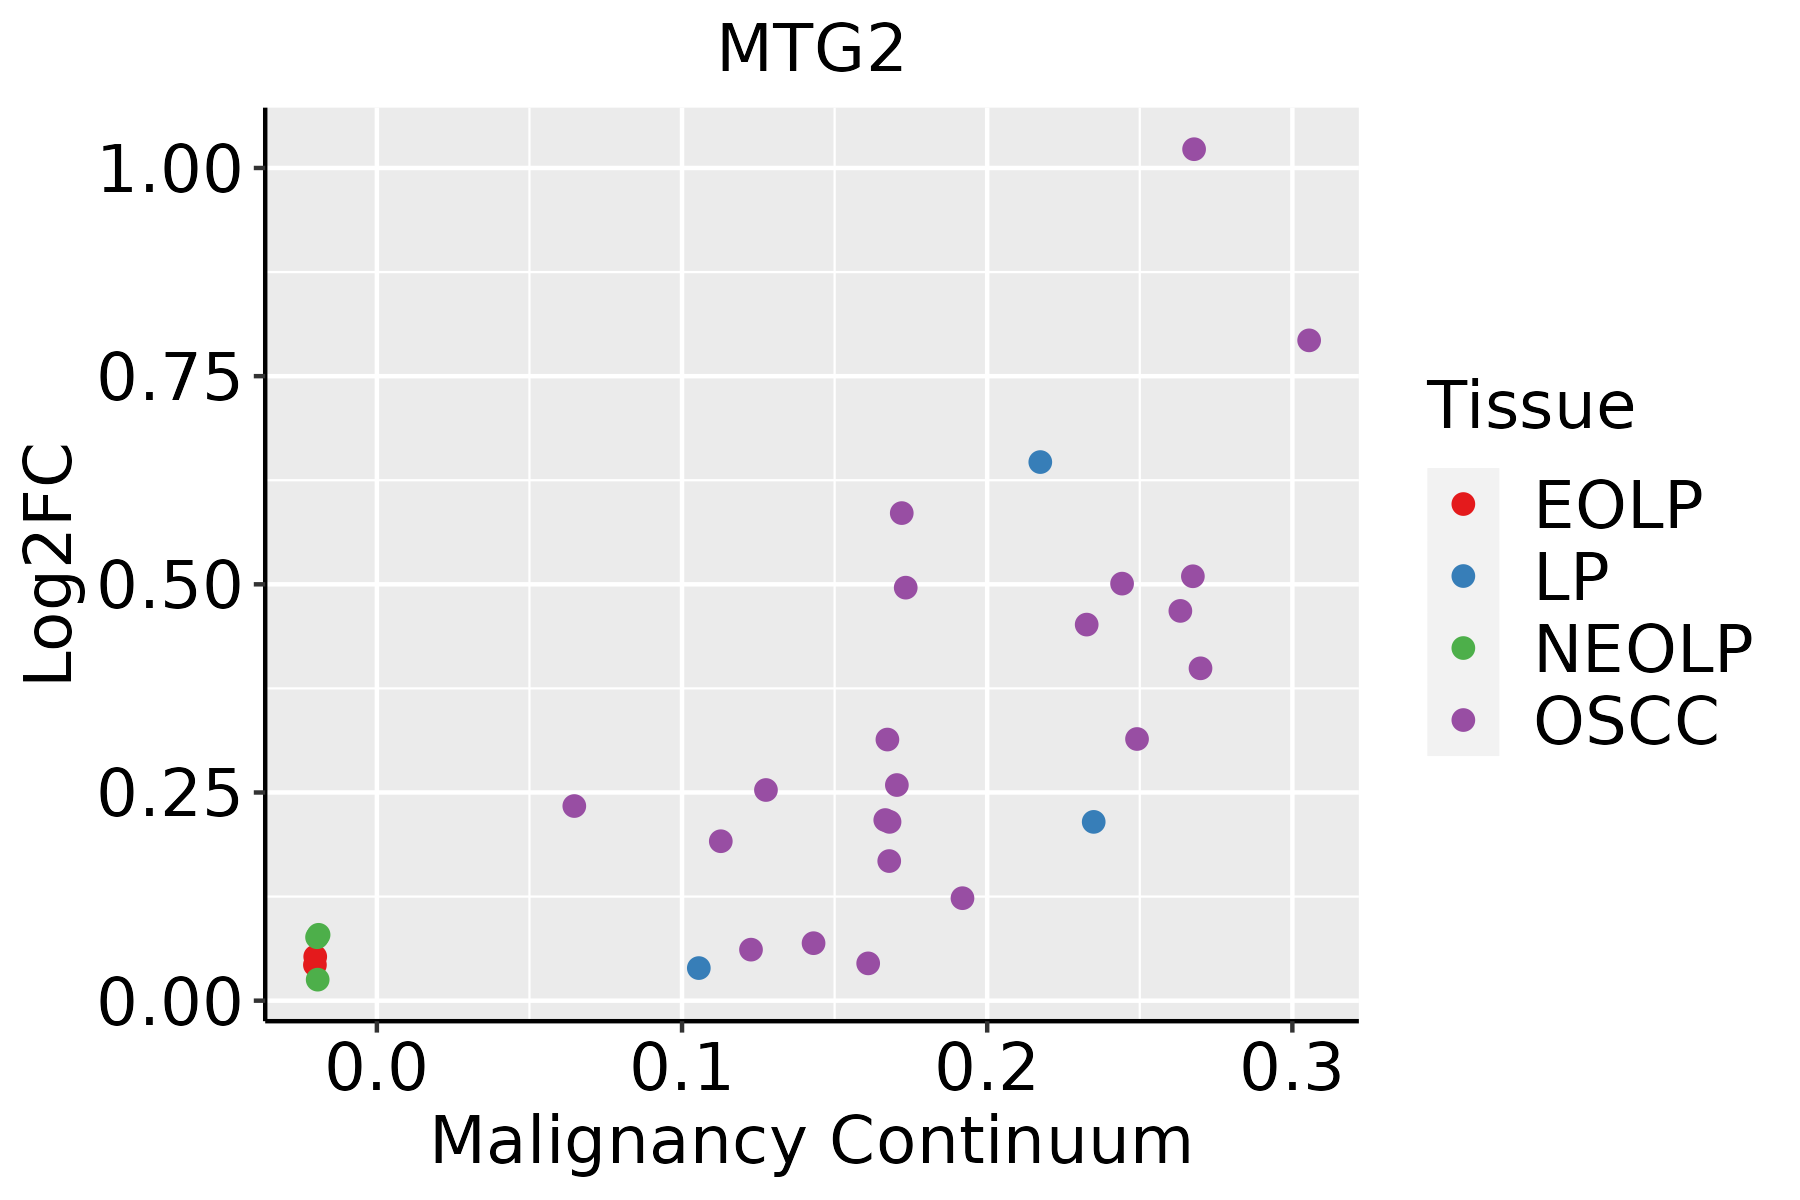 | EOLP: Erosive Oral lichen planus |
| LP: leukoplakia | ||
| NEOLP: Non-erosive oral lichen planus | ||
| OSCC: Oral squamous cell carcinoma |
| ∗log2FC in expression of this searched gene in stem-like cells from each diseased tissue sample relative to stem-like cells in normal samples in each tissue plotted against the malignancy continuum. Samples are colored based on if they are from different disease stage. |
Top |
Malignant transformation related pathway analysis |
| Find out the enriched GO biological processes and KEGG pathways involved in transition from healthy to precancer to cancer |
| Tissue | Disease Stage | Enriched GO biological Processes |
| Colorectum | AD |  |
| Colorectum | SER |  |
| Colorectum | MSS |  |
| Colorectum | MSI-H |  |
| Colorectum | FAP |  |
| ∗Top 15 enriched GO BP terms are showed in the bar plot of each disease state in each tissue. Each row represents a significant GO biological process which is colored according to the -log10(p.adjust). |
| Page: 1 2 3 4 5 6 7 8 9 |
| GO ID | Tissue | Disease Stage | Description | Gene Ratio | Bg Ratio | pvalue | p.adjust | Count |
| GO:0022613111 | Esophagus | ESCC | ribonucleoprotein complex biogenesis | 365/8552 | 463/18723 | 1.74e-49 | 1.11e-45 | 365 |
| GO:0042254111 | Esophagus | ESCC | ribosome biogenesis | 252/8552 | 299/18723 | 3.27e-44 | 1.04e-40 | 252 |
| GO:014005313 | Esophagus | ESCC | mitochondrial gene expression | 93/8552 | 108/18723 | 1.96e-18 | 2.03e-16 | 93 |
| GO:0006417111 | Esophagus | ESCC | regulation of translation | 304/8552 | 468/18723 | 1.53e-17 | 1.33e-15 | 304 |
| GO:003254314 | Esophagus | ESCC | mitochondrial translation | 68/8552 | 76/18723 | 1.02e-15 | 6.86e-14 | 68 |
| GO:00701292 | Esophagus | ESCC | regulation of mitochondrial translation | 22/8552 | 24/18723 | 2.82e-06 | 3.21e-05 | 22 |
| GO:00621252 | Esophagus | ESCC | regulation of mitochondrial gene expression | 24/8552 | 28/18723 | 1.37e-05 | 1.25e-04 | 24 |
| GO:002261322 | Liver | HCC | ribonucleoprotein complex biogenesis | 355/7958 | 463/18723 | 7.76e-52 | 4.92e-48 | 355 |
| GO:004225422 | Liver | HCC | ribosome biogenesis | 246/7958 | 299/18723 | 4.99e-46 | 1.58e-42 | 246 |
| GO:000641722 | Liver | HCC | regulation of translation | 287/7958 | 468/18723 | 8.79e-17 | 8.08e-15 | 287 |
| GO:01400531 | Liver | HCC | mitochondrial gene expression | 82/7958 | 108/18723 | 1.49e-12 | 7.20e-11 | 82 |
| GO:00325431 | Liver | HCC | mitochondrial translation | 62/7958 | 76/18723 | 2.95e-12 | 1.34e-10 | 62 |
| GO:0070129 | Liver | HCC | regulation of mitochondrial translation | 19/7958 | 24/18723 | 2.80e-04 | 2.02e-03 | 19 |
| GO:0062125 | Liver | HCC | regulation of mitochondrial gene expression | 21/7958 | 28/18723 | 4.94e-04 | 3.23e-03 | 21 |
| GO:002261320 | Oral cavity | OSCC | ribonucleoprotein complex biogenesis | 333/7305 | 463/18723 | 8.28e-48 | 5.24e-44 | 333 |
| GO:004225420 | Oral cavity | OSCC | ribosome biogenesis | 230/7305 | 299/18723 | 3.22e-41 | 6.80e-38 | 230 |
| GO:000641720 | Oral cavity | OSCC | regulation of translation | 274/7305 | 468/18723 | 4.39e-18 | 4.63e-16 | 274 |
| GO:01400533 | Oral cavity | OSCC | mitochondrial gene expression | 78/7305 | 108/18723 | 2.37e-12 | 9.86e-11 | 78 |
| GO:00325434 | Oral cavity | OSCC | mitochondrial translation | 59/7305 | 76/18723 | 7.21e-12 | 2.70e-10 | 59 |
| GO:00701291 | Oral cavity | OSCC | regulation of mitochondrial translation | 17/7305 | 24/18723 | 1.59e-03 | 7.56e-03 | 17 |
| Page: 1 2 |
| Pathway ID | Tissue | Disease Stage | Description | Gene Ratio | Bg Ratio | pvalue | p.adjust | qvalue | Count |
| Page: 1 |
Top |
Cell-cell communication analysis |
| Identification of potential cell-cell interactions between two cell types and their ligand-receptor pairs for different disease states |
| Ligand | Receptor | LRpair | Pathway | Tissue | Disease Stage |
| Page: 1 |
Top |
Single-cell gene regulatory network inference analysis |
| Find out the significant the regulons (TFs) and the target genes of each regulon across cell types for different disease states |
| TF | Cell Type | Tissue | Disease Stage | Target Gene | RSS | Regulon Activity |
| ∗The dot plots of a searched regulon are shown for all cell subpopulations in each disease state of each tissue based on the regulon specific score inferred using pySCENIC and by calculating the average expression. |
| Page: 1 |
Top |
Somatic mutation of malignant transformation related genes |
| Annotation of somatic variants for genes involved in malignant transformation |
| Hugo Symbol | Variant Class | Variant Classification | dbSNP RS | HGVSc | HGVSp | HGVSp Short | SWISSPROT | BIOTYPE | SIFT | PolyPhen | Tumor Sample Barcode | Tissue | Histology | Sex | Age | Stage | Therapy Types | Drugs | Outcome |
| MTG2 | SNV | Missense_Mutation | c.268N>C | p.Ser90Arg | p.S90R | Q9H4K7 | protein_coding | tolerated(0.35) | possibly_damaging(0.492) | TCGA-A2-A04R-01 | Breast | breast invasive carcinoma | Female | <65 | I/II | Chemotherapy | taxol | SD | |
| MTG2 | SNV | Missense_Mutation | c.340G>T | p.Val114Phe | p.V114F | Q9H4K7 | protein_coding | deleterious(0) | probably_damaging(0.992) | TCGA-D8-A141-01 | Breast | breast invasive carcinoma | Female | <65 | I/II | Chemotherapy | doxorubicine | SD | |
| MTG2 | SNV | Missense_Mutation | c.377C>G | p.Ser126Trp | p.S126W | Q9H4K7 | protein_coding | deleterious(0) | probably_damaging(0.941) | TCGA-E2-A1II-01 | Breast | breast invasive carcinoma | Female | <65 | I/II | Chemotherapy | doxorubicin | SD | |
| MTG2 | SNV | Missense_Mutation | rs760017639 | c.904N>T | p.Arg302Cys | p.R302C | Q9H4K7 | protein_coding | deleterious(0) | probably_damaging(1) | TCGA-CK-4951-01 | Colorectum | colon adenocarcinoma | Female | >=65 | I/II | Unknown | Unknown | PD |
| MTG2 | SNV | Missense_Mutation | c.442N>T | p.Arg148Cys | p.R148C | Q9H4K7 | protein_coding | deleterious(0) | probably_damaging(0.982) | TCGA-CM-4746-01 | Colorectum | colon adenocarcinoma | Male | <65 | I/II | Unknown | Unknown | SD | |
| MTG2 | SNV | Missense_Mutation | c.1055N>A | p.Ala352Asp | p.A352D | Q9H4K7 | protein_coding | deleterious(0) | benign(0.024) | TCGA-D5-6930-01 | Colorectum | colon adenocarcinoma | Male | >=65 | I/II | Unknown | Unknown | SD | |
| MTG2 | SNV | Missense_Mutation | rs768368919 | c.790N>A | p.Gly264Arg | p.G264R | Q9H4K7 | protein_coding | deleterious(0) | probably_damaging(1) | TCGA-G4-6628-01 | Colorectum | colon adenocarcinoma | Male | >=65 | I/II | Unknown | Unknown | SD |
| MTG2 | SNV | Missense_Mutation | c.941A>G | p.Gln314Arg | p.Q314R | Q9H4K7 | protein_coding | tolerated(0.32) | benign(0) | TCGA-A5-A0GH-01 | Endometrium | uterine corpus endometrioid carcinoma | Female | <65 | I/II | Unknown | Unknown | SD | |
| MTG2 | SNV | Missense_Mutation | rs142043457 | c.475N>A | p.Val159Met | p.V159M | Q9H4K7 | protein_coding | tolerated(0.15) | benign(0.305) | TCGA-A5-A2K3-01 | Endometrium | uterine corpus endometrioid carcinoma | Female | >=65 | I/II | Chemotherapy | carboplatin | SD |
| MTG2 | SNV | Missense_Mutation | novel | c.478N>T | p.Gly160Cys | p.G160C | Q9H4K7 | protein_coding | deleterious(0) | probably_damaging(1) | TCGA-AJ-A23O-01 | Endometrium | uterine corpus endometrioid carcinoma | Female | >=65 | I/II | Unknown | Unknown | SD |
| Page: 1 2 3 4 5 |
Top |
Related drugs of malignant transformation related genes |
| Identification of chemicals and drugs interact with genes involved in malignant transfromation |
| (DGIdb 4.0) |
| Entrez ID | Symbol | Category | Interaction Types | Drug Claim Name | Drug Name | PMIDs |
| Page: 1 |

Copyright 2023-Present -The University of Texas Health Science Center at Houston |