
|
|||||
|
 | |
| |
| |
| |
| |
| |
|
Gene: MTG1 |
Gene summary for MTG1 |
| Gene information | Species | Human | Gene symbol | MTG1 | Gene ID | 92170 |
| Gene name | mitochondrial ribosome associated GTPase 1 | |
| Gene Alias | GTP | |
| Cytomap | 10q26.3 | |
| Gene Type | protein-coding | GO ID | GO:0003008 | UniProtAcc | Q9BT17 |
Top |
Malignant transformation analysis |
| Identification of the aberrant gene expression in precancerous and cancerous lesions by comparing the gene expression of stem-like cells in diseased tissues with normal stem cells |
| Entrez ID | Symbol | Replicates | Species | Organ | Tissue | Adj P-value | Log2FC | Malignancy |
| 92170 | MTG1 | LZE2T | Human | Esophagus | ESCC | 9.54e-06 | 4.54e-01 | 0.082 |
| 92170 | MTG1 | LZE3D | Human | Esophagus | HGIN | 3.66e-03 | 5.74e-01 | 0.0668 |
| 92170 | MTG1 | LZE4T | Human | Esophagus | ESCC | 1.39e-13 | 3.60e-01 | 0.0811 |
| 92170 | MTG1 | LZE5T | Human | Esophagus | ESCC | 1.54e-04 | 4.29e-01 | 0.0514 |
| 92170 | MTG1 | LZE7T | Human | Esophagus | ESCC | 3.42e-17 | 6.08e-01 | 0.0667 |
| 92170 | MTG1 | LZE8T | Human | Esophagus | ESCC | 1.06e-18 | 5.57e-01 | 0.067 |
| 92170 | MTG1 | LZE20T | Human | Esophagus | ESCC | 1.90e-16 | 3.88e-01 | 0.0662 |
| 92170 | MTG1 | LZE21D1 | Human | Esophagus | HGIN | 3.53e-05 | 3.83e-01 | 0.0632 |
| 92170 | MTG1 | LZE22D1 | Human | Esophagus | HGIN | 1.32e-09 | 3.32e-01 | 0.0595 |
| 92170 | MTG1 | LZE22T | Human | Esophagus | ESCC | 5.52e-13 | 5.51e-01 | 0.068 |
| 92170 | MTG1 | LZE24D1 | Human | Esophagus | HGIN | 3.66e-03 | 9.89e-01 | 0.054 |
| 92170 | MTG1 | LZE24T | Human | Esophagus | ESCC | 5.87e-40 | 9.41e-01 | 0.0596 |
| 92170 | MTG1 | LZE22D3 | Human | Esophagus | HGIN | 1.73e-02 | 3.51e-01 | 0.0653 |
| 92170 | MTG1 | LZE21T | Human | Esophagus | ESCC | 2.27e-11 | 6.28e-01 | 0.0655 |
| 92170 | MTG1 | LZE6T | Human | Esophagus | ESCC | 7.09e-15 | 5.55e-01 | 0.0845 |
| 92170 | MTG1 | P1T-E | Human | Esophagus | ESCC | 1.83e-27 | 8.15e-01 | 0.0875 |
| 92170 | MTG1 | P2T-E | Human | Esophagus | ESCC | 1.67e-63 | 9.70e-01 | 0.1177 |
| 92170 | MTG1 | P4T-E | Human | Esophagus | ESCC | 2.51e-57 | 1.00e+00 | 0.1323 |
| 92170 | MTG1 | P5T-E | Human | Esophagus | ESCC | 1.85e-55 | 8.83e-01 | 0.1327 |
| 92170 | MTG1 | P8T-E | Human | Esophagus | ESCC | 5.95e-29 | 4.19e-01 | 0.0889 |
| Page: 1 2 3 4 5 |
| Tissue | Expression Dynamics | Abbreviation |
| Esophagus |  | ESCC: Esophageal squamous cell carcinoma |
| HGIN: High-grade intraepithelial neoplasias | ||
| LGIN: Low-grade intraepithelial neoplasias | ||
| Liver | 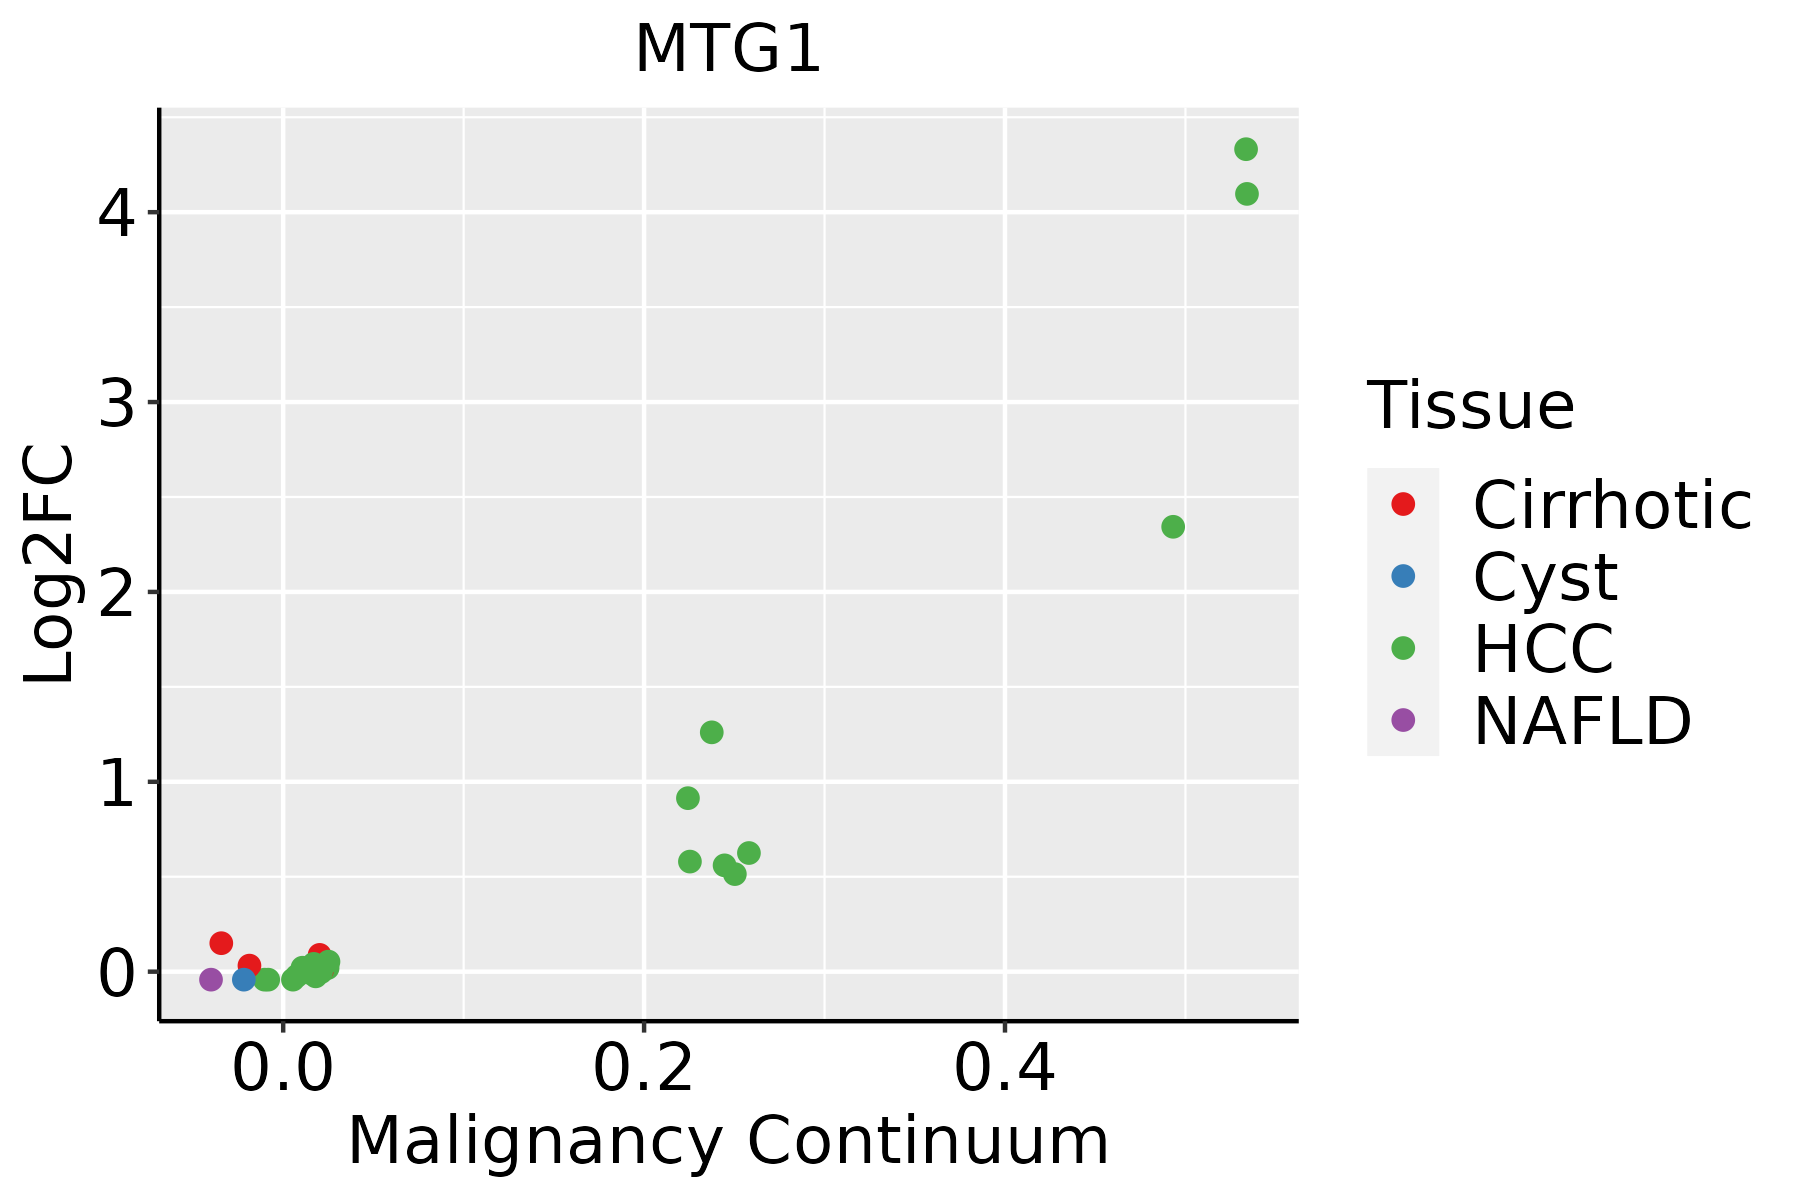 | HCC: Hepatocellular carcinoma |
| NAFLD: Non-alcoholic fatty liver disease | ||
| Lung | 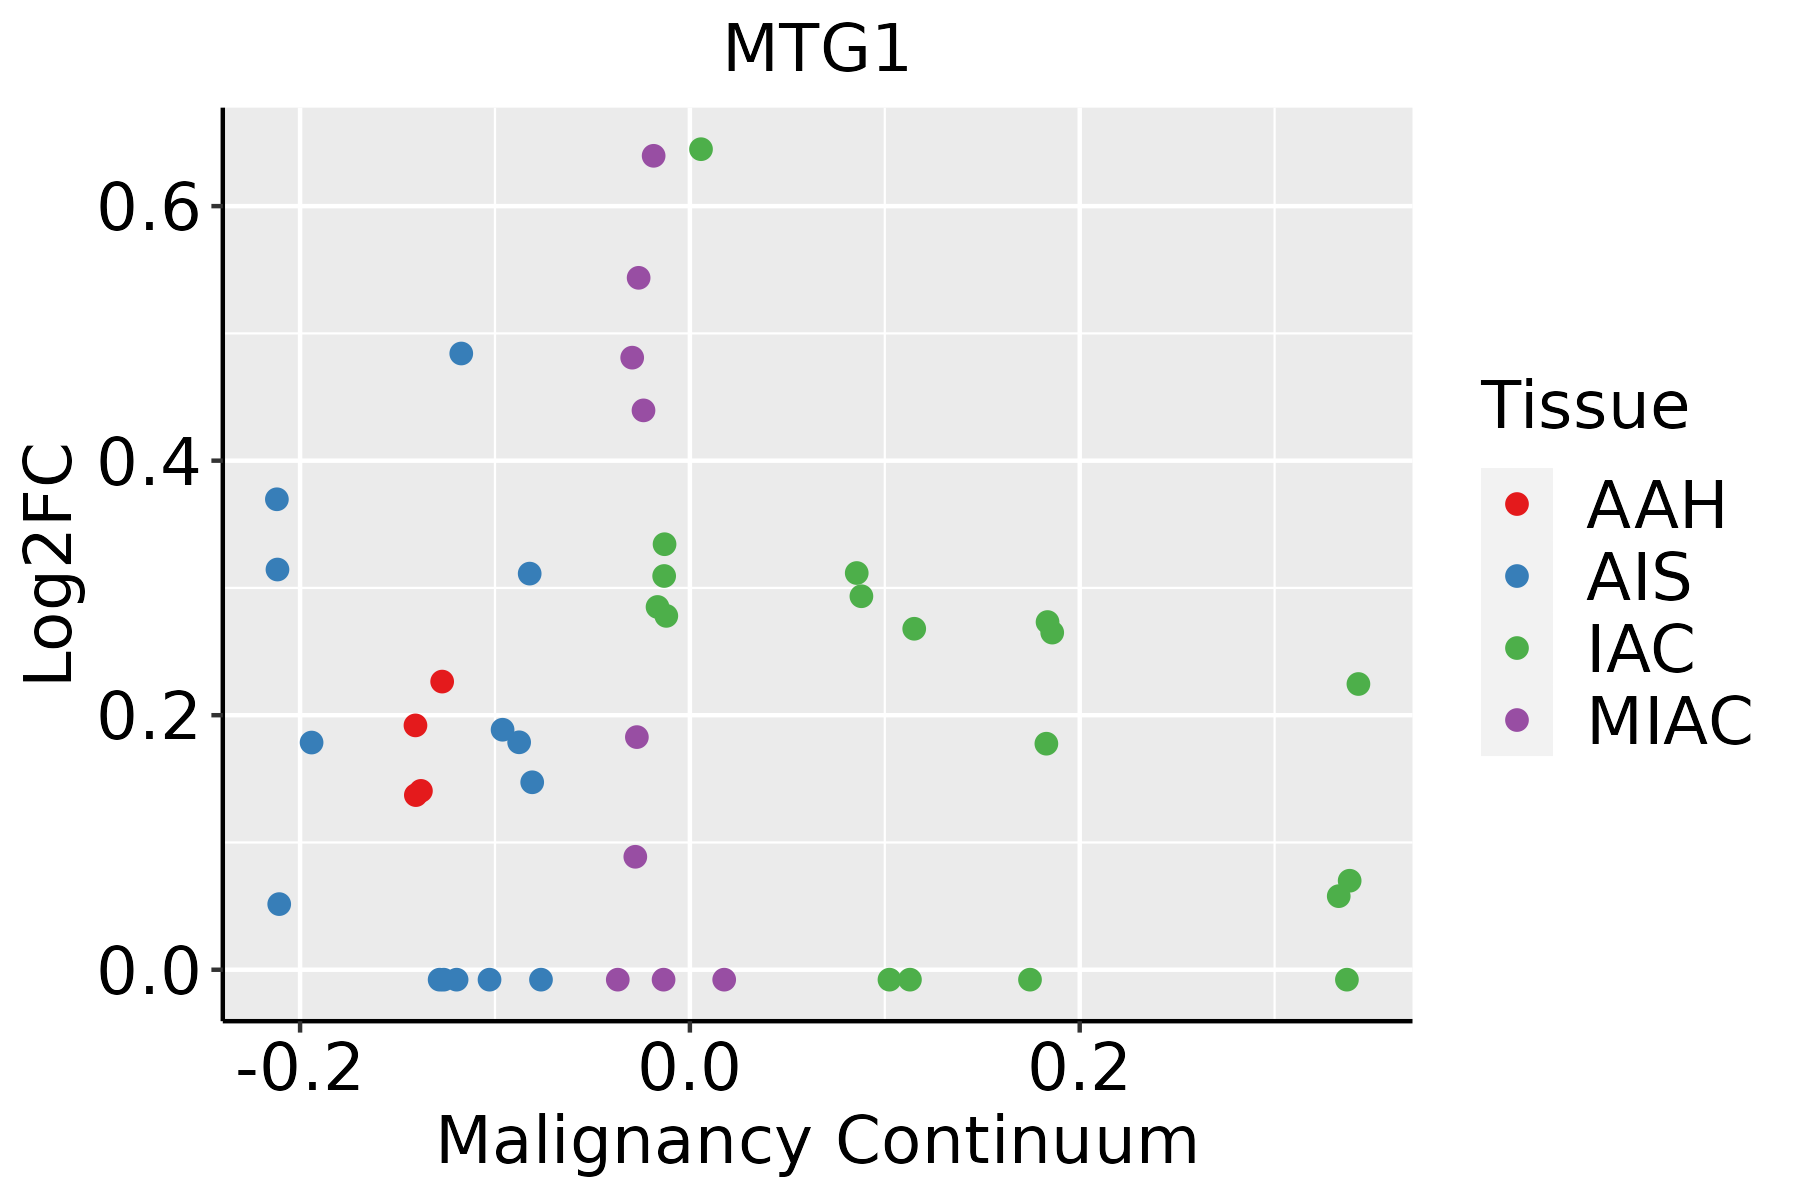 | AAH: Atypical adenomatous hyperplasia |
| AIS: Adenocarcinoma in situ | ||
| IAC: Invasive lung adenocarcinoma | ||
| MIA: Minimally invasive adenocarcinoma |
| ∗log2FC in expression of this searched gene in stem-like cells from each diseased tissue sample relative to stem-like cells in normal samples in each tissue plotted against the malignancy continuum. Samples are colored based on if they are from different disease stage. |
Top |
Malignant transformation related pathway analysis |
| Find out the enriched GO biological processes and KEGG pathways involved in transition from healthy to precancer to cancer |
| Tissue | Disease Stage | Enriched GO biological Processes |
| Colorectum | AD |  |
| Colorectum | SER |  |
| Colorectum | MSS |  |
| Colorectum | MSI-H |  |
| Colorectum | FAP |  |
| ∗Top 15 enriched GO BP terms are showed in the bar plot of each disease state in each tissue. Each row represents a significant GO biological process which is colored according to the -log10(p.adjust). |
| Page: 1 2 3 4 5 6 7 8 9 |
| GO ID | Tissue | Disease Stage | Description | Gene Ratio | Bg Ratio | pvalue | p.adjust | Count |
| GO:000641727 | Esophagus | HGIN | regulation of translation | 139/2587 | 468/18723 | 1.46e-19 | 7.98e-17 | 139 |
| GO:00325435 | Esophagus | HGIN | mitochondrial translation | 23/2587 | 76/18723 | 1.61e-04 | 3.16e-03 | 23 |
| GO:01400534 | Esophagus | HGIN | mitochondrial gene expression | 27/2587 | 108/18723 | 1.34e-03 | 1.57e-02 | 27 |
| GO:014005313 | Esophagus | ESCC | mitochondrial gene expression | 93/8552 | 108/18723 | 1.96e-18 | 2.03e-16 | 93 |
| GO:0006417111 | Esophagus | ESCC | regulation of translation | 304/8552 | 468/18723 | 1.53e-17 | 1.33e-15 | 304 |
| GO:003254314 | Esophagus | ESCC | mitochondrial translation | 68/8552 | 76/18723 | 1.02e-15 | 6.86e-14 | 68 |
| GO:00701292 | Esophagus | ESCC | regulation of mitochondrial translation | 22/8552 | 24/18723 | 2.82e-06 | 3.21e-05 | 22 |
| GO:00621252 | Esophagus | ESCC | regulation of mitochondrial gene expression | 24/8552 | 28/18723 | 1.37e-05 | 1.25e-04 | 24 |
| GO:000641722 | Liver | HCC | regulation of translation | 287/7958 | 468/18723 | 8.79e-17 | 8.08e-15 | 287 |
| GO:01400531 | Liver | HCC | mitochondrial gene expression | 82/7958 | 108/18723 | 1.49e-12 | 7.20e-11 | 82 |
| GO:00325431 | Liver | HCC | mitochondrial translation | 62/7958 | 76/18723 | 2.95e-12 | 1.34e-10 | 62 |
| GO:0070129 | Liver | HCC | regulation of mitochondrial translation | 19/7958 | 24/18723 | 2.80e-04 | 2.02e-03 | 19 |
| GO:0062125 | Liver | HCC | regulation of mitochondrial gene expression | 21/7958 | 28/18723 | 4.94e-04 | 3.23e-03 | 21 |
| GO:00064178 | Lung | IAC | regulation of translation | 86/2061 | 468/18723 | 1.16e-06 | 6.18e-05 | 86 |
| GO:0007585 | Lung | IAC | respiratory gaseous exchange by respiratory system | 18/2061 | 68/18723 | 2.99e-04 | 4.82e-03 | 18 |
| GO:000641713 | Lung | AIS | regulation of translation | 78/1849 | 468/18723 | 2.68e-06 | 1.49e-04 | 78 |
| GO:00075851 | Lung | AIS | respiratory gaseous exchange by respiratory system | 15/1849 | 68/18723 | 2.24e-03 | 2.38e-02 | 15 |
| GO:000641733 | Lung | MIAC | regulation of translation | 51/967 | 468/18723 | 3.94e-07 | 6.52e-05 | 51 |
| GO:00075853 | Lung | MIAC | respiratory gaseous exchange by respiratory system | 11/967 | 68/18723 | 6.76e-04 | 1.59e-02 | 11 |
| Page: 1 |
| Pathway ID | Tissue | Disease Stage | Description | Gene Ratio | Bg Ratio | pvalue | p.adjust | qvalue | Count |
| Page: 1 |
Top |
Cell-cell communication analysis |
| Identification of potential cell-cell interactions between two cell types and their ligand-receptor pairs for different disease states |
| Ligand | Receptor | LRpair | Pathway | Tissue | Disease Stage |
| Page: 1 |
Top |
Single-cell gene regulatory network inference analysis |
| Find out the significant the regulons (TFs) and the target genes of each regulon across cell types for different disease states |
| TF | Cell Type | Tissue | Disease Stage | Target Gene | RSS | Regulon Activity |
| ∗The dot plots of a searched regulon are shown for all cell subpopulations in each disease state of each tissue based on the regulon specific score inferred using pySCENIC and by calculating the average expression. |
| Page: 1 |
Top |
Somatic mutation of malignant transformation related genes |
| Annotation of somatic variants for genes involved in malignant transformation |
| Hugo Symbol | Variant Class | Variant Classification | dbSNP RS | HGVSc | HGVSp | HGVSp Short | SWISSPROT | BIOTYPE | SIFT | PolyPhen | Tumor Sample Barcode | Tissue | Histology | Sex | Age | Stage | Therapy Types | Drugs | Outcome |
| MTG1 | SNV | Missense_Mutation | rs752228294 | c.857C>T | p.Thr286Met | p.T286M | Q9BT17 | protein_coding | deleterious(0.01) | probably_damaging(0.985) | TCGA-BH-A5J0-01 | Breast | breast invasive carcinoma | Female | <65 | I/II | Unknown | Unknown | SD |
| MTG1 | SNV | Missense_Mutation | c.1001N>A | p.Pro334His | p.P334H | Q9BT17 | protein_coding | deleterious_low_confidence(0) | benign(0.258) | TCGA-D8-A1Y1-01 | Breast | breast invasive carcinoma | Female | >=65 | III/IV | Hormone Therapy | tamoxiphen | PD | |
| MTG1 | insertion | In_Frame_Ins | novel | c.509_510insGAT | p.Lys170_Gly171insIle | p.K170_G171insI | Q9BT17 | protein_coding | TCGA-A8-A06O-01 | Breast | breast invasive carcinoma | Female | <65 | I/II | Hormone Therapy | letrozole | SD | ||
| MTG1 | insertion | Frame_Shift_Ins | novel | c.511_511+1insCAGTAGCAAAATTAGTGAAA | p.Gly171AlafsTer23 | p.G171Afs*23 | Q9BT17 | protein_coding | TCGA-A8-A06O-01 | Breast | breast invasive carcinoma | Female | <65 | I/II | Hormone Therapy | letrozole | SD | ||
| MTG1 | deletion | Frame_Shift_Del | c.986delC | p.Pro329ArgfsTer28 | p.P329Rfs*28 | Q9BT17 | protein_coding | TCGA-EA-A410-01 | Cervix | cervical & endocervical cancer | Female | <65 | I/II | Unknown | Unknown | SD | |||
| MTG1 | SNV | Missense_Mutation | rs540025351 | c.404N>A | p.Arg135His | p.R135H | Q9BT17 | protein_coding | deleterious(0.01) | benign(0.384) | TCGA-AA-A00N-01 | Colorectum | colon adenocarcinoma | Male | >=65 | I/II | Unknown | Unknown | PD |
| MTG1 | SNV | Missense_Mutation | c.561N>A | p.Met187Ile | p.M187I | Q9BT17 | protein_coding | deleterious(0.02) | benign(0.158) | TCGA-AA-A022-01 | Colorectum | colon adenocarcinoma | Female | >=65 | I/II | Unknown | Unknown | SD | |
| MTG1 | SNV | Missense_Mutation | rs148997160 | c.193N>T | p.Arg65Cys | p.R65C | Q9BT17 | protein_coding | deleterious(0.01) | probably_damaging(0.988) | TCGA-AM-5821-01 | Colorectum | colon adenocarcinoma | Female | >=65 | I/II | Unknown | Unknown | SD |
| MTG1 | SNV | Missense_Mutation | rs372230583 | c.931C>T | p.Arg311Cys | p.R311C | Q9BT17 | protein_coding | deleterious(0.02) | possibly_damaging(0.489) | TCGA-AU-6004-01 | Colorectum | colon adenocarcinoma | Female | >=65 | I/II | Unknown | Unknown | SD |
| MTG1 | SNV | Missense_Mutation | novel | c.748T>G | p.Phe250Val | p.F250V | Q9BT17 | protein_coding | deleterious(0) | possibly_damaging(0.809) | TCGA-D5-6930-01 | Colorectum | colon adenocarcinoma | Male | >=65 | I/II | Unknown | Unknown | SD |
| Page: 1 2 3 4 5 6 |
Top |
Related drugs of malignant transformation related genes |
| Identification of chemicals and drugs interact with genes involved in malignant transfromation |
| (DGIdb 4.0) |
| Entrez ID | Symbol | Category | Interaction Types | Drug Claim Name | Drug Name | PMIDs |
| Page: 1 |

Copyright 2023-Present -The University of Texas Health Science Center at Houston |