
|
|||||
|
 | |
| |
| |
| |
| |
| |
|
Gene: MTFR1L |
Gene summary for MTFR1L |
| Gene information | Species | Human | Gene symbol | MTFR1L | Gene ID | 56181 |
| Gene name | mitochondrial fission regulator 1 like | |
| Gene Alias | FAM54B | |
| Cytomap | 1p36.11 | |
| Gene Type | protein-coding | GO ID | GO:0000266 | UniProtAcc | A0A0S2Z5H6 |
Top |
Malignant transformation analysis |
| Identification of the aberrant gene expression in precancerous and cancerous lesions by comparing the gene expression of stem-like cells in diseased tissues with normal stem cells |
| Entrez ID | Symbol | Replicates | Species | Organ | Tissue | Adj P-value | Log2FC | Malignancy |
| 56181 | MTFR1L | LZE7T | Human | Esophagus | ESCC | 1.27e-03 | 2.65e-01 | 0.0667 |
| 56181 | MTFR1L | LZE8T | Human | Esophagus | ESCC | 4.87e-04 | 2.07e-01 | 0.067 |
| 56181 | MTFR1L | LZE24T | Human | Esophagus | ESCC | 1.40e-09 | 2.73e-01 | 0.0596 |
| 56181 | MTFR1L | P1T-E | Human | Esophagus | ESCC | 2.28e-04 | 2.62e-01 | 0.0875 |
| 56181 | MTFR1L | P2T-E | Human | Esophagus | ESCC | 3.34e-26 | 4.30e-01 | 0.1177 |
| 56181 | MTFR1L | P4T-E | Human | Esophagus | ESCC | 8.75e-09 | 2.04e-01 | 0.1323 |
| 56181 | MTFR1L | P5T-E | Human | Esophagus | ESCC | 1.68e-03 | 8.37e-02 | 0.1327 |
| 56181 | MTFR1L | P8T-E | Human | Esophagus | ESCC | 2.91e-15 | 2.04e-01 | 0.0889 |
| 56181 | MTFR1L | P9T-E | Human | Esophagus | ESCC | 3.61e-08 | 2.51e-01 | 0.1131 |
| 56181 | MTFR1L | P10T-E | Human | Esophagus | ESCC | 4.65e-36 | 5.42e-01 | 0.116 |
| 56181 | MTFR1L | P11T-E | Human | Esophagus | ESCC | 1.76e-06 | 4.57e-01 | 0.1426 |
| 56181 | MTFR1L | P12T-E | Human | Esophagus | ESCC | 2.35e-23 | 3.22e-01 | 0.1122 |
| 56181 | MTFR1L | P15T-E | Human | Esophagus | ESCC | 1.28e-17 | 2.97e-01 | 0.1149 |
| 56181 | MTFR1L | P16T-E | Human | Esophagus | ESCC | 1.67e-21 | 2.61e-01 | 0.1153 |
| 56181 | MTFR1L | P17T-E | Human | Esophagus | ESCC | 4.12e-04 | 3.04e-01 | 0.1278 |
| 56181 | MTFR1L | P20T-E | Human | Esophagus | ESCC | 2.00e-12 | 2.89e-01 | 0.1124 |
| 56181 | MTFR1L | P21T-E | Human | Esophagus | ESCC | 3.39e-20 | 3.60e-01 | 0.1617 |
| 56181 | MTFR1L | P22T-E | Human | Esophagus | ESCC | 1.52e-11 | 1.37e-01 | 0.1236 |
| 56181 | MTFR1L | P23T-E | Human | Esophagus | ESCC | 5.35e-16 | 3.00e-01 | 0.108 |
| 56181 | MTFR1L | P24T-E | Human | Esophagus | ESCC | 1.68e-11 | 1.29e-01 | 0.1287 |
| Page: 1 2 3 4 5 |
| Tissue | Expression Dynamics | Abbreviation |
| Esophagus | 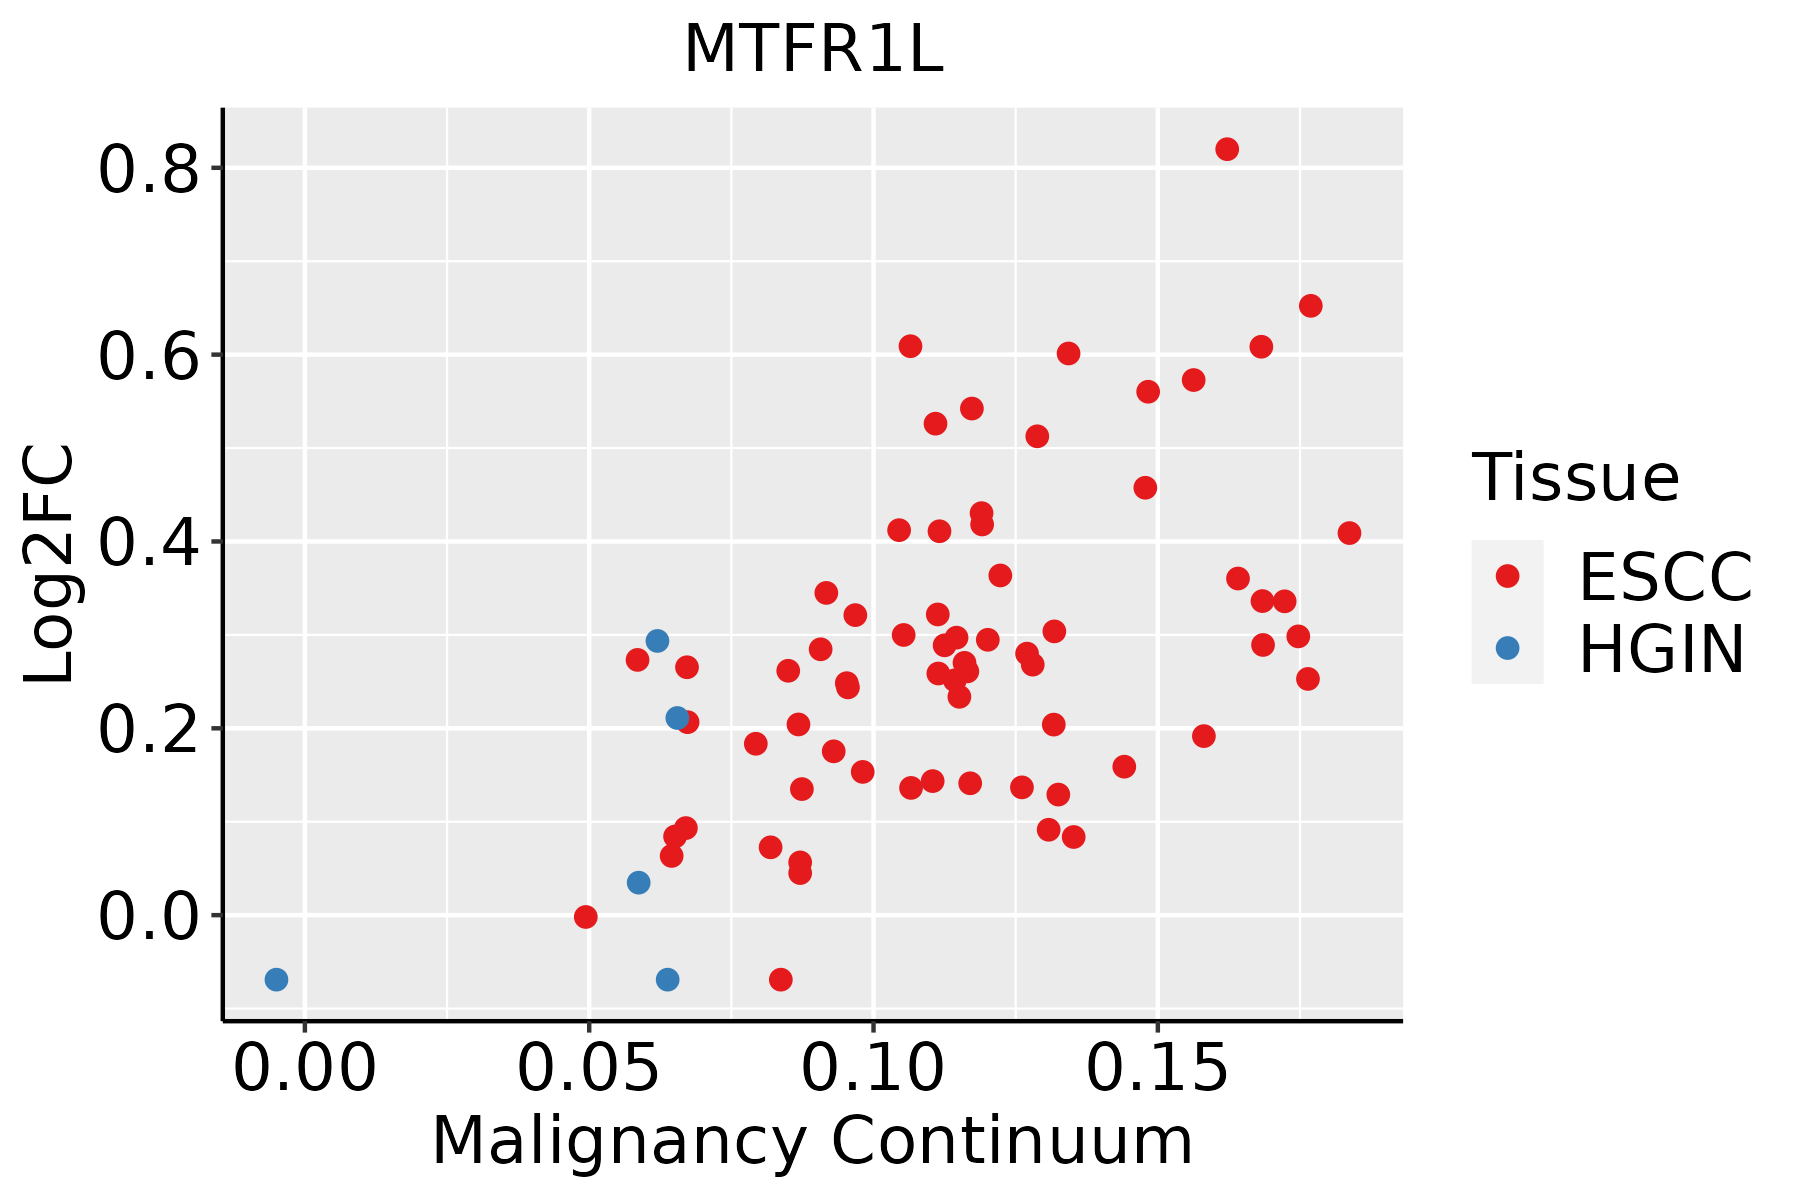 | ESCC: Esophageal squamous cell carcinoma |
| HGIN: High-grade intraepithelial neoplasias | ||
| LGIN: Low-grade intraepithelial neoplasias | ||
| Liver | 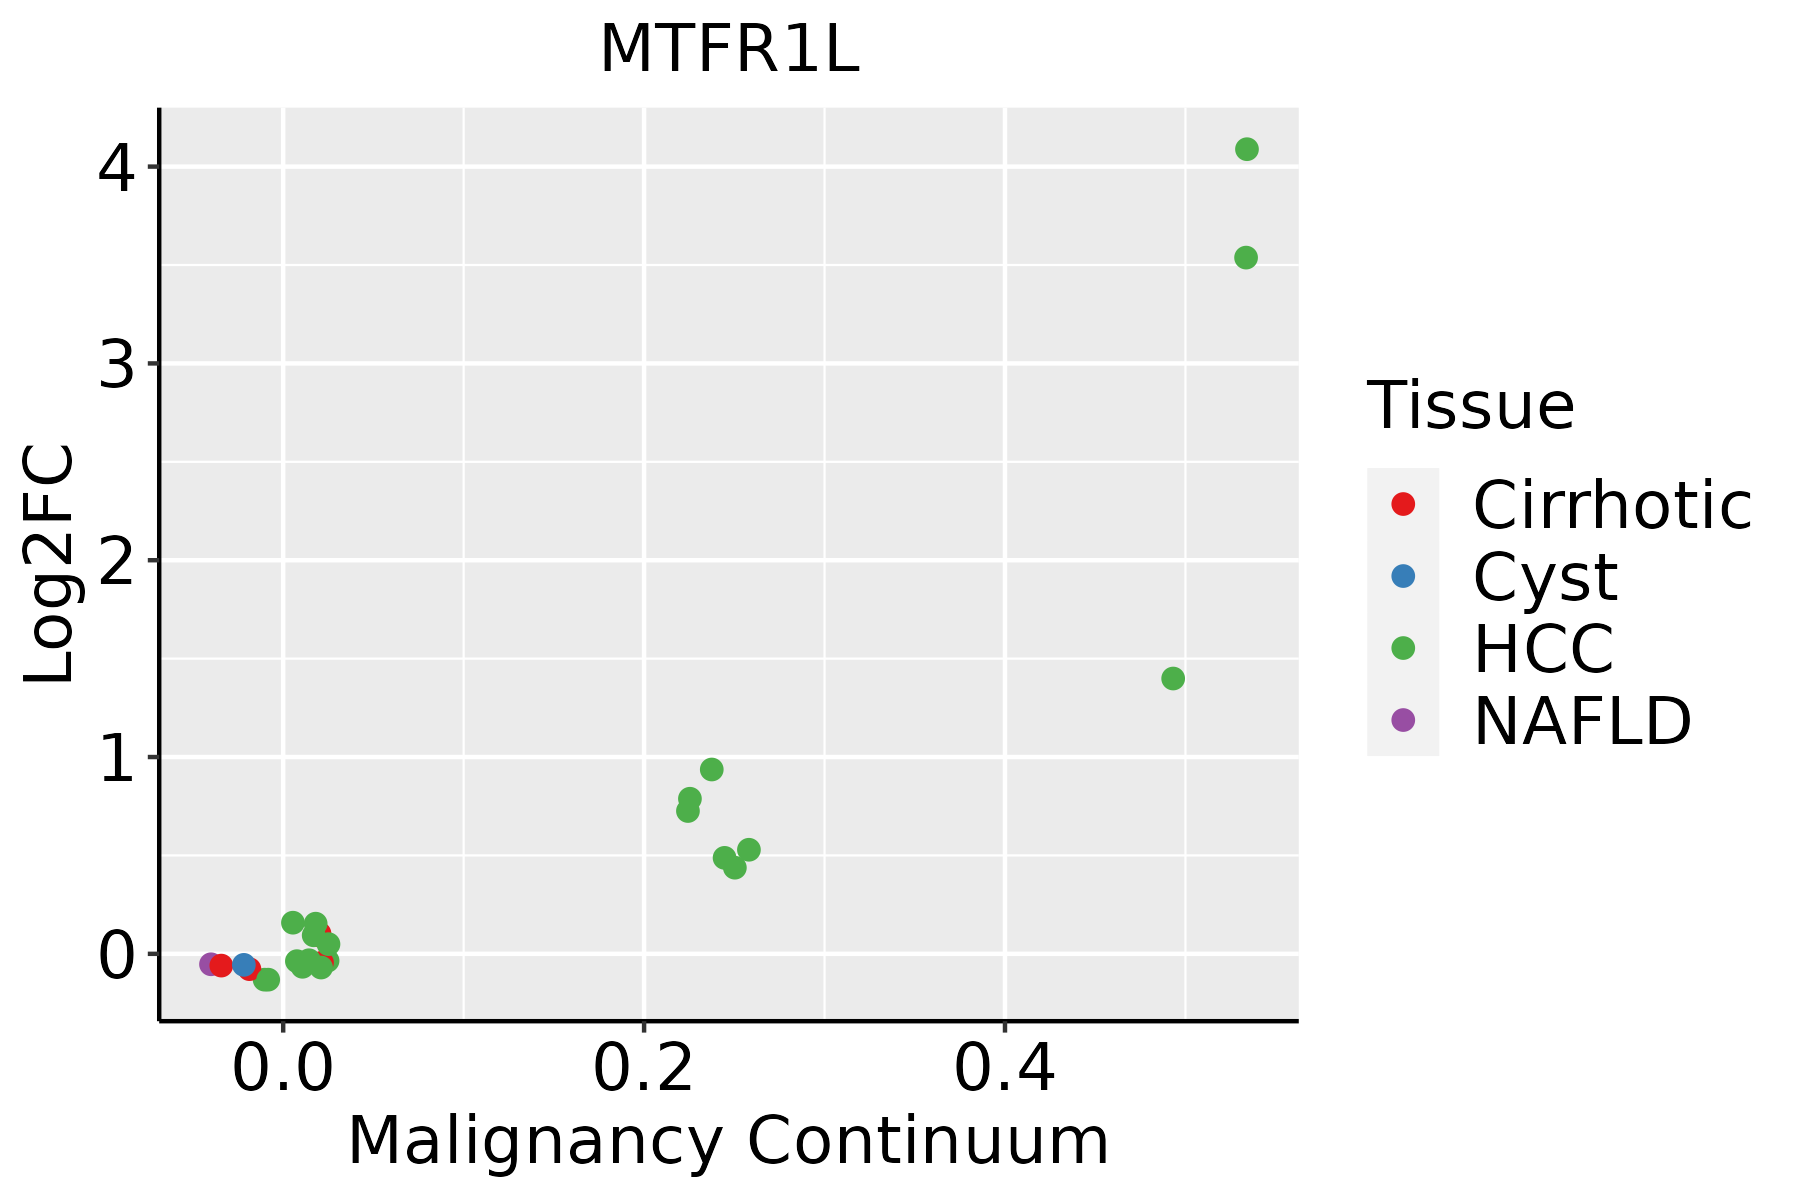 | HCC: Hepatocellular carcinoma |
| NAFLD: Non-alcoholic fatty liver disease | ||
| Oral Cavity |  | EOLP: Erosive Oral lichen planus |
| LP: leukoplakia | ||
| NEOLP: Non-erosive oral lichen planus | ||
| OSCC: Oral squamous cell carcinoma |
| ∗log2FC in expression of this searched gene in stem-like cells from each diseased tissue sample relative to stem-like cells in normal samples in each tissue plotted against the malignancy continuum. Samples are colored based on if they are from different disease stage. |
Top |
Malignant transformation related pathway analysis |
| Find out the enriched GO biological processes and KEGG pathways involved in transition from healthy to precancer to cancer |
| Tissue | Disease Stage | Enriched GO biological Processes |
| Colorectum | AD |  |
| Colorectum | SER |  |
| Colorectum | MSS |  |
| Colorectum | MSI-H |  |
| Colorectum | FAP |  |
| ∗Top 15 enriched GO BP terms are showed in the bar plot of each disease state in each tissue. Each row represents a significant GO biological process which is colored according to the -log10(p.adjust). |
| Page: 1 2 3 4 5 6 7 8 9 |
| GO ID | Tissue | Disease Stage | Description | Gene Ratio | Bg Ratio | pvalue | p.adjust | Count |
| GO:0006091110 | Esophagus | ESCC | generation of precursor metabolites and energy | 331/8552 | 490/18723 | 3.86e-23 | 8.45e-21 | 331 |
| GO:0045333110 | Esophagus | ESCC | cellular respiration | 173/8552 | 230/18723 | 4.53e-20 | 5.99e-18 | 173 |
| GO:0009060110 | Esophagus | ESCC | aerobic respiration | 145/8552 | 189/18723 | 2.16e-18 | 2.21e-16 | 145 |
| GO:0015980110 | Esophagus | ESCC | energy derivation by oxidation of organic compounds | 220/8552 | 318/18723 | 1.20e-17 | 1.09e-15 | 220 |
| GO:00482853 | Esophagus | ESCC | organelle fission | 301/8552 | 488/18723 | 4.64e-13 | 2.12e-11 | 301 |
| GO:00002662 | Esophagus | ESCC | mitochondrial fission | 28/8552 | 42/18723 | 4.90e-03 | 1.89e-02 | 28 |
| GO:000609122 | Liver | HCC | generation of precursor metabolites and energy | 340/7958 | 490/18723 | 4.04e-34 | 2.85e-31 | 340 |
| GO:000906012 | Liver | HCC | aerobic respiration | 147/7958 | 189/18723 | 3.13e-23 | 6.61e-21 | 147 |
| GO:004533312 | Liver | HCC | cellular respiration | 171/7958 | 230/18723 | 6.35e-23 | 1.26e-20 | 171 |
| GO:001598022 | Liver | HCC | energy derivation by oxidation of organic compounds | 221/7958 | 318/18723 | 1.02e-22 | 1.86e-20 | 221 |
| GO:0048285 | Liver | HCC | organelle fission | 254/7958 | 488/18723 | 1.07e-05 | 1.23e-04 | 254 |
| GO:0000266 | Liver | HCC | mitochondrial fission | 28/7958 | 42/18723 | 1.35e-03 | 7.26e-03 | 28 |
| GO:000609118 | Oral cavity | OSCC | generation of precursor metabolites and energy | 286/7305 | 490/18723 | 1.45e-18 | 1.71e-16 | 286 |
| GO:000906018 | Oral cavity | OSCC | aerobic respiration | 133/7305 | 189/18723 | 1.79e-18 | 2.02e-16 | 133 |
| GO:004533318 | Oral cavity | OSCC | cellular respiration | 153/7305 | 230/18723 | 2.07e-17 | 1.87e-15 | 153 |
| GO:001598018 | Oral cavity | OSCC | energy derivation by oxidation of organic compounds | 190/7305 | 318/18723 | 4.10e-14 | 2.26e-12 | 190 |
| GO:00482852 | Oral cavity | OSCC | organelle fission | 265/7305 | 488/18723 | 3.22e-12 | 1.27e-10 | 265 |
| GO:00002661 | Oral cavity | OSCC | mitochondrial fission | 24/7305 | 42/18723 | 1.30e-02 | 4.34e-02 | 24 |
| Page: 1 |
| Pathway ID | Tissue | Disease Stage | Description | Gene Ratio | Bg Ratio | pvalue | p.adjust | qvalue | Count |
| Page: 1 |
Top |
Cell-cell communication analysis |
| Identification of potential cell-cell interactions between two cell types and their ligand-receptor pairs for different disease states |
| Ligand | Receptor | LRpair | Pathway | Tissue | Disease Stage |
| Page: 1 |
Top |
Single-cell gene regulatory network inference analysis |
| Find out the significant the regulons (TFs) and the target genes of each regulon across cell types for different disease states |
| TF | Cell Type | Tissue | Disease Stage | Target Gene | RSS | Regulon Activity |
| ∗The dot plots of a searched regulon are shown for all cell subpopulations in each disease state of each tissue based on the regulon specific score inferred using pySCENIC and by calculating the average expression. |
| Page: 1 |
Top |
Somatic mutation of malignant transformation related genes |
| Annotation of somatic variants for genes involved in malignant transformation |
| Hugo Symbol | Variant Class | Variant Classification | dbSNP RS | HGVSc | HGVSp | HGVSp Short | SWISSPROT | BIOTYPE | SIFT | PolyPhen | Tumor Sample Barcode | Tissue | Histology | Sex | Age | Stage | Therapy Types | Drugs | Outcome |
| MTFR1L | insertion | Nonsense_Mutation | novel | c.677_678insGCTAGCCAGTAGTGCCTCTTAGATGGTTTCT | p.Glu227LeufsTer7 | p.E227Lfs*7 | Q9H019 | protein_coding | TCGA-A2-A0EO-01 | Breast | breast invasive carcinoma | Female | <65 | I/II | Hormone Therapy | tamoxiphen | SD | ||
| MTFR1L | insertion | Frame_Shift_Ins | novel | c.567_568insGGTTTTGCTCAGA | p.Thr190GlyfsTer14 | p.T190Gfs*14 | Q9H019 | protein_coding | TCGA-AN-A046-01 | Breast | breast invasive carcinoma | Female | >=65 | I/II | Unknown | Unknown | SD | ||
| MTFR1L | insertion | Nonsense_Mutation | novel | c.569_570insATGTCTTCTAGTTCACAGATAG | p.Glu191CysfsTer7 | p.E191Cfs*7 | Q9H019 | protein_coding | TCGA-AN-A046-01 | Breast | breast invasive carcinoma | Female | >=65 | I/II | Unknown | Unknown | SD | ||
| MTFR1L | SNV | Missense_Mutation | c.573N>T | p.Glu191Asp | p.E191D | Q9H019 | protein_coding | tolerated(0.33) | probably_damaging(0.987) | TCGA-AA-A010-01 | Colorectum | colon adenocarcinoma | Female | <65 | I/II | Chemotherapy | folinic | CR | |
| MTFR1L | SNV | Missense_Mutation | c.338G>T | p.Arg113Met | p.R113M | Q9H019 | protein_coding | deleterious(0) | possibly_damaging(0.797) | TCGA-AD-5900-01 | Colorectum | colon adenocarcinoma | Male | >=65 | I/II | Unknown | Unknown | SD | |
| MTFR1L | SNV | Missense_Mutation | c.806C>T | p.Ala269Val | p.A269V | Q9H019 | protein_coding | tolerated(0.64) | benign(0.12) | TCGA-AZ-4315-01 | Colorectum | colon adenocarcinoma | Male | <65 | I/II | Unknown | Unknown | SD | |
| MTFR1L | SNV | Missense_Mutation | c.719N>T | p.Ala240Val | p.A240V | Q9H019 | protein_coding | deleterious(0.03) | probably_damaging(0.996) | TCGA-CM-6171-01 | Colorectum | colon adenocarcinoma | Female | >=65 | I/II | Unknown | Unknown | SD | |
| MTFR1L | SNV | Missense_Mutation | rs200531392 | c.379C>T | p.Arg127Cys | p.R127C | Q9H019 | protein_coding | tolerated(0.06) | probably_damaging(0.971) | TCGA-DM-A285-01 | Colorectum | colon adenocarcinoma | Female | >=65 | III/IV | Unknown | Unknown | SD |
| MTFR1L | SNV | Missense_Mutation | c.416N>A | p.Arg139His | p.R139H | Q9H019 | protein_coding | deleterious(0.04) | possibly_damaging(0.841) | TCGA-G4-6302-01 | Colorectum | colon adenocarcinoma | Female | >=65 | I/II | Unknown | Unknown | SD | |
| MTFR1L | SNV | Missense_Mutation | novel | c.626N>T | p.Ala209Val | p.A209V | Q9H019 | protein_coding | tolerated(0.09) | benign(0.007) | TCGA-AP-A1DK-01 | Endometrium | uterine corpus endometrioid carcinoma | Female | <65 | I/II | Unknown | Unknown | SD |
| Page: 1 2 3 |
Top |
Related drugs of malignant transformation related genes |
| Identification of chemicals and drugs interact with genes involved in malignant transfromation |
| (DGIdb 4.0) |
| Entrez ID | Symbol | Category | Interaction Types | Drug Claim Name | Drug Name | PMIDs |
| Page: 1 |

Copyright 2023-Present -The University of Texas Health Science Center at Houston |