
|
|||||
|
 | |
| |
| |
| |
| |
| |
|
Gene: MTFMT |
Gene summary for MTFMT |
| Gene information | Species | Human | Gene symbol | MTFMT | Gene ID | 123263 |
| Gene name | mitochondrial methionyl-tRNA formyltransferase | |
| Gene Alias | COXPD15 | |
| Cytomap | 15q22.31 | |
| Gene Type | protein-coding | GO ID | GO:0006139 | UniProtAcc | Q96DP5 |
Top |
Malignant transformation analysis |
| Identification of the aberrant gene expression in precancerous and cancerous lesions by comparing the gene expression of stem-like cells in diseased tissues with normal stem cells |
| Entrez ID | Symbol | Replicates | Species | Organ | Tissue | Adj P-value | Log2FC | Malignancy |
| 123263 | MTFMT | LZE4T | Human | Esophagus | ESCC | 1.01e-02 | 1.25e-01 | 0.0811 |
| 123263 | MTFMT | LZE7T | Human | Esophagus | ESCC | 1.70e-09 | 3.93e-01 | 0.0667 |
| 123263 | MTFMT | LZE22T | Human | Esophagus | ESCC | 1.48e-02 | 1.85e-01 | 0.068 |
| 123263 | MTFMT | LZE24T | Human | Esophagus | ESCC | 3.71e-10 | 1.54e-01 | 0.0596 |
| 123263 | MTFMT | P2T-E | Human | Esophagus | ESCC | 7.75e-20 | 2.97e-01 | 0.1177 |
| 123263 | MTFMT | P4T-E | Human | Esophagus | ESCC | 2.99e-16 | 4.17e-01 | 0.1323 |
| 123263 | MTFMT | P5T-E | Human | Esophagus | ESCC | 2.41e-12 | 1.78e-01 | 0.1327 |
| 123263 | MTFMT | P8T-E | Human | Esophagus | ESCC | 6.89e-26 | 3.20e-01 | 0.0889 |
| 123263 | MTFMT | P9T-E | Human | Esophagus | ESCC | 1.05e-12 | 2.16e-01 | 0.1131 |
| 123263 | MTFMT | P10T-E | Human | Esophagus | ESCC | 2.68e-21 | 2.79e-01 | 0.116 |
| 123263 | MTFMT | P11T-E | Human | Esophagus | ESCC | 3.66e-10 | 3.38e-01 | 0.1426 |
| 123263 | MTFMT | P12T-E | Human | Esophagus | ESCC | 3.23e-33 | 4.92e-01 | 0.1122 |
| 123263 | MTFMT | P15T-E | Human | Esophagus | ESCC | 1.19e-16 | 3.29e-01 | 0.1149 |
| 123263 | MTFMT | P16T-E | Human | Esophagus | ESCC | 3.50e-14 | 2.77e-01 | 0.1153 |
| 123263 | MTFMT | P19T-E | Human | Esophagus | ESCC | 1.52e-06 | 4.81e-01 | 0.1662 |
| 123263 | MTFMT | P20T-E | Human | Esophagus | ESCC | 8.93e-13 | 2.24e-01 | 0.1124 |
| 123263 | MTFMT | P21T-E | Human | Esophagus | ESCC | 2.17e-19 | 3.14e-01 | 0.1617 |
| 123263 | MTFMT | P22T-E | Human | Esophagus | ESCC | 1.58e-17 | 2.80e-01 | 0.1236 |
| 123263 | MTFMT | P23T-E | Human | Esophagus | ESCC | 1.27e-15 | 3.57e-01 | 0.108 |
| 123263 | MTFMT | P24T-E | Human | Esophagus | ESCC | 3.01e-09 | 1.45e-01 | 0.1287 |
| Page: 1 2 3 4 |
| Tissue | Expression Dynamics | Abbreviation |
| Esophagus |  | ESCC: Esophageal squamous cell carcinoma |
| HGIN: High-grade intraepithelial neoplasias | ||
| LGIN: Low-grade intraepithelial neoplasias | ||
| Liver | 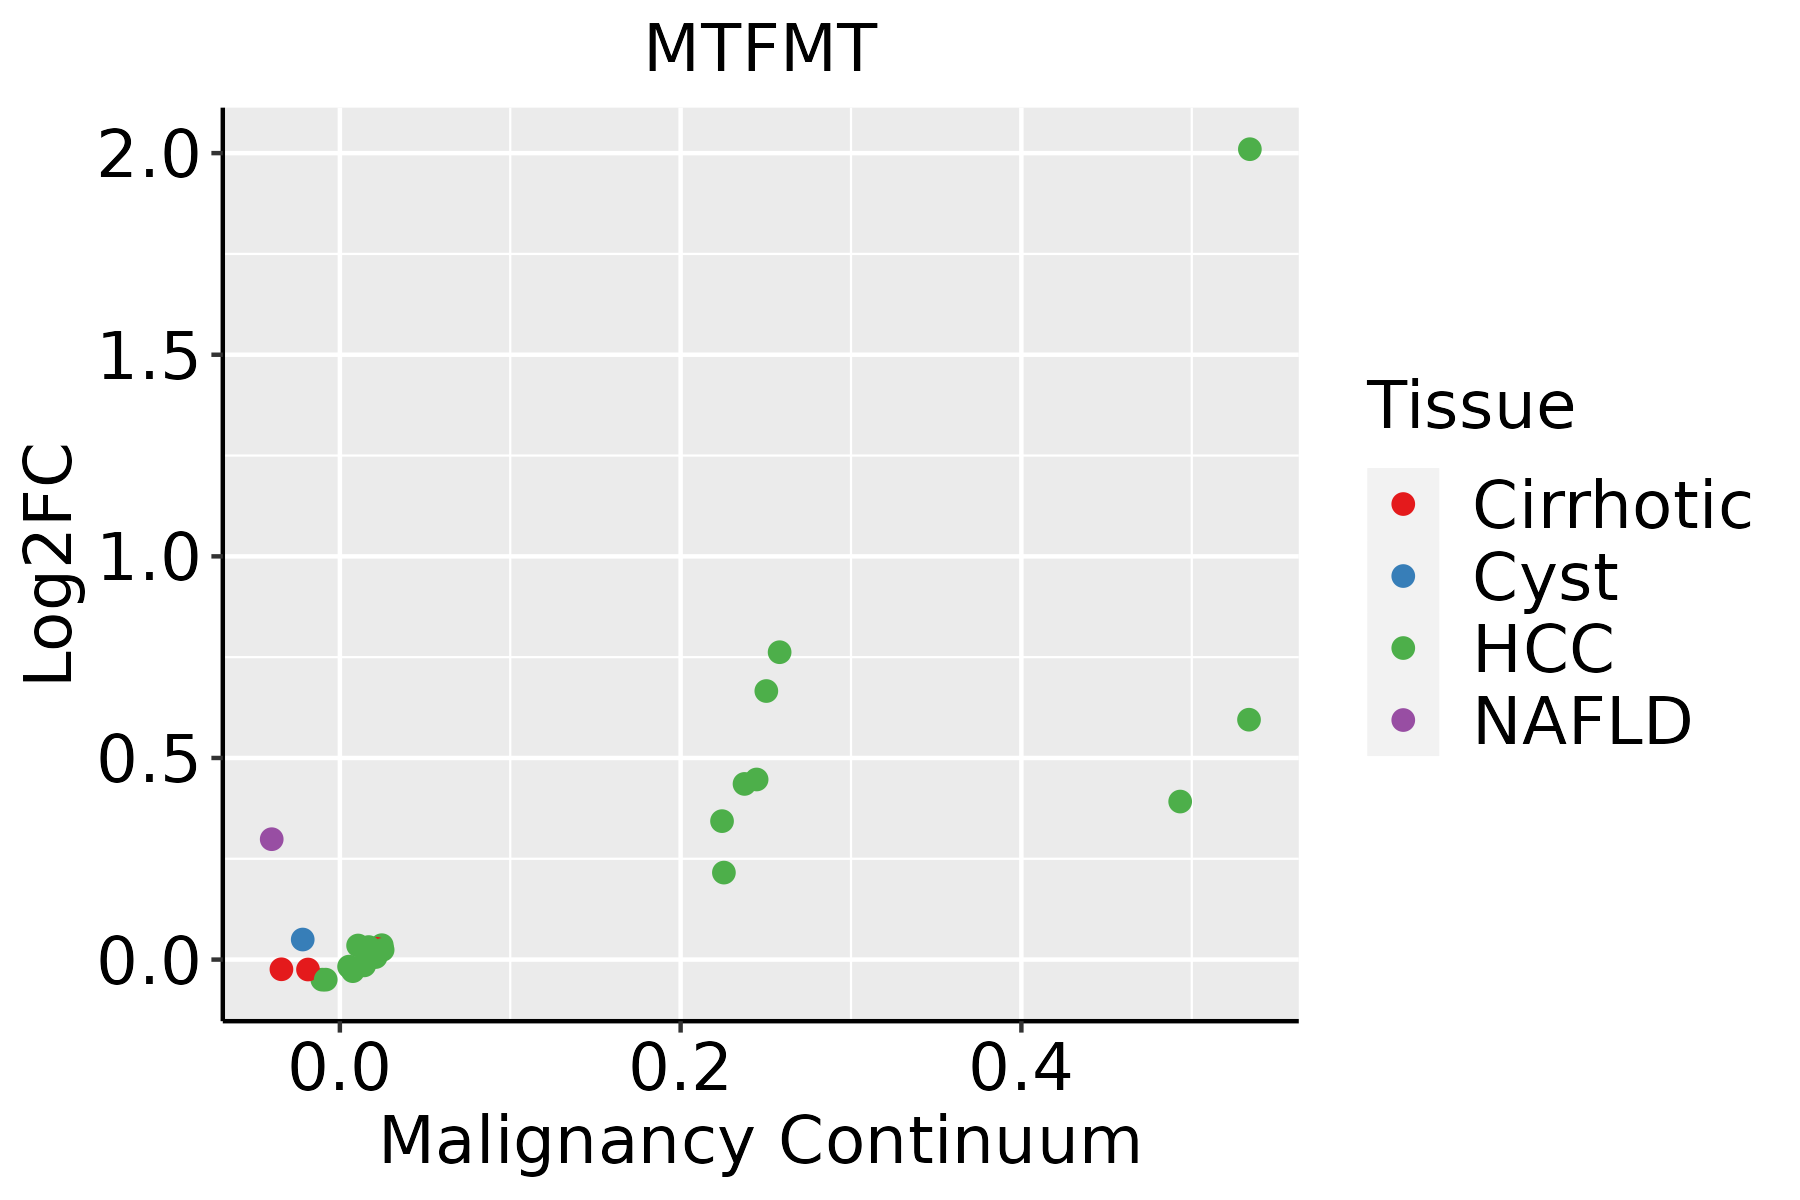 | HCC: Hepatocellular carcinoma |
| NAFLD: Non-alcoholic fatty liver disease | ||
| Oral Cavity | 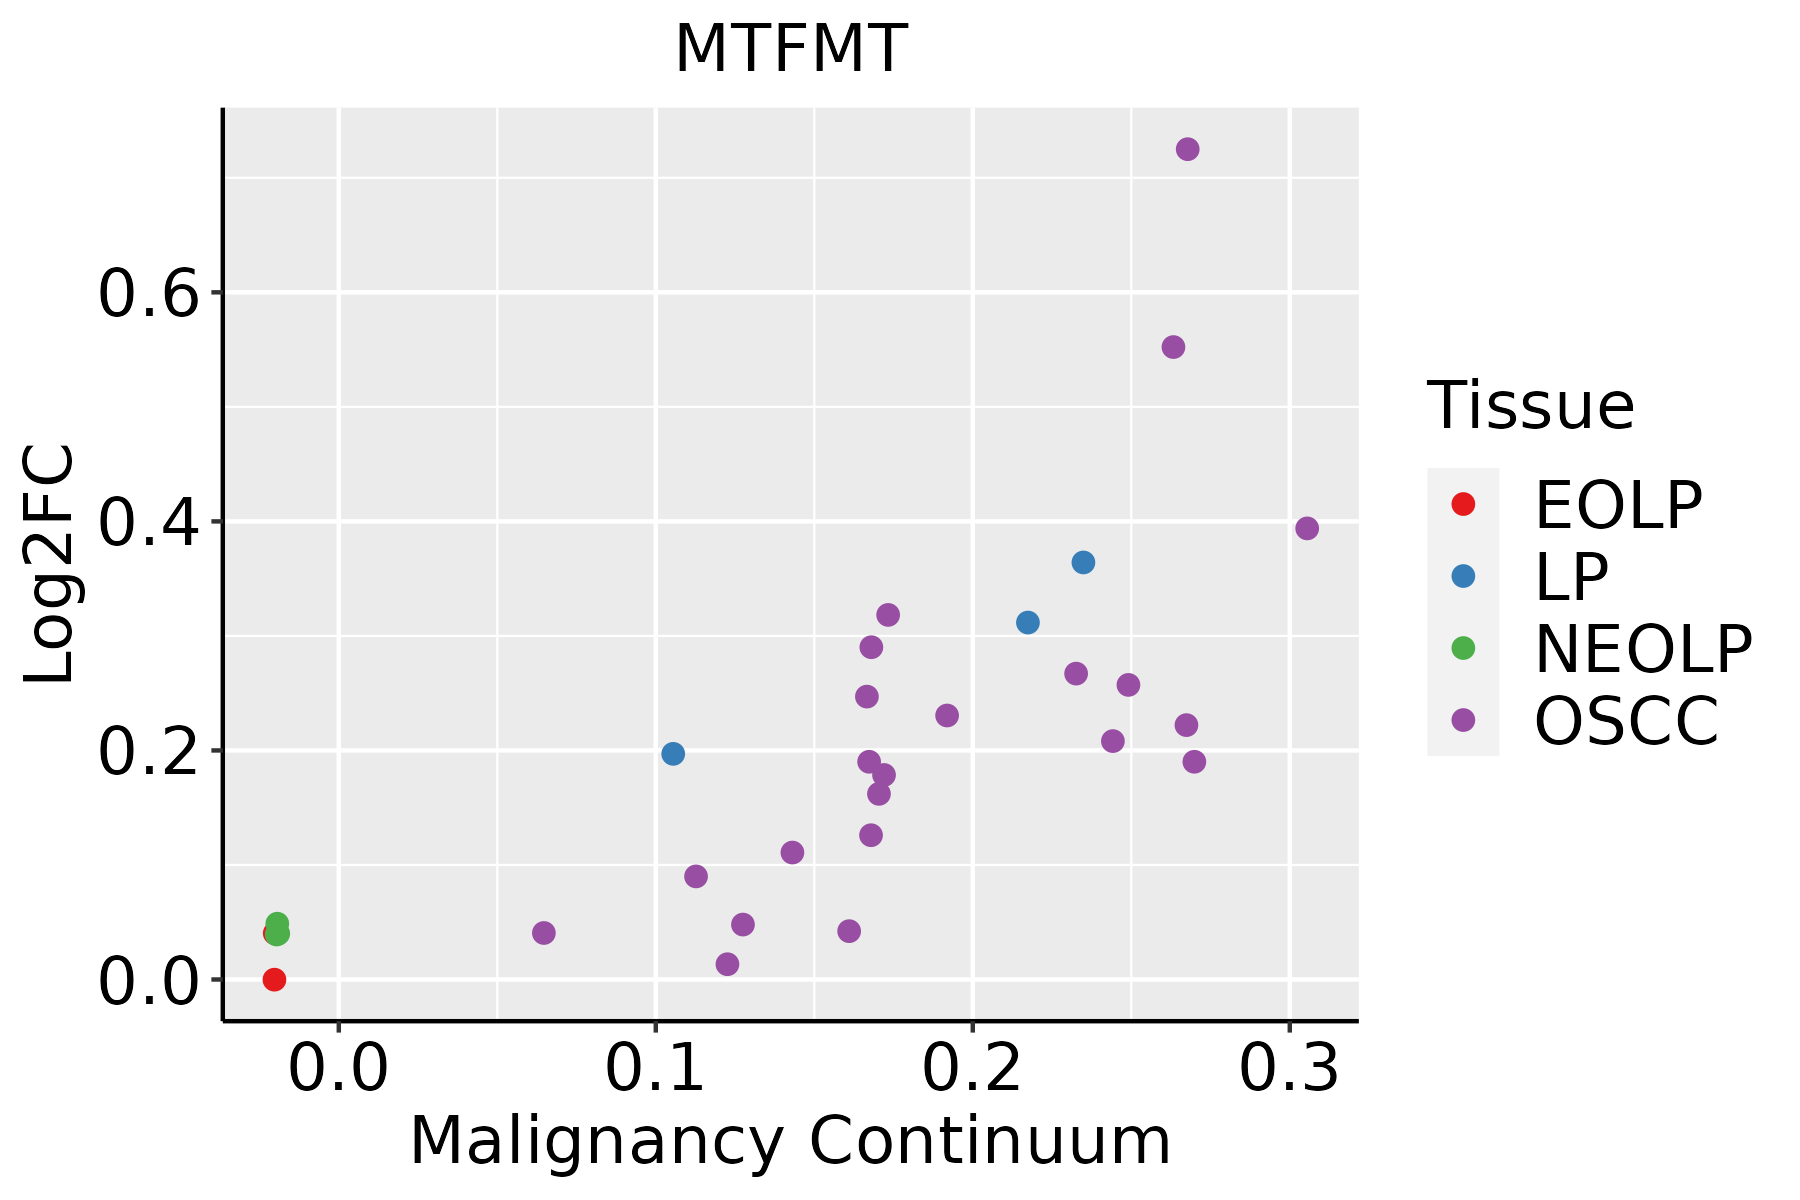 | EOLP: Erosive Oral lichen planus |
| LP: leukoplakia | ||
| NEOLP: Non-erosive oral lichen planus | ||
| OSCC: Oral squamous cell carcinoma |
| ∗log2FC in expression of this searched gene in stem-like cells from each diseased tissue sample relative to stem-like cells in normal samples in each tissue plotted against the malignancy continuum. Samples are colored based on if they are from different disease stage. |
Top |
Malignant transformation related pathway analysis |
| Find out the enriched GO biological processes and KEGG pathways involved in transition from healthy to precancer to cancer |
| Tissue | Disease Stage | Enriched GO biological Processes |
| Colorectum | AD |  |
| Colorectum | SER |  |
| Colorectum | MSS |  |
| Colorectum | MSI-H |  |
| Colorectum | FAP |  |
| ∗Top 15 enriched GO BP terms are showed in the bar plot of each disease state in each tissue. Each row represents a significant GO biological process which is colored according to the -log10(p.adjust). |
| Page: 1 2 3 4 5 6 7 8 9 |
| GO ID | Tissue | Disease Stage | Description | Gene Ratio | Bg Ratio | pvalue | p.adjust | Count |
| GO:003447015 | Esophagus | ESCC | ncRNA processing | 300/8552 | 395/18723 | 3.09e-35 | 3.26e-32 | 300 |
| GO:003466012 | Esophagus | ESCC | ncRNA metabolic process | 346/8552 | 485/18723 | 4.35e-31 | 2.51e-28 | 346 |
| GO:0006413110 | Esophagus | ESCC | translational initiation | 100/8552 | 118/18723 | 1.16e-18 | 1.25e-16 | 100 |
| GO:00080333 | Esophagus | ESCC | tRNA processing | 92/8552 | 127/18723 | 7.83e-10 | 1.93e-08 | 92 |
| GO:00063992 | Esophagus | ESCC | tRNA metabolic process | 122/8552 | 179/18723 | 9.03e-10 | 2.19e-08 | 122 |
| GO:00094512 | Esophagus | ESCC | RNA modification | 114/8552 | 167/18723 | 2.76e-09 | 6.04e-08 | 114 |
| GO:00064002 | Esophagus | ESCC | tRNA modification | 62/8552 | 90/18723 | 7.02e-06 | 7.04e-05 | 62 |
| GO:00344702 | Liver | HCC | ncRNA processing | 293/7958 | 395/18723 | 4.26e-38 | 6.76e-35 | 293 |
| GO:00346601 | Liver | HCC | ncRNA metabolic process | 332/7958 | 485/18723 | 1.48e-31 | 7.80e-29 | 332 |
| GO:000641322 | Liver | HCC | translational initiation | 94/7958 | 118/18723 | 1.39e-16 | 1.24e-14 | 94 |
| GO:0008033 | Liver | HCC | tRNA processing | 87/7958 | 127/18723 | 2.66e-09 | 7.23e-08 | 87 |
| GO:0006399 | Liver | HCC | tRNA metabolic process | 108/7958 | 179/18723 | 1.07e-06 | 1.59e-05 | 108 |
| GO:0009451 | Liver | HCC | RNA modification | 101/7958 | 167/18723 | 2.02e-06 | 2.78e-05 | 101 |
| GO:0006400 | Liver | HCC | tRNA modification | 60/7958 | 90/18723 | 3.09e-06 | 4.09e-05 | 60 |
| GO:00344709 | Oral cavity | OSCC | ncRNA processing | 263/7305 | 395/18723 | 4.38e-29 | 2.78e-26 | 263 |
| GO:00346605 | Oral cavity | OSCC | ncRNA metabolic process | 296/7305 | 485/18723 | 2.94e-23 | 6.65e-21 | 296 |
| GO:000641318 | Oral cavity | OSCC | translational initiation | 96/7305 | 118/18723 | 4.02e-21 | 7.06e-19 | 96 |
| GO:00080332 | Oral cavity | OSCC | tRNA processing | 78/7305 | 127/18723 | 2.56e-07 | 4.00e-06 | 78 |
| GO:00063991 | Oral cavity | OSCC | tRNA metabolic process | 101/7305 | 179/18723 | 1.65e-06 | 2.15e-05 | 101 |
| GO:00094511 | Oral cavity | OSCC | RNA modification | 95/7305 | 167/18723 | 2.05e-06 | 2.62e-05 | 95 |
| Page: 1 2 |
| Pathway ID | Tissue | Disease Stage | Description | Gene Ratio | Bg Ratio | pvalue | p.adjust | qvalue | Count |
| hsa006702 | Liver | HCC | One carbon pool by folate | 17/4020 | 20/8465 | 6.04e-04 | 2.50e-03 | 1.39e-03 | 17 |
| hsa0067011 | Liver | HCC | One carbon pool by folate | 17/4020 | 20/8465 | 6.04e-04 | 2.50e-03 | 1.39e-03 | 17 |
| Page: 1 |
Top |
Cell-cell communication analysis |
| Identification of potential cell-cell interactions between two cell types and their ligand-receptor pairs for different disease states |
| Ligand | Receptor | LRpair | Pathway | Tissue | Disease Stage |
| Page: 1 |
Top |
Single-cell gene regulatory network inference analysis |
| Find out the significant the regulons (TFs) and the target genes of each regulon across cell types for different disease states |
| TF | Cell Type | Tissue | Disease Stage | Target Gene | RSS | Regulon Activity |
| ∗The dot plots of a searched regulon are shown for all cell subpopulations in each disease state of each tissue based on the regulon specific score inferred using pySCENIC and by calculating the average expression. |
| Page: 1 |
Top |
Somatic mutation of malignant transformation related genes |
| Annotation of somatic variants for genes involved in malignant transformation |
| Hugo Symbol | Variant Class | Variant Classification | dbSNP RS | HGVSc | HGVSp | HGVSp Short | SWISSPROT | BIOTYPE | SIFT | PolyPhen | Tumor Sample Barcode | Tissue | Histology | Sex | Age | Stage | Therapy Types | Drugs | Outcome |
| MTFMT | SNV | Missense_Mutation | rs758882234 | c.839N>T | p.Ala280Val | p.A280V | Q96DP5 | protein_coding | deleterious(0.05) | benign(0.076) | TCGA-2W-A8YY-01 | Cervix | cervical & endocervical cancer | Female | <65 | I/II | Chemotherapy | cisplatin | CR |
| MTFMT | SNV | Missense_Mutation | c.998N>T | p.Ser333Leu | p.S333L | Q96DP5 | protein_coding | deleterious(0.04) | possibly_damaging(0.578) | TCGA-4J-AA1J-01 | Cervix | cervical & endocervical cancer | Female | <65 | I/II | Unknown | Unknown | SD | |
| MTFMT | SNV | Missense_Mutation | c.1015N>A | p.Ser339Thr | p.S339T | Q96DP5 | protein_coding | tolerated(0.32) | benign(0) | TCGA-AD-6895-01 | Colorectum | colon adenocarcinoma | Male | >=65 | III/IV | Unknown | Unknown | SD | |
| MTFMT | SNV | Missense_Mutation | c.1011N>T | p.Lys337Asn | p.K337N | Q96DP5 | protein_coding | deleterious(0.04) | possibly_damaging(0.865) | TCGA-AG-A002-01 | Colorectum | rectum adenocarcinoma | Male | <65 | I/II | Unknown | Unknown | SD | |
| MTFMT | SNV | Missense_Mutation | novel | c.1030N>A | p.Asp344Asn | p.D344N | Q96DP5 | protein_coding | deleterious(0) | probably_damaging(0.985) | TCGA-A5-A0G2-01 | Endometrium | uterine corpus endometrioid carcinoma | Female | <65 | III/IV | Unknown | Unknown | SD |
| MTFMT | SNV | Missense_Mutation | novel | c.467C>T | p.Pro156Leu | p.P156L | Q96DP5 | protein_coding | deleterious(0) | probably_damaging(0.954) | TCGA-AJ-A3BG-01 | Endometrium | uterine corpus endometrioid carcinoma | Female | >=65 | I/II | Chemotherapy | carboplatin | PD |
| MTFMT | SNV | Missense_Mutation | novel | c.541N>G | p.Arg181Gly | p.R181G | Q96DP5 | protein_coding | deleterious(0) | probably_damaging(0.993) | TCGA-AX-A2HA-01 | Endometrium | uterine corpus endometrioid carcinoma | Female | <65 | I/II | Unknown | Unknown | SD |
| MTFMT | SNV | Missense_Mutation | novel | c.992N>G | p.Val331Gly | p.V331G | Q96DP5 | protein_coding | deleterious(0) | possibly_damaging(0.7) | TCGA-AX-A2HD-01 | Endometrium | uterine corpus endometrioid carcinoma | Female | >=65 | III/IV | Unknown | Unknown | SD |
| MTFMT | SNV | Missense_Mutation | novel | c.573N>C | p.Glu191Asp | p.E191D | Q96DP5 | protein_coding | deleterious(0.01) | probably_damaging(0.966) | TCGA-AX-A2HD-01 | Endometrium | uterine corpus endometrioid carcinoma | Female | >=65 | III/IV | Unknown | Unknown | SD |
| MTFMT | SNV | Missense_Mutation | novel | c.949N>G | p.Ser317Ala | p.S317A | Q96DP5 | protein_coding | deleterious(0.03) | benign(0.171) | TCGA-B5-A11E-01 | Endometrium | uterine corpus endometrioid carcinoma | Female | <65 | I/II | Unknown | Unknown | SD |
| Page: 1 2 3 |
Top |
Related drugs of malignant transformation related genes |
| Identification of chemicals and drugs interact with genes involved in malignant transfromation |
| (DGIdb 4.0) |
| Entrez ID | Symbol | Category | Interaction Types | Drug Claim Name | Drug Name | PMIDs |
| Page: 1 |

Copyright 2023-Present -The University of Texas Health Science Center at Houston |