Schematic overview of the cellular and molecular mechanisms involved in the cancer progression, including the proposed cellular and molecular mechanisms in cancer cells trajectory. AT1: alveolar type 1 cells; AT2: alveolar type 2 cells; AAH: atypical adenomatous hyperplasia; AIS: adenocarcinoma in situ; MIA: minimally invasive adenocarcinoma; IA: invasive adenocarcinoma; EMT: epithelial-mesenchymal transition

Home

Download

Statistics

Help

Contact

Center for Computational Systems Medicine
leaf

Gene summary

leaf

Malignant transformation analysis

leaf

Malignant transformation related pathway analysis

leaf

Cell-cell communication analysis

leaf

Single-cell gene regulatory network inference analysis

leaf

Somatic mutation of malignant transformation related genes

leaf

Related drugs of malignant transformation related genes

Gene: MTF2

Gene summary for MTF2

check button Gene summary.

Gene informationSpeciesHuman
Gene symbol

MTF2

Gene ID

22823

Gene namemetal response element binding transcription factor 2
Gene AliasM96
Cytomap1p22.1
Gene Typeprotein-coding
GO ID

GO:0000122

UniProtAcc

B4DZ69


Top

Malignant transformation analysis

check button Identification of the aberrant gene expression in precancerous and cancerous lesions by comparing the gene expression of stem-like cells in diseased tissues with normal stem cells
check button Malignant transformation involving gene list.
Entrez IDSymbolReplicatesSpeciesOrganTissueAdj P-valueLog2FCMalignancy
22823MTF2CCI_2HumanCervixCC9.33e-067.56e-010.5249
22823MTF2CCI_3HumanCervixCC5.88e-098.29e-010.516
22823MTF2LZE4THumanEsophagusESCC1.90e-092.43e-010.0811
22823MTF2LZE7THumanEsophagusESCC7.76e-136.88e-010.0667
22823MTF2LZE8THumanEsophagusESCC1.63e-123.23e-010.067
22823MTF2LZE20THumanEsophagusESCC9.83e-152.79e-010.0662
22823MTF2LZE24THumanEsophagusESCC5.00e-132.44e-010.0596
22823MTF2LZE21THumanEsophagusESCC8.49e-032.55e-010.0655
22823MTF2LZE6THumanEsophagusESCC2.34e-031.71e-010.0845
22823MTF2P1T-EHumanEsophagusESCC1.42e-145.03e-010.0875
22823MTF2P2T-EHumanEsophagusESCC1.39e-447.91e-010.1177
22823MTF2P4T-EHumanEsophagusESCC5.22e-223.87e-010.1323
22823MTF2P5T-EHumanEsophagusESCC3.30e-204.22e-010.1327
22823MTF2P8T-EHumanEsophagusESCC2.41e-234.73e-010.0889
22823MTF2P9T-EHumanEsophagusESCC5.13e-152.16e-010.1131
22823MTF2P10T-EHumanEsophagusESCC1.09e-427.48e-010.116
22823MTF2P11T-EHumanEsophagusESCC6.60e-052.52e-010.1426
22823MTF2P12T-EHumanEsophagusESCC1.62e-841.80e+000.1122
22823MTF2P15T-EHumanEsophagusESCC1.44e-265.43e-010.1149
22823MTF2P16T-EHumanEsophagusESCC4.75e-112.90e-010.1153
Page: 1 2 3 4 5 6 

check button Transcriptomic changes along malignancy continuum.
TissueExpression DynamicsAbbreviation
CervixThe image shows the transcriptomic changes along malignancy continuum.log2FC in expression of this searched gene in stem-like cells from each diseased tissue sample relative to stem-like cells in normal samples in each tissue plotted against the malignancy continuum. Samples are colored based on if they are from different disease stage.CC: Cervix cancer
HSIL_HPV: HPV-infected high-grade squamous intraepithelial lesions
N_HPV: HPV-infected normal cervix
EsophagusThe image shows the transcriptomic changes along malignancy continuum.log2FC in expression of this searched gene in stem-like cells from each diseased tissue sample relative to stem-like cells in normal samples in each tissue plotted against the malignancy continuum. Samples are colored based on if they are from different disease stage.
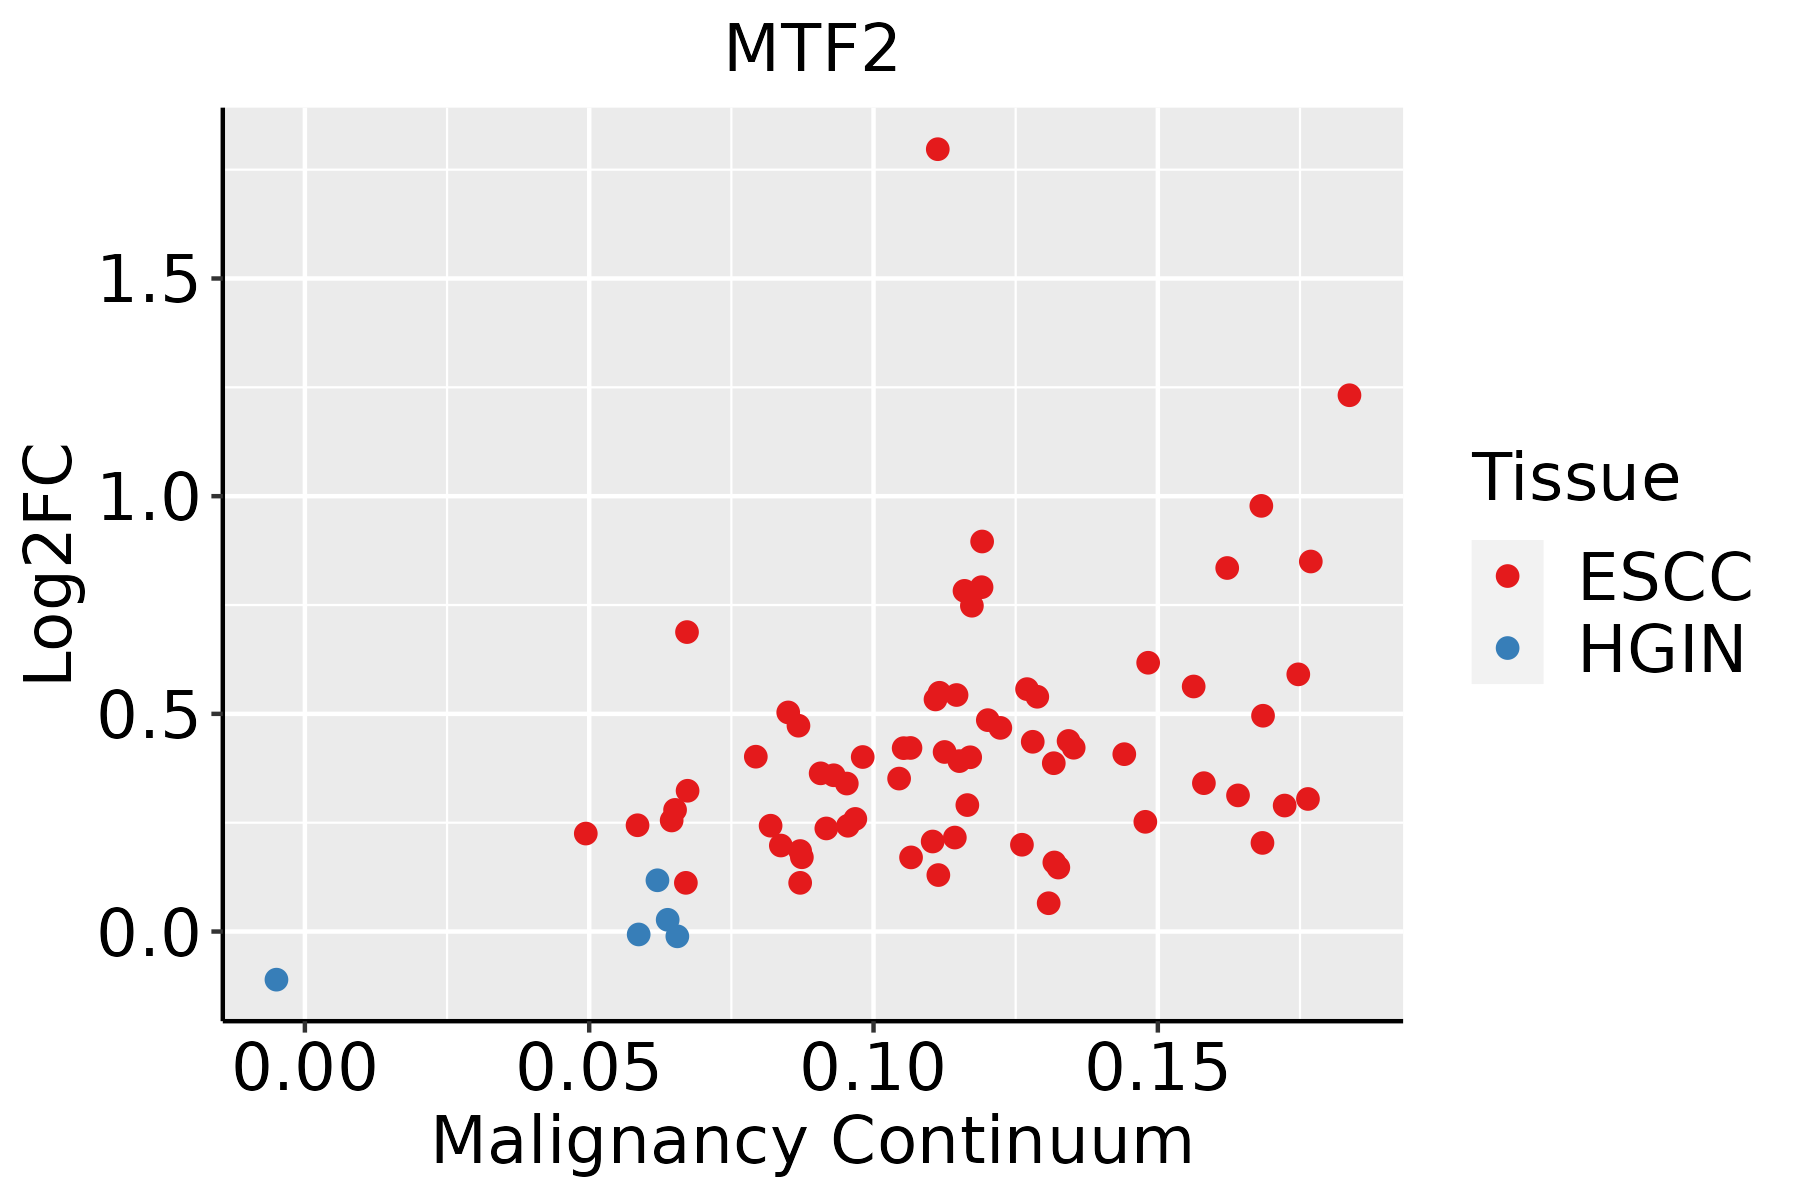
ESCC: Esophageal squamous cell carcinoma
HGIN: High-grade intraepithelial neoplasias
LGIN: Low-grade intraepithelial neoplasias
LiverThe image shows the transcriptomic changes along malignancy continuum.log2FC in expression of this searched gene in stem-like cells from each diseased tissue sample relative to stem-like cells in normal samples in each tissue plotted against the malignancy continuum. Samples are colored based on if they are from different disease stage.
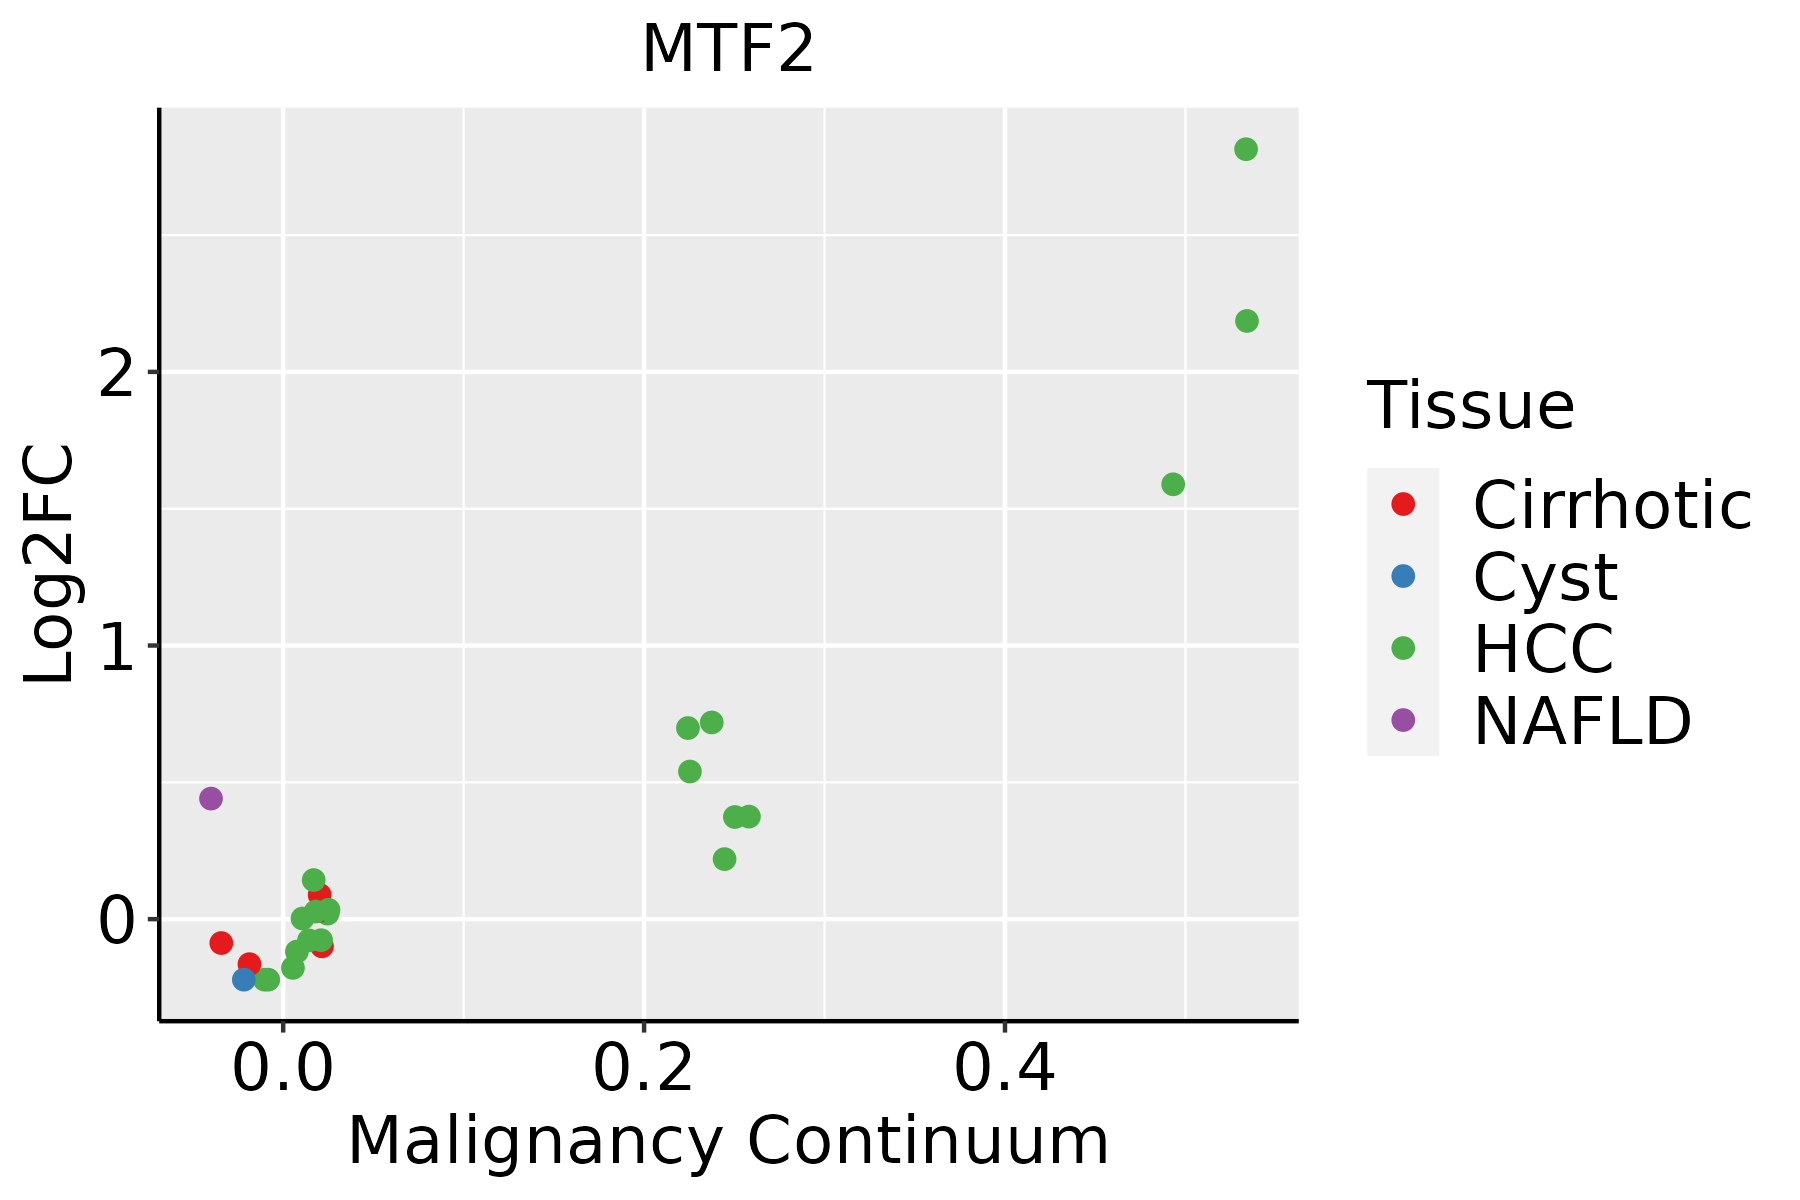
HCC: Hepatocellular carcinoma
NAFLD: Non-alcoholic fatty liver disease
LungThe image shows the transcriptomic changes along malignancy continuum.log2FC in expression of this searched gene in stem-like cells from each diseased tissue sample relative to stem-like cells in normal samples in each tissue plotted against the malignancy continuum. Samples are colored based on if they are from different disease stage.
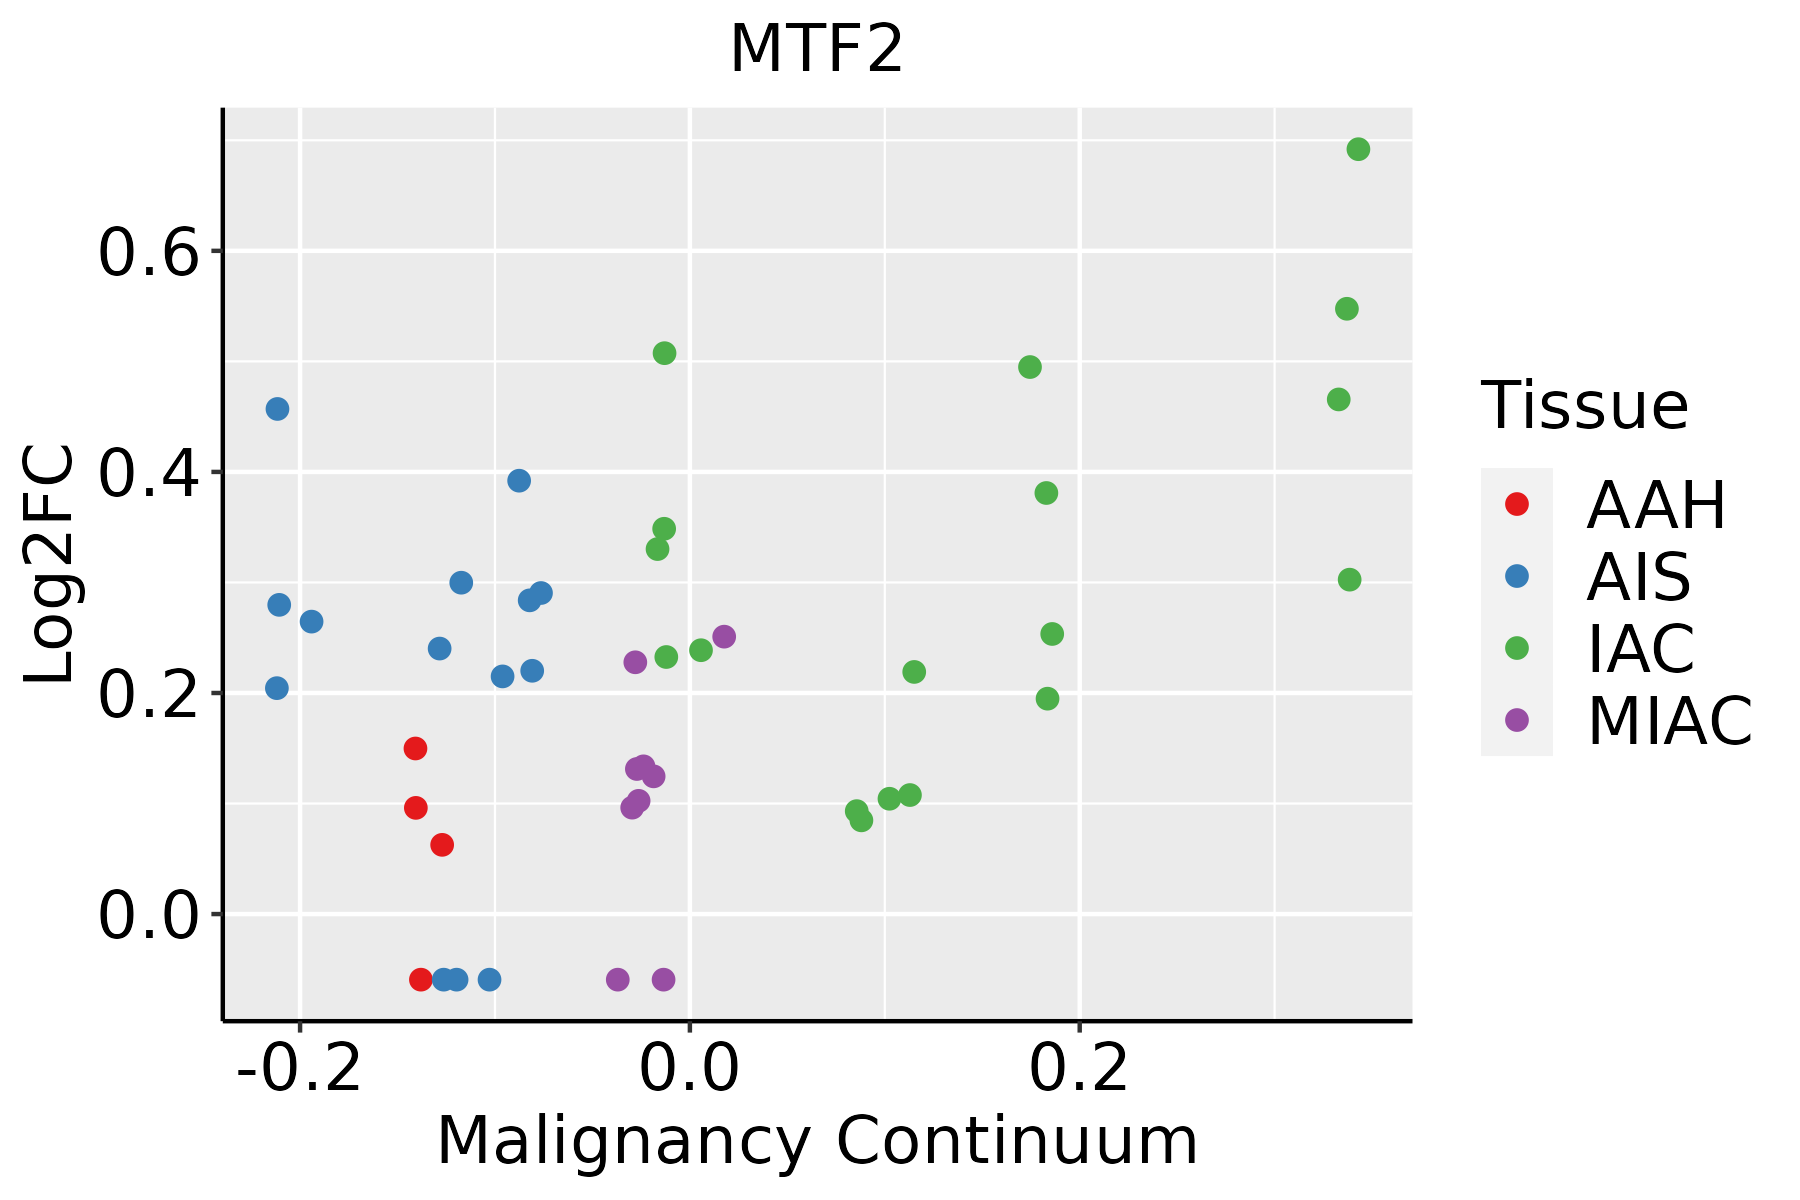
AAH: Atypical adenomatous hyperplasia
AIS: Adenocarcinoma in situ
IAC: Invasive lung adenocarcinoma
MIA: Minimally invasive adenocarcinoma
Oral CavityThe image shows the transcriptomic changes along malignancy continuum.log2FC in expression of this searched gene in stem-like cells from each diseased tissue sample relative to stem-like cells in normal samples in each tissue plotted against the malignancy continuum. Samples are colored based on if they are from different disease stage.
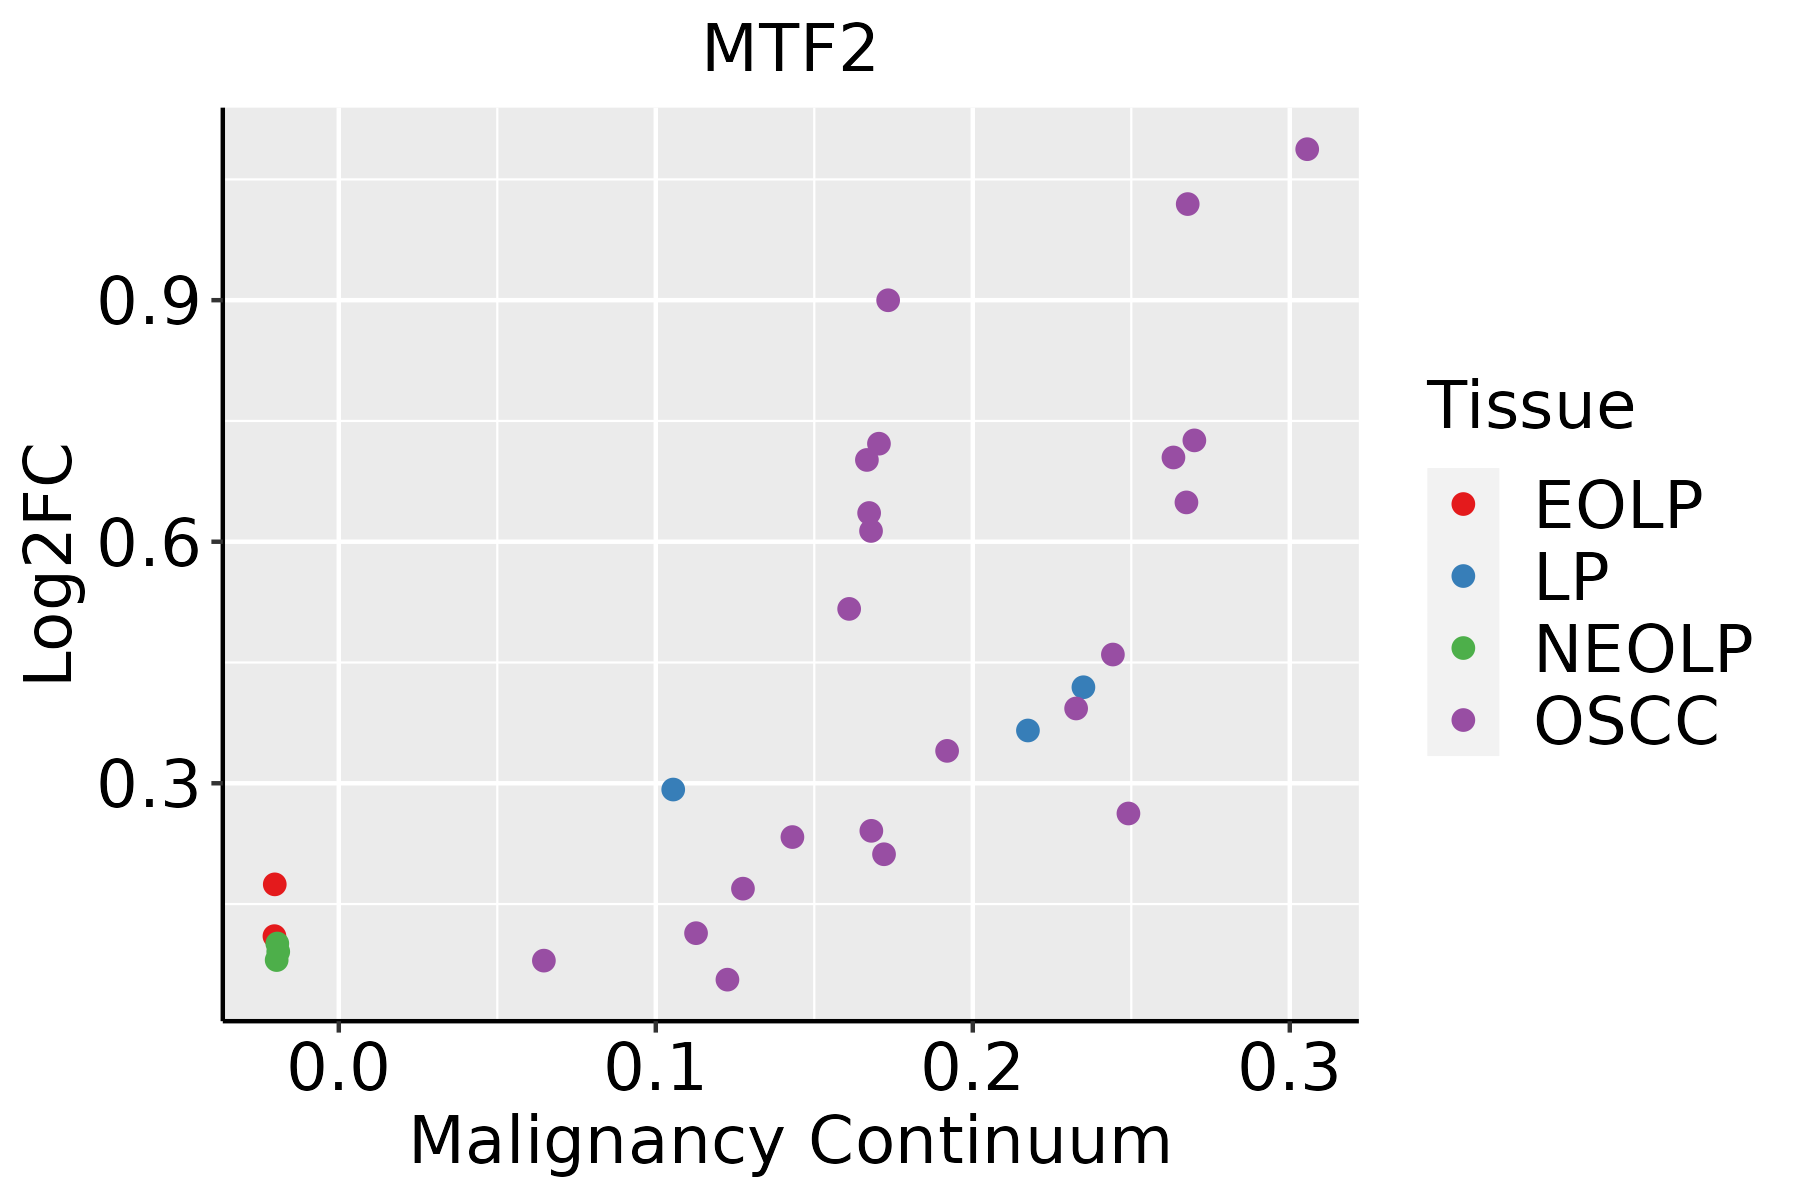
EOLP: Erosive Oral lichen planus
LP: leukoplakia
NEOLP: Non-erosive oral lichen planus
OSCC: Oral squamous cell carcinoma
ThyroidThe image shows the transcriptomic changes along malignancy continuum.log2FC in expression of this searched gene in stem-like cells from each diseased tissue sample relative to stem-like cells in normal samples in each tissue plotted against the malignancy continuum. Samples are colored based on if they are from different disease stage.ATC: Anaplastic thyroid cancer
HT: Hashimoto's thyroiditis
PTC: Papillary thyroid cancer
∗log2FC in expression of this searched gene in stem-like cells from each diseased tissue sample relative to stem-like cells in normal samples in each tissue plotted against the malignancy continuum. Samples are colored based on if they are from different disease stage.

Top

Malignant transformation related pathway analysis

check buttonFind out the enriched GO biological processes and KEGG pathways involved in transition from healthy to precancer to cancer
check button Figure of enriched GO biological processes.
TissueDisease StageEnriched GO biological Processes
ColorectumADGO analysis - Figure of enriched GO biological processes: Top 15 enriched GO BP terms are showed in the bar plot of each disease state in each tissue. Each row represents a significant GO biological process which is colored according to the -log10(p.adjust).
ColorectumSERGO analysis - Figure of enriched GO biological processes: Top 15 enriched GO BP terms are showed in the bar plot of each disease state in each tissue. Each row represents a significant GO biological process which is colored according to the -log10(p.adjust).
ColorectumMSSGO analysis - Figure of enriched GO biological processes: Top 15 enriched GO BP terms are showed in the bar plot of each disease state in each tissue. Each row represents a significant GO biological process which is colored according to the -log10(p.adjust).
ColorectumMSI-HGO analysis - Figure of enriched GO biological processes: Top 15 enriched GO BP terms are showed in the bar plot of each disease state in each tissue. Each row represents a significant GO biological process which is colored according to the -log10(p.adjust).
ColorectumFAPGO analysis - Figure of enriched GO biological processes: Top 15 enriched GO BP terms are showed in the bar plot of each disease state in each tissue. Each row represents a significant GO biological process which is colored according to the -log10(p.adjust).
∗Top 15 enriched GO BP terms are showed in the bar plot of each disease state in each tissue. Each row represents a significant GO biological process which is colored according to the -log10(p.adjust).
Page: 1 2 3 4 5 6 7 8 9 

check button Enriched GO biological processes.
GO IDTissueDisease StageDescriptionGene RatioBg Ratiopvaluep.adjustCount
GO:00488634CervixCCstem cell differentiation46/2311206/187234.11e-056.36e-0446
GO:00063257CervixCCchromatin organization78/2311409/187235.40e-058.02e-0478
GO:00165705CervixCChistone modification84/2311463/187231.70e-042.01e-0384
GO:00349685CervixCChistone lysine methylation27/2311115/187236.61e-046.09e-0327
GO:00310565CervixCCregulation of histone modification33/2311152/187237.97e-047.00e-0333
GO:00987275CervixCCmaintenance of cell number30/2311134/187237.98e-047.00e-0330
GO:00198274CervixCCstem cell population maintenance29/2311131/187231.17e-039.47e-0329
GO:00165715CervixCChistone methylation30/2311141/187231.88e-031.39e-0230
GO:19908234CervixCCresponse to leukemia inhibitory factor22/231195/187232.40e-031.70e-0222
GO:00180224CervixCCpeptidyl-lysine methylation28/2311131/187232.43e-031.71e-0228
GO:00064795CervixCCprotein methylation36/2311181/187232.46e-031.71e-0236
GO:00082135CervixCCprotein alkylation36/2311181/187232.46e-031.71e-0236
GO:19908304CervixCCcellular response to leukemia inhibitory factor21/231194/187234.68e-032.82e-0221
GO:00182054CervixCCpeptidyl-lysine modification62/2311376/187231.04e-024.97e-0262
GO:001657015EsophagusESCChistone modification323/8552463/187232.61e-267.88e-24323
GO:001820514EsophagusESCCpeptidyl-lysine modification259/8552376/187233.90e-205.26e-18259
GO:00434143EsophagusESCCmacromolecule methylation199/8552316/187233.44e-109.57e-09199
GO:003105614EsophagusESCCregulation of histone modification106/8552152/187231.52e-093.55e-08106
GO:00322592EsophagusESCCmethylation222/8552364/187232.26e-095.09e-08222
GO:000632517EsophagusESCCchromatin organization240/8552409/187236.52e-081.14e-06240
Page: 1 2 3 4 5 6 7 8 9 

check button Enriched KEGG pathways.
Pathway IDTissueDisease StageDescriptionGene RatioBg Ratiopvaluep.adjustqvalueCount
Page: 1 

Top

Cell-cell communication analysis

check buttonIdentification of potential cell-cell interactions between two cell types and their ligand-receptor pairs for different disease states
LigandReceptorLRpairPathwayTissueDisease Stage
Page: 1 

Top

Single-cell gene regulatory network inference analysis

check buttonFind out the significant the regulons (TFs) and the target genes of each regulon across cell types for different disease states
TFCell TypeTissueDisease StageTarget GeneRSSRegulon Activity
∗The dot plots of a searched regulon are shown for all cell subpopulations in each disease state of each tissue based on the regulon specific score inferred using pySCENIC and by calculating the average expression.
Page: 1 

Top

Somatic mutation of malignant transformation related genes

check buttonAnnotation of somatic variants for genes involved in malignant transformation
Hugo SymbolVariant ClassVariant ClassificationdbSNP RSHGVScHGVSpHGVSp ShortSWISSPROTBIOTYPESIFTPolyPhenTumor Sample BarcodeTissueHistologySexAgeStageTherapy TypesDrugsOutcome
MTF2SNVMissense_Mutationc.1412N>Gp.Ser471Cysp.S471CQ9Y483protein_codingdeleterious(0)possibly_damaging(0.794)TCGA-A8-A094-01Breastbreast invasive carcinomaFemale>=65I/IIUnknownUnknownSD
MTF2SNVMissense_Mutationc.1020G>Cp.Lys340Asnp.K340NQ9Y483protein_codingdeleterious(0)probably_damaging(0.994)TCGA-AO-A0JM-01Breastbreast invasive carcinomaFemale<65I/IIChemotherapydoxorubicinSD
MTF2insertionFrame_Shift_Insnovelc.1230_1231insTATATTTTATTp.Arg411TyrfsTer7p.R411Yfs*7Q9Y483protein_codingTCGA-AC-A3QQ-01Breastbreast invasive carcinomaFemale<65I/IIUnknownUnknownSD
MTF2insertionFrame_Shift_Insnovelc.1180_1181insTAAAAAAAGTp.Glu394ValfsTer29p.E394Vfs*29Q9Y483protein_codingTCGA-AR-A0TU-01Breastbreast invasive carcinomaFemale<65I/IIUnspecificDoxorubicinSD
MTF2insertionFrame_Shift_Insrs774769534c.1180_1181insAp.Gly397ArgfsTer23p.G397Rfs*23Q9Y483protein_codingTCGA-AR-A0U2-01Breastbreast invasive carcinomaFemale<65III/IVHormone TherapytamoxiphenPD
MTF2insertionNonsense_Mutationnovelc.1719_1720insTCTTGGAGCTGAAp.Arg574SerfsTer4p.R574Sfs*4Q9Y483protein_codingTCGA-B6-A0IK-01Breastbreast invasive carcinomaFemale<65III/IVUnknownUnknownPD
MTF2insertionNonsense_Mutationnovelc.1679_1680insAAAGGCAACCTTAAATTAATAGCp.Arg561LysfsTer6p.R561Kfs*6Q9Y483protein_codingTCGA-BH-A0E0-01Breastbreast invasive carcinomaFemale<65III/IVChemotherapydocetaxelSD
MTF2SNVMissense_Mutationnovelc.206T>Cp.Ile69Thrp.I69TQ9Y483protein_codingdeleterious(0)probably_damaging(0.925)TCGA-2W-A8YY-01Cervixcervical & endocervical cancerFemale<65I/IIChemotherapycisplatinCR
MTF2SNVMissense_Mutationrs759180756c.1045C>Tp.Arg349Cysp.R349CQ9Y483protein_codingdeleterious(0.03)possibly_damaging(0.769)TCGA-2W-A8YY-01Cervixcervical & endocervical cancerFemale<65I/IIChemotherapycisplatinCR
MTF2insertionFrame_Shift_Insnovelc.186_187insAp.Leu63ThrfsTer19p.L63Tfs*19Q9Y483protein_codingTCGA-DS-A1OC-01Cervixcervical & endocervical cancerFemale<65I/IIChemotherapygemcitabineSD
Page: 1 2 3 4 5 6 7 8 9 

Top

Related drugs of malignant transformation related genes

check buttonIdentification of chemicals and drugs interact with genes involved in malignant transfromation
(DGIdb 4.0)
Entrez IDSymbolCategoryInteraction TypesDrug Claim NameDrug NamePMIDs
Page: 1