
|
|||||
|
 | |
| |
| |
| |
| |
| |
|
Gene: MTF1 |
Gene summary for MTF1 |
| Gene information | Species | Human | Gene symbol | MTF1 | Gene ID | 4520 |
| Gene name | metal regulatory transcription factor 1 | |
| Gene Alias | MTF-1 | |
| Cytomap | 1p34.3 | |
| Gene Type | protein-coding | GO ID | GO:0001894 | UniProtAcc | Q14872 |
Top |
Malignant transformation analysis |
| Identification of the aberrant gene expression in precancerous and cancerous lesions by comparing the gene expression of stem-like cells in diseased tissues with normal stem cells |
| Entrez ID | Symbol | Replicates | Species | Organ | Tissue | Adj P-value | Log2FC | Malignancy |
| 4520 | MTF1 | LZE7T | Human | Esophagus | ESCC | 1.72e-03 | 1.79e-01 | 0.0667 |
| 4520 | MTF1 | LZE20T | Human | Esophagus | ESCC | 9.40e-03 | 8.30e-02 | 0.0662 |
| 4520 | MTF1 | LZE22D1 | Human | Esophagus | HGIN | 4.28e-03 | 1.49e-01 | 0.0595 |
| 4520 | MTF1 | LZE24T | Human | Esophagus | ESCC | 1.20e-14 | 3.91e-01 | 0.0596 |
| 4520 | MTF1 | P1T-E | Human | Esophagus | ESCC | 2.03e-04 | 2.78e-01 | 0.0875 |
| 4520 | MTF1 | P2T-E | Human | Esophagus | ESCC | 2.07e-17 | 2.54e-01 | 0.1177 |
| 4520 | MTF1 | P4T-E | Human | Esophagus | ESCC | 1.19e-08 | 1.59e-01 | 0.1323 |
| 4520 | MTF1 | P5T-E | Human | Esophagus | ESCC | 5.56e-08 | 8.89e-02 | 0.1327 |
| 4520 | MTF1 | P8T-E | Human | Esophagus | ESCC | 3.10e-10 | 1.97e-01 | 0.0889 |
| 4520 | MTF1 | P9T-E | Human | Esophagus | ESCC | 3.76e-07 | 8.55e-02 | 0.1131 |
| 4520 | MTF1 | P10T-E | Human | Esophagus | ESCC | 1.68e-17 | 2.42e-01 | 0.116 |
| 4520 | MTF1 | P11T-E | Human | Esophagus | ESCC | 4.93e-05 | 1.81e-01 | 0.1426 |
| 4520 | MTF1 | P12T-E | Human | Esophagus | ESCC | 5.91e-05 | 1.28e-01 | 0.1122 |
| 4520 | MTF1 | P15T-E | Human | Esophagus | ESCC | 6.54e-08 | 1.71e-01 | 0.1149 |
| 4520 | MTF1 | P16T-E | Human | Esophagus | ESCC | 1.70e-12 | 1.10e-01 | 0.1153 |
| 4520 | MTF1 | P17T-E | Human | Esophagus | ESCC | 1.18e-02 | 2.44e-01 | 0.1278 |
| 4520 | MTF1 | P20T-E | Human | Esophagus | ESCC | 3.58e-15 | 3.62e-01 | 0.1124 |
| 4520 | MTF1 | P21T-E | Human | Esophagus | ESCC | 9.67e-15 | 3.20e-01 | 0.1617 |
| 4520 | MTF1 | P22T-E | Human | Esophagus | ESCC | 2.41e-03 | 4.49e-02 | 0.1236 |
| 4520 | MTF1 | P23T-E | Human | Esophagus | ESCC | 5.88e-13 | 2.53e-01 | 0.108 |
| Page: 1 2 3 4 |
| Tissue | Expression Dynamics | Abbreviation |
| Esophagus |  | ESCC: Esophageal squamous cell carcinoma |
| HGIN: High-grade intraepithelial neoplasias | ||
| LGIN: Low-grade intraepithelial neoplasias | ||
| Liver | 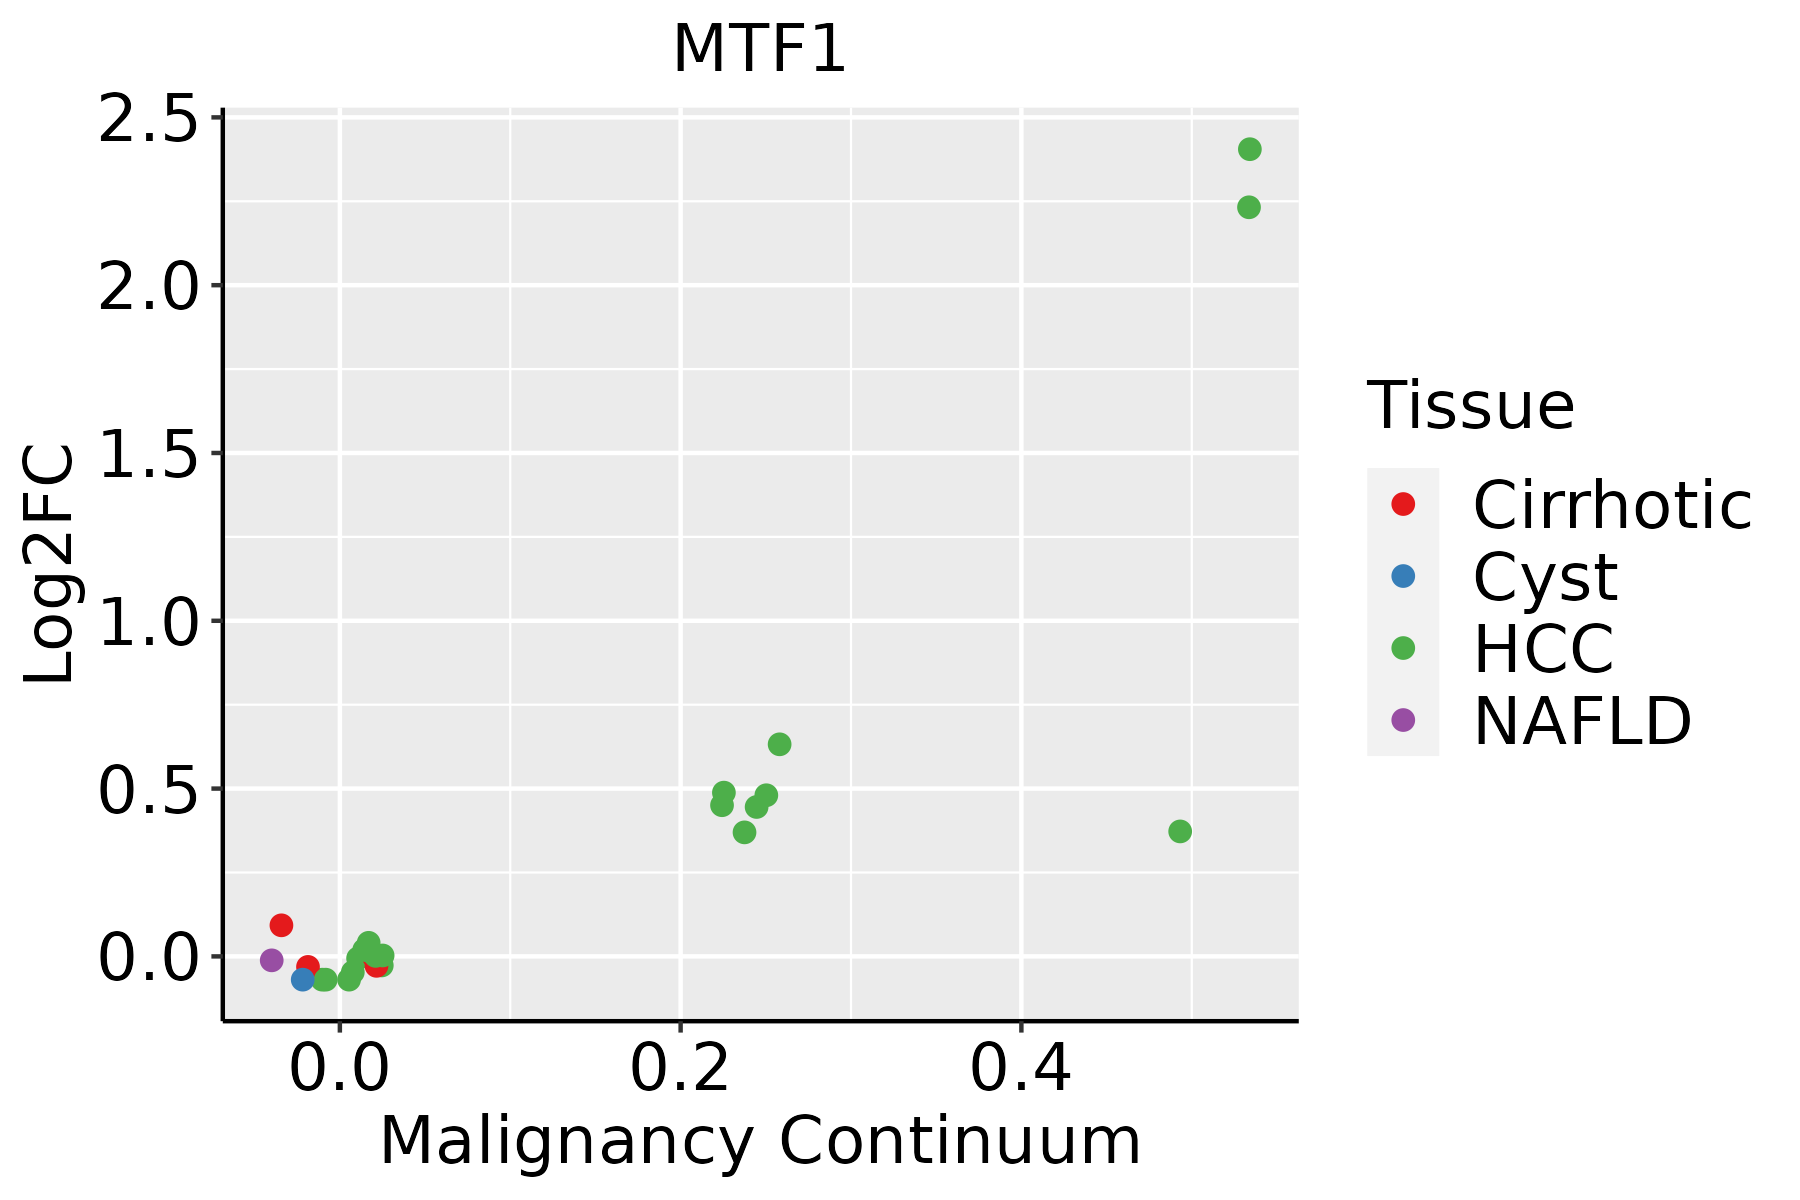 | HCC: Hepatocellular carcinoma |
| NAFLD: Non-alcoholic fatty liver disease |
| ∗log2FC in expression of this searched gene in stem-like cells from each diseased tissue sample relative to stem-like cells in normal samples in each tissue plotted against the malignancy continuum. Samples are colored based on if they are from different disease stage. |
Top |
Malignant transformation related pathway analysis |
| Find out the enriched GO biological processes and KEGG pathways involved in transition from healthy to precancer to cancer |
| Tissue | Disease Stage | Enriched GO biological Processes |
| Colorectum | AD |  |
| Colorectum | SER |  |
| Colorectum | MSS |  |
| Colorectum | MSI-H |  |
| Colorectum | FAP |  |
| ∗Top 15 enriched GO BP terms are showed in the bar plot of each disease state in each tissue. Each row represents a significant GO biological process which is colored according to the -log10(p.adjust). |
| Page: 1 2 3 4 5 6 7 8 9 |
| GO ID | Tissue | Disease Stage | Description | Gene Ratio | Bg Ratio | pvalue | p.adjust | Count |
| GO:000697927 | Esophagus | HGIN | response to oxidative stress | 107/2587 | 446/18723 | 3.91e-09 | 2.76e-07 | 107 |
| GO:004668618 | Esophagus | HGIN | response to cadmium ion | 20/2587 | 68/18723 | 6.35e-04 | 8.73e-03 | 20 |
| GO:0006979111 | Esophagus | ESCC | response to oxidative stress | 303/8552 | 446/18723 | 7.15e-22 | 1.30e-19 | 303 |
| GO:001003827 | Esophagus | ESCC | response to metal ion | 208/8552 | 373/18723 | 5.02e-05 | 3.90e-04 | 208 |
| GO:004668619 | Esophagus | ESCC | response to cadmium ion | 47/8552 | 68/18723 | 7.81e-05 | 5.80e-04 | 47 |
| GO:007124117 | Esophagus | ESCC | cellular response to inorganic substance | 125/8552 | 226/18723 | 2.17e-03 | 9.67e-03 | 125 |
| GO:000697922 | Liver | HCC | response to oxidative stress | 281/7958 | 446/18723 | 9.75e-19 | 1.24e-16 | 281 |
| GO:001003822 | Liver | HCC | response to metal ion | 208/7958 | 373/18723 | 1.35e-07 | 2.56e-06 | 208 |
| GO:004668622 | Liver | HCC | response to cadmium ion | 47/7958 | 68/18723 | 8.13e-06 | 9.56e-05 | 47 |
| GO:007124112 | Liver | HCC | cellular response to inorganic substance | 119/7958 | 226/18723 | 1.26e-03 | 6.92e-03 | 119 |
| GO:007124812 | Liver | HCC | cellular response to metal ion | 101/7958 | 197/18723 | 7.82e-03 | 3.10e-02 | 101 |
| Page: 1 |
| Pathway ID | Tissue | Disease Stage | Description | Gene Ratio | Bg Ratio | pvalue | p.adjust | qvalue | Count |
| Page: 1 |
Top |
Cell-cell communication analysis |
| Identification of potential cell-cell interactions between two cell types and their ligand-receptor pairs for different disease states |
| Ligand | Receptor | LRpair | Pathway | Tissue | Disease Stage |
| Page: 1 |
Top |
Single-cell gene regulatory network inference analysis |
| Find out the significant the regulons (TFs) and the target genes of each regulon across cell types for different disease states |
| TF | Cell Type | Tissue | Disease Stage | Target Gene | RSS | Regulon Activity |
| MTF1 | M2MAC | Cervix | ADJ | TBC1D17,IL1A,ADAM19, etc. | 2.67e-01 |  |
| MTF1 | INMON | Cervix | ADJ | TBC1D17,IL1A,ADAM19, etc. | 1.29e-01 | |
| MTF1 | NEUT | Cervix | ADJ | TBC1D17,IL1A,ADAM19, etc. | 1.13e-01 | |
| MTF1 | BN | Cervix | ADJ | TBC1D17,IL1A,ADAM19, etc. | 2.45e-02 | |
| MTF1 | INMON | Cervix | CC | TBC1D17,IL1A,ADAM19, etc. | 1.87e-01 |  |
| MTF1 | MON | Cervix | CC | TBC1D17,IL1A,ADAM19, etc. | 2.27e-01 | |
| MTF1 | NEUT | Cervix | CC | TBC1D17,IL1A,ADAM19, etc. | 1.39e-01 | |
| MTF1 | INMON | Cervix | Healthy | TBC1D17,IL1A,ADAM19, etc. | 3.25e-02 |  |
| MTF1 | NEUT | Cervix | HSIL_HPV | TBC1D17,IL1A,ADAM19, etc. | 3.53e-01 |  |
| MTF1 | INMON | Cervix | HSIL_HPV | TBC1D17,IL1A,ADAM19, etc. | 1.89e-01 | |
| ∗The dot plots of a searched regulon are shown for all cell subpopulations in each disease state of each tissue based on the regulon specific score inferred using pySCENIC and by calculating the average expression. |
| Page: 1 2 3 4 5 6 |
Top |
Somatic mutation of malignant transformation related genes |
| Annotation of somatic variants for genes involved in malignant transformation |
| Hugo Symbol | Variant Class | Variant Classification | dbSNP RS | HGVSc | HGVSp | HGVSp Short | SWISSPROT | BIOTYPE | SIFT | PolyPhen | Tumor Sample Barcode | Tissue | Histology | Sex | Age | Stage | Therapy Types | Drugs | Outcome |
| MTF1 | SNV | Missense_Mutation | novel | c.1845G>T | p.Gln615His | p.Q615H | Q14872 | protein_coding | deleterious(0) | probably_damaging(0.993) | TCGA-A2-A0ER-01 | Breast | breast invasive carcinoma | Female | <65 | I/II | Chemotherapy | cytoxan | SD |
| MTF1 | SNV | Missense_Mutation | c.841C>T | p.Arg281Cys | p.R281C | Q14872 | protein_coding | deleterious(0) | probably_damaging(0.986) | TCGA-AN-A046-01 | Breast | breast invasive carcinoma | Female | >=65 | I/II | Unknown | Unknown | SD | |
| MTF1 | SNV | Missense_Mutation | rs779682329 | c.752G>A | p.Arg251Gln | p.R251Q | Q14872 | protein_coding | deleterious(0) | probably_damaging(0.998) | TCGA-AN-A046-01 | Breast | breast invasive carcinoma | Female | >=65 | I/II | Unknown | Unknown | SD |
| MTF1 | SNV | Missense_Mutation | novel | c.2060N>T | p.Ser687Leu | p.S687L | Q14872 | protein_coding | tolerated_low_confidence(0.25) | benign(0.015) | TCGA-AR-A2LE-01 | Breast | breast invasive carcinoma | Female | >=65 | I/II | Hormone Therapy | tamoxiphen | PD |
| MTF1 | SNV | Missense_Mutation | c.1070N>T | p.Thr357Ile | p.T357I | Q14872 | protein_coding | deleterious(0.03) | benign(0.024) | TCGA-BH-A0E7-01 | Breast | breast invasive carcinoma | Female | >=65 | I/II | Hormone Therapy | arimidex | SD | |
| MTF1 | SNV | Missense_Mutation | c.245A>T | p.His82Leu | p.H82L | Q14872 | protein_coding | tolerated(0.71) | benign(0) | TCGA-EW-A1P8-01 | Breast | breast invasive carcinoma | Female | <65 | III/IV | Chemotherapy | fluorouracil | PD | |
| MTF1 | SNV | Missense_Mutation | c.193G>A | p.Gly65Arg | p.G65R | Q14872 | protein_coding | deleterious(0.01) | benign(0.03) | TCGA-EW-A6SC-01 | Breast | breast invasive carcinoma | Female | <65 | I/II | Hormone Therapy | aromatase | SD | |
| MTF1 | insertion | Nonsense_Mutation | novel | c.508_509insGGCCTATTCAGTAGCCAATTCTCTTTTTCACGTTTGTATCAGG | p.Phe170TrpfsTer5 | p.F170Wfs*5 | Q14872 | protein_coding | TCGA-A8-A07J-01 | Breast | breast invasive carcinoma | Female | <65 | I/II | Chemotherapy | 5-fluorouracil | CR | ||
| MTF1 | insertion | In_Frame_Ins | novel | c.1845_1846insAAT | p.Gln615_Gln616insAsn | p.Q615_Q616insN | Q14872 | protein_coding | TCGA-A8-A0A9-01 | Breast | breast invasive carcinoma | Female | >=65 | I/II | Hormone Therapy | anastrozole | SD | ||
| MTF1 | insertion | Frame_Shift_Ins | novel | c.1844_1845insATGG | p.Gln616TrpfsTer53 | p.Q616Wfs*53 | Q14872 | protein_coding | TCGA-A8-A0A9-01 | Breast | breast invasive carcinoma | Female | >=65 | I/II | Hormone Therapy | anastrozole | SD |
| Page: 1 2 3 4 5 6 7 8 9 10 11 |
Top |
Related drugs of malignant transformation related genes |
| Identification of chemicals and drugs interact with genes involved in malignant transfromation |
| (DGIdb 4.0) |
| Entrez ID | Symbol | Category | Interaction Types | Drug Claim Name | Drug Name | PMIDs |
| 4520 | MTF1 | TRANSCRIPTION FACTOR | LOR-253 | APTO-253 |
| Page: 1 |

Copyright 2023-Present -The University of Texas Health Science Center at Houston |