
|
|||||
|
 | |
| |
| |
| |
| |
| |
|
Gene: MTERF4 |
Gene summary for MTERF4 |
| Gene information | Species | Human | Gene symbol | MTERF4 | Gene ID | 130916 |
| Gene name | mitochondrial transcription termination factor 4 | |
| Gene Alias | MTERFD2 | |
| Cytomap | 2q37.3 | |
| Gene Type | protein-coding | GO ID | GO:0000959 | UniProtAcc | B4DFP7 |
Top |
Malignant transformation analysis |
| Identification of the aberrant gene expression in precancerous and cancerous lesions by comparing the gene expression of stem-like cells in diseased tissues with normal stem cells |
| Entrez ID | Symbol | Replicates | Species | Organ | Tissue | Adj P-value | Log2FC | Malignancy |
| 130916 | MTERF4 | LZE4T | Human | Esophagus | ESCC | 1.39e-13 | 2.36e-01 | 0.0811 |
| 130916 | MTERF4 | LZE7T | Human | Esophagus | ESCC | 7.10e-05 | 2.88e-01 | 0.0667 |
| 130916 | MTERF4 | LZE8T | Human | Esophagus | ESCC | 1.06e-02 | 1.26e-01 | 0.067 |
| 130916 | MTERF4 | LZE20T | Human | Esophagus | ESCC | 8.52e-04 | 1.34e-01 | 0.0662 |
| 130916 | MTERF4 | LZE22T | Human | Esophagus | ESCC | 7.36e-03 | 2.72e-01 | 0.068 |
| 130916 | MTERF4 | LZE24T | Human | Esophagus | ESCC | 8.89e-14 | 2.85e-01 | 0.0596 |
| 130916 | MTERF4 | LZE21T | Human | Esophagus | ESCC | 2.16e-02 | 1.67e-01 | 0.0655 |
| 130916 | MTERF4 | LZE6T | Human | Esophagus | ESCC | 8.03e-04 | 1.09e-01 | 0.0845 |
| 130916 | MTERF4 | P1T-E | Human | Esophagus | ESCC | 1.30e-08 | 2.50e-01 | 0.0875 |
| 130916 | MTERF4 | P2T-E | Human | Esophagus | ESCC | 7.98e-20 | 3.32e-01 | 0.1177 |
| 130916 | MTERF4 | P4T-E | Human | Esophagus | ESCC | 3.42e-12 | 3.06e-01 | 0.1323 |
| 130916 | MTERF4 | P5T-E | Human | Esophagus | ESCC | 6.24e-19 | 3.72e-01 | 0.1327 |
| 130916 | MTERF4 | P8T-E | Human | Esophagus | ESCC | 1.38e-18 | 2.46e-01 | 0.0889 |
| 130916 | MTERF4 | P9T-E | Human | Esophagus | ESCC | 4.97e-08 | 2.08e-01 | 0.1131 |
| 130916 | MTERF4 | P10T-E | Human | Esophagus | ESCC | 2.40e-20 | 4.62e-01 | 0.116 |
| 130916 | MTERF4 | P11T-E | Human | Esophagus | ESCC | 6.97e-15 | 3.26e-01 | 0.1426 |
| 130916 | MTERF4 | P12T-E | Human | Esophagus | ESCC | 1.60e-31 | 4.86e-01 | 0.1122 |
| 130916 | MTERF4 | P15T-E | Human | Esophagus | ESCC | 2.16e-20 | 4.67e-01 | 0.1149 |
| 130916 | MTERF4 | P16T-E | Human | Esophagus | ESCC | 2.29e-29 | 3.97e-01 | 0.1153 |
| 130916 | MTERF4 | P17T-E | Human | Esophagus | ESCC | 1.90e-02 | 7.76e-02 | 0.1278 |
| Page: 1 2 3 4 5 6 |
| Tissue | Expression Dynamics | Abbreviation |
| Esophagus | 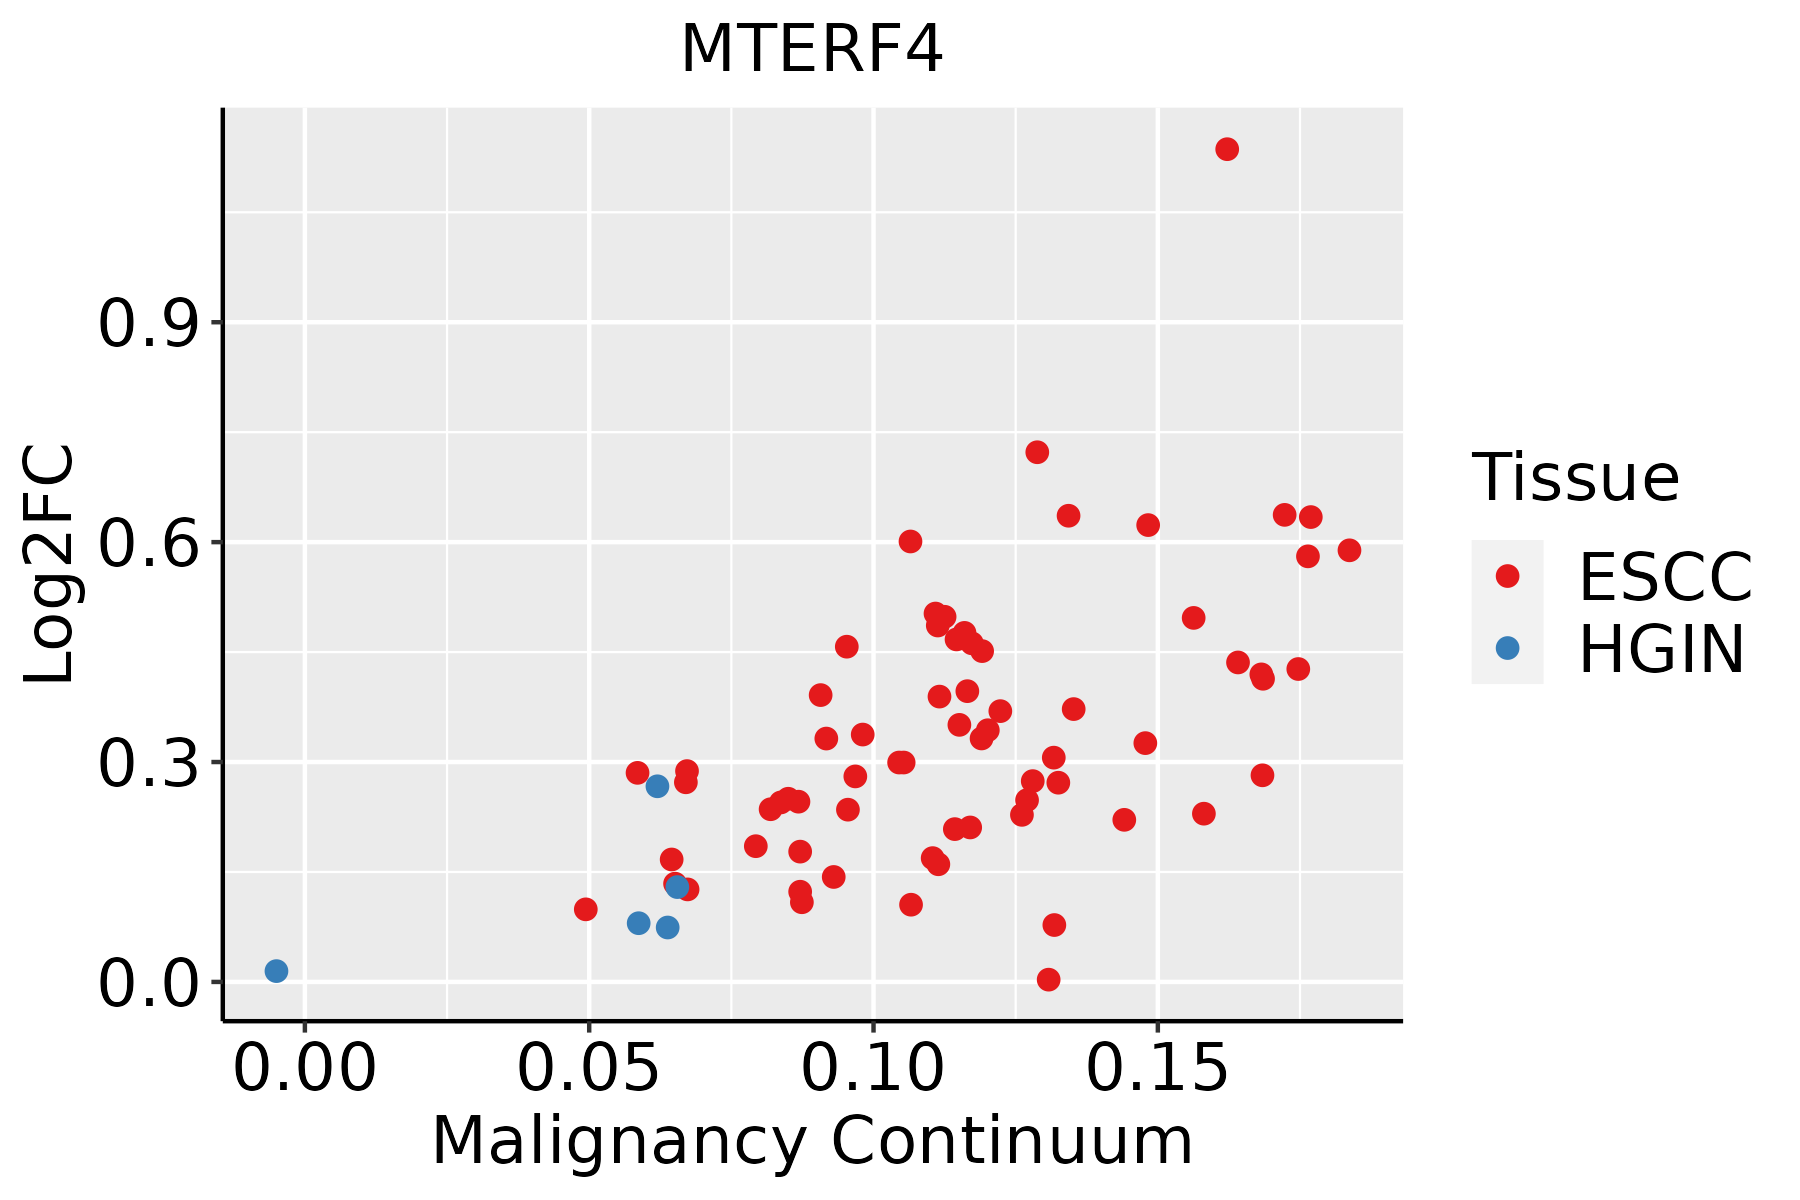 | ESCC: Esophageal squamous cell carcinoma |
| HGIN: High-grade intraepithelial neoplasias | ||
| LGIN: Low-grade intraepithelial neoplasias | ||
| Liver | 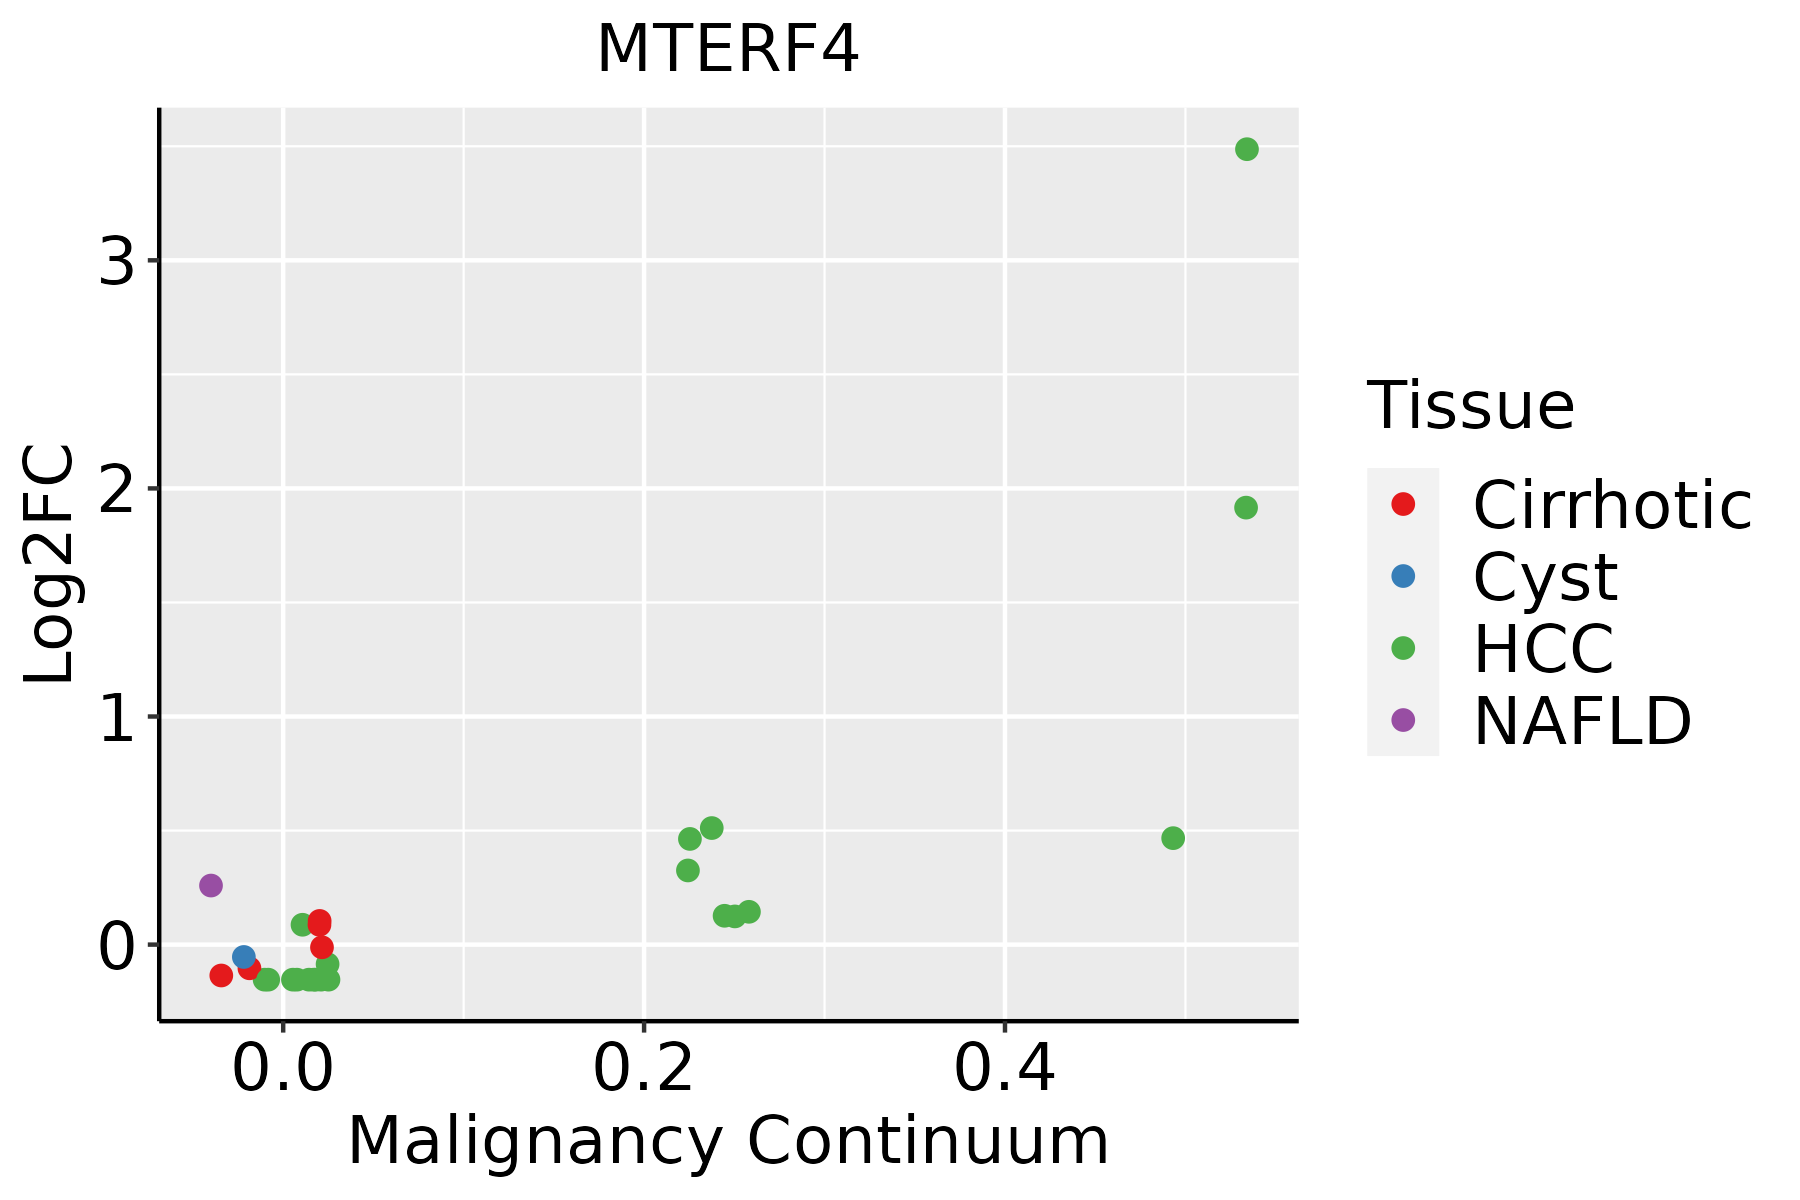 | HCC: Hepatocellular carcinoma |
| NAFLD: Non-alcoholic fatty liver disease | ||
| Oral Cavity | 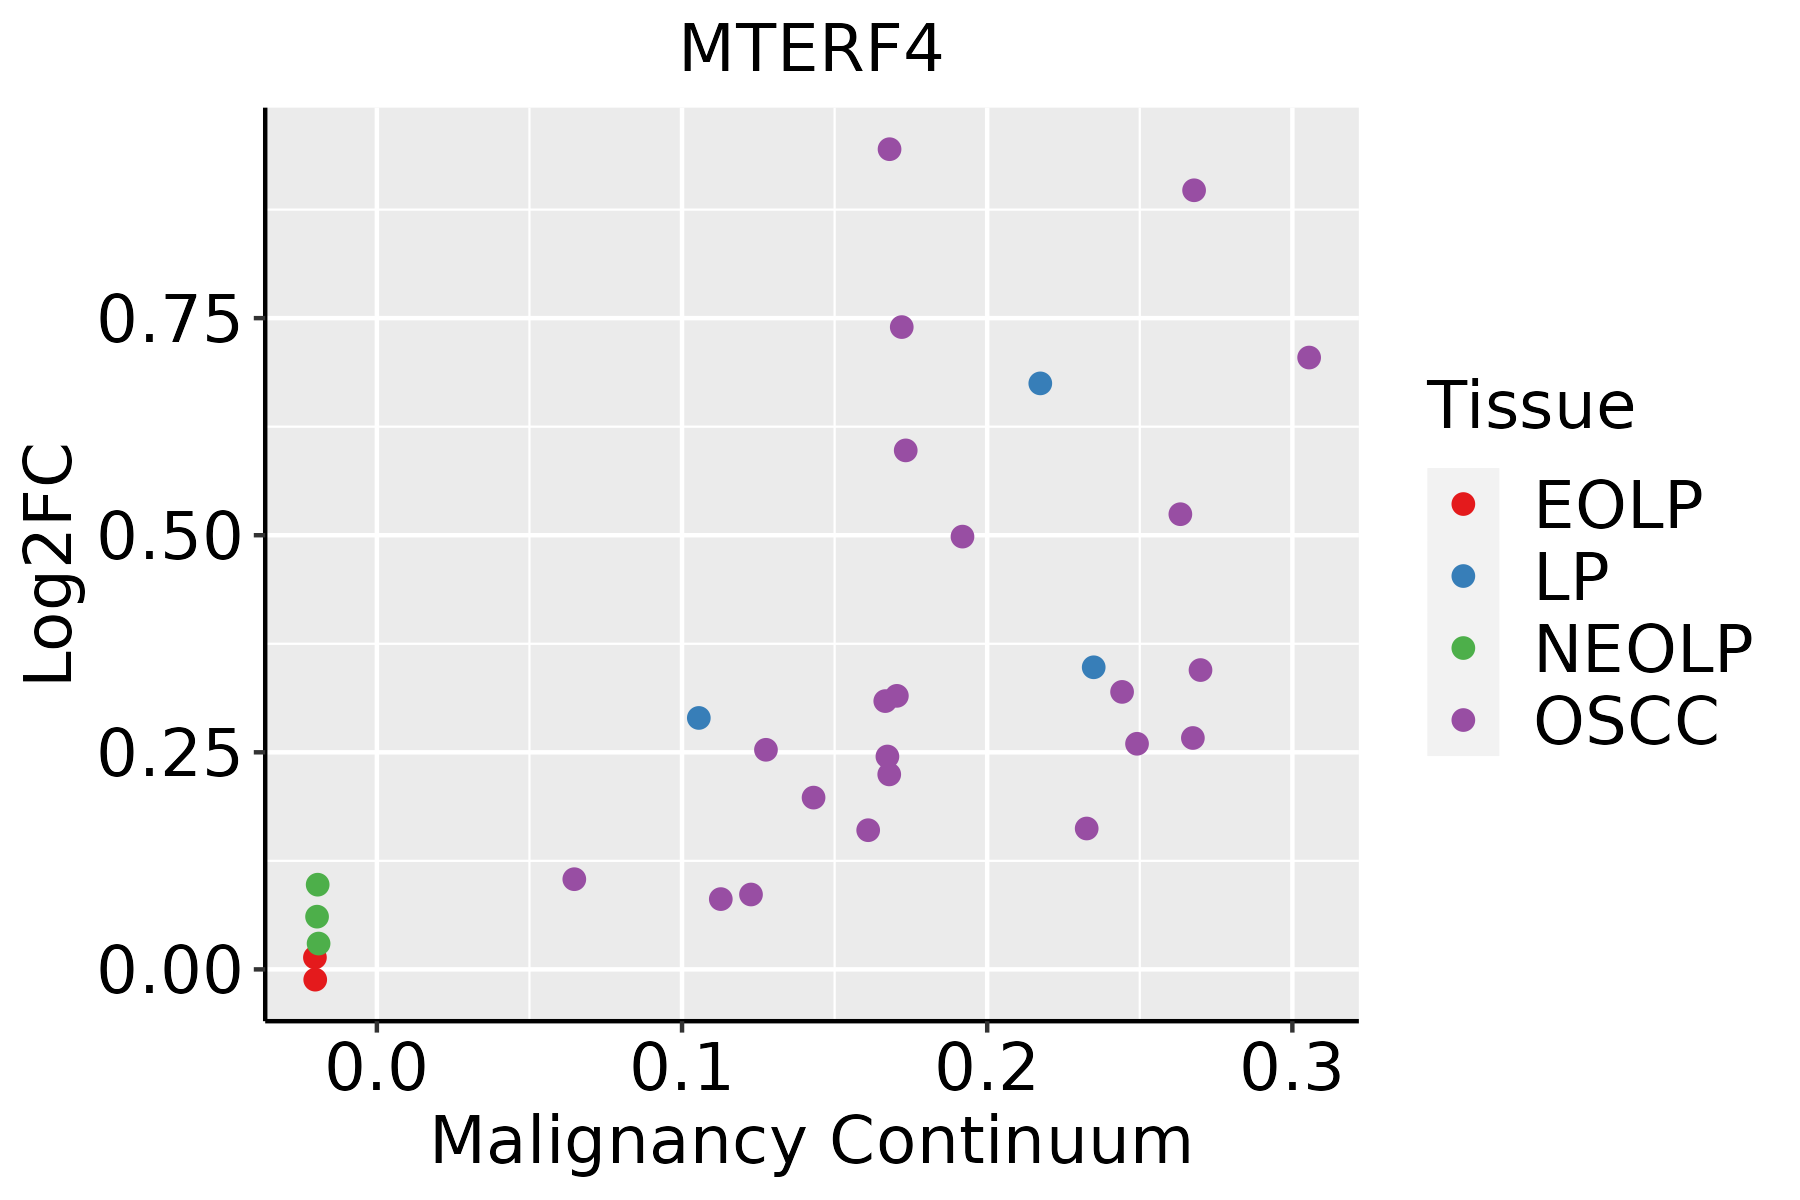 | EOLP: Erosive Oral lichen planus |
| LP: leukoplakia | ||
| NEOLP: Non-erosive oral lichen planus | ||
| OSCC: Oral squamous cell carcinoma | ||
| Prostate | 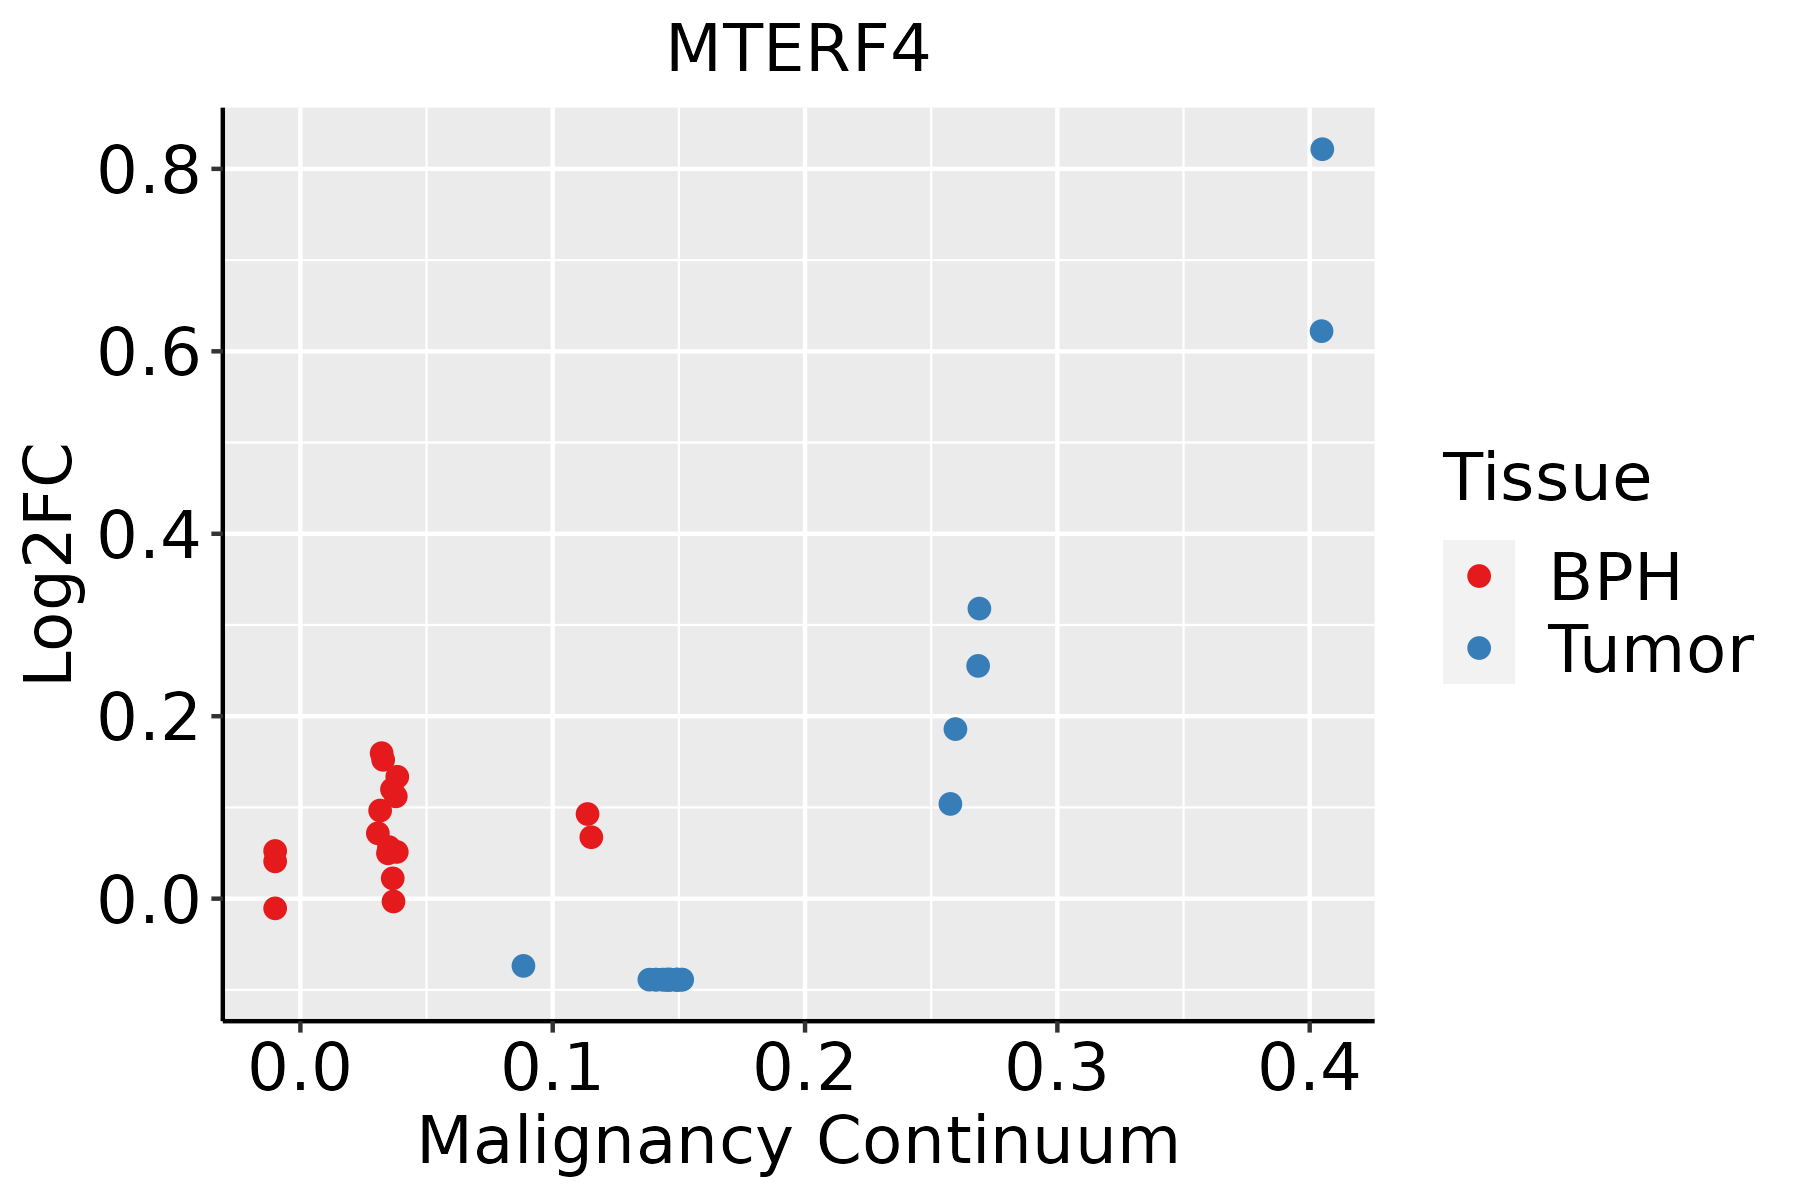 | BPH: Benign Prostatic Hyperplasia |
| Thyroid | 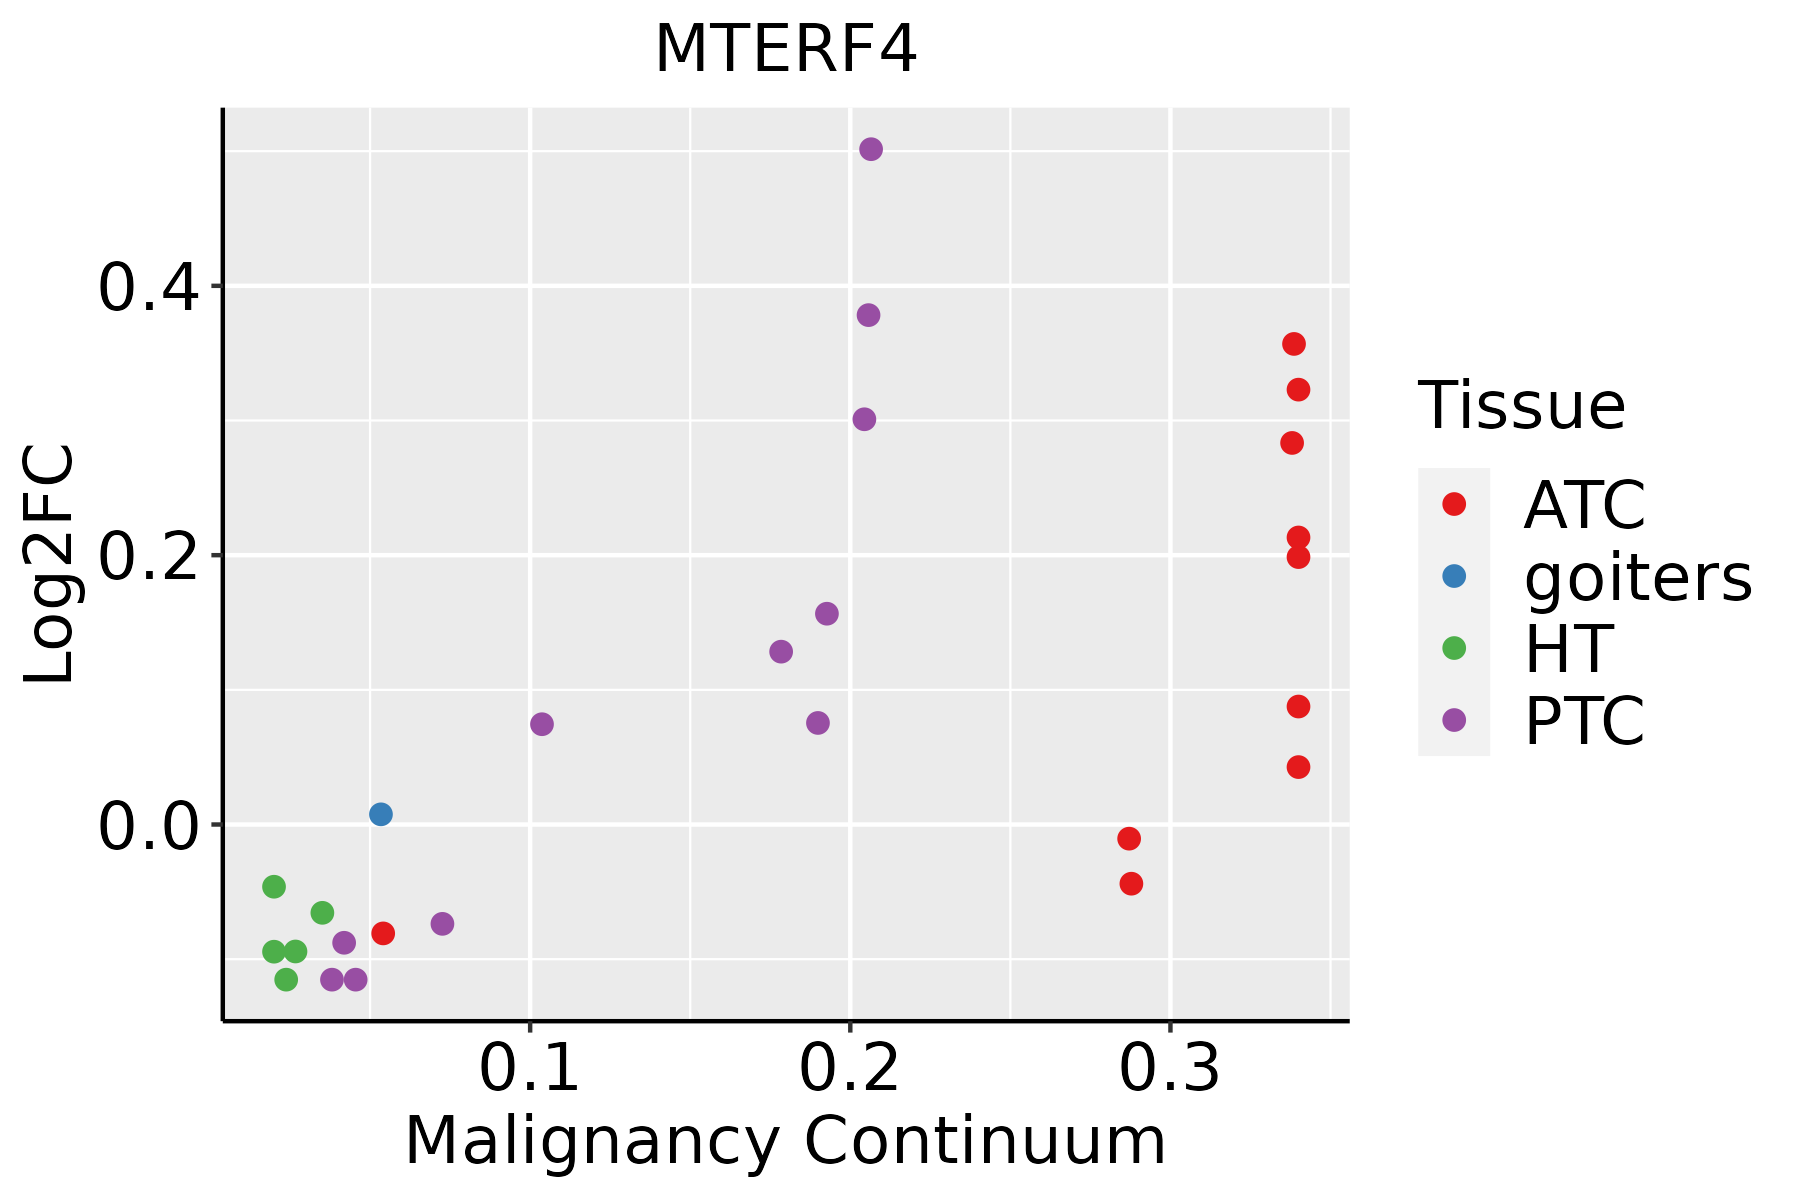 | ATC: Anaplastic thyroid cancer |
| HT: Hashimoto's thyroiditis | ||
| PTC: Papillary thyroid cancer |
| ∗log2FC in expression of this searched gene in stem-like cells from each diseased tissue sample relative to stem-like cells in normal samples in each tissue plotted against the malignancy continuum. Samples are colored based on if they are from different disease stage. |
Top |
Malignant transformation related pathway analysis |
| Find out the enriched GO biological processes and KEGG pathways involved in transition from healthy to precancer to cancer |
| Tissue | Disease Stage | Enriched GO biological Processes |
| Colorectum | AD |  |
| Colorectum | SER |  |
| Colorectum | MSS |  |
| Colorectum | MSI-H |  |
| Colorectum | FAP |  |
| ∗Top 15 enriched GO BP terms are showed in the bar plot of each disease state in each tissue. Each row represents a significant GO biological process which is colored according to the -log10(p.adjust). |
| Page: 1 2 3 4 5 6 7 8 9 |
| GO ID | Tissue | Disease Stage | Description | Gene Ratio | Bg Ratio | pvalue | p.adjust | Count |
| GO:0022613111 | Esophagus | ESCC | ribonucleoprotein complex biogenesis | 365/8552 | 463/18723 | 1.74e-49 | 1.11e-45 | 365 |
| GO:0042254111 | Esophagus | ESCC | ribosome biogenesis | 252/8552 | 299/18723 | 3.27e-44 | 1.04e-40 | 252 |
| GO:003447015 | Esophagus | ESCC | ncRNA processing | 300/8552 | 395/18723 | 3.09e-35 | 3.26e-32 | 300 |
| GO:0016072110 | Esophagus | ESCC | rRNA metabolic process | 197/8552 | 236/18723 | 1.31e-33 | 1.18e-30 | 197 |
| GO:0006364110 | Esophagus | ESCC | rRNA processing | 189/8552 | 225/18723 | 4.88e-33 | 3.87e-30 | 189 |
| GO:0072594110 | Esophagus | ESCC | establishment of protein localization to organelle | 311/8552 | 422/18723 | 3.02e-32 | 2.13e-29 | 311 |
| GO:003466012 | Esophagus | ESCC | ncRNA metabolic process | 346/8552 | 485/18723 | 4.35e-31 | 2.51e-28 | 346 |
| GO:0006605111 | Esophagus | ESCC | protein targeting | 229/8552 | 314/18723 | 4.93e-23 | 1.01e-20 | 229 |
| GO:0006839110 | Esophagus | ESCC | mitochondrial transport | 187/8552 | 254/18723 | 8.35e-20 | 9.81e-18 | 187 |
| GO:014005313 | Esophagus | ESCC | mitochondrial gene expression | 93/8552 | 108/18723 | 1.96e-18 | 2.03e-16 | 93 |
| GO:0072655110 | Esophagus | ESCC | establishment of protein localization to mitochondrion | 97/8552 | 120/18723 | 2.17e-15 | 1.33e-13 | 97 |
| GO:0070585110 | Esophagus | ESCC | protein localization to mitochondrion | 100/8552 | 125/18723 | 2.96e-15 | 1.77e-13 | 100 |
| GO:0006626110 | Esophagus | ESCC | protein targeting to mitochondrion | 81/8552 | 100/18723 | 3.60e-13 | 1.67e-11 | 81 |
| GO:0042255111 | Esophagus | ESCC | ribosome assembly | 50/8552 | 61/18723 | 5.66e-09 | 1.17e-07 | 50 |
| GO:00009592 | Esophagus | ESCC | mitochondrial RNA metabolic process | 39/8552 | 49/18723 | 1.20e-06 | 1.49e-05 | 39 |
| GO:002261322 | Liver | HCC | ribonucleoprotein complex biogenesis | 355/7958 | 463/18723 | 7.76e-52 | 4.92e-48 | 355 |
| GO:004225422 | Liver | HCC | ribosome biogenesis | 246/7958 | 299/18723 | 4.99e-46 | 1.58e-42 | 246 |
| GO:00344702 | Liver | HCC | ncRNA processing | 293/7958 | 395/18723 | 4.26e-38 | 6.76e-35 | 293 |
| GO:001607212 | Liver | HCC | rRNA metabolic process | 193/7958 | 236/18723 | 1.26e-35 | 1.14e-32 | 193 |
| GO:000636421 | Liver | HCC | rRNA processing | 185/7958 | 225/18723 | 8.14e-35 | 6.45e-32 | 185 |
| Page: 1 2 3 4 5 6 |
| Pathway ID | Tissue | Disease Stage | Description | Gene Ratio | Bg Ratio | pvalue | p.adjust | qvalue | Count |
| Page: 1 |
Top |
Cell-cell communication analysis |
| Identification of potential cell-cell interactions between two cell types and their ligand-receptor pairs for different disease states |
| Ligand | Receptor | LRpair | Pathway | Tissue | Disease Stage |
| Page: 1 |
Top |
Single-cell gene regulatory network inference analysis |
| Find out the significant the regulons (TFs) and the target genes of each regulon across cell types for different disease states |
| TF | Cell Type | Tissue | Disease Stage | Target Gene | RSS | Regulon Activity |
| ∗The dot plots of a searched regulon are shown for all cell subpopulations in each disease state of each tissue based on the regulon specific score inferred using pySCENIC and by calculating the average expression. |
| Page: 1 |
Top |
Somatic mutation of malignant transformation related genes |
| Annotation of somatic variants for genes involved in malignant transformation |
| Hugo Symbol | Variant Class | Variant Classification | dbSNP RS | HGVSc | HGVSp | HGVSp Short | SWISSPROT | BIOTYPE | SIFT | PolyPhen | Tumor Sample Barcode | Tissue | Histology | Sex | Age | Stage | Therapy Types | Drugs | Outcome |
| MTERF4 | SNV | Missense_Mutation | rs770916374 | c.16N>T | p.Arg6Cys | p.R6C | Q7Z6M4 | protein_coding | deleterious_low_confidence(0) | probably_damaging(0.991) | TCGA-A2-A0ER-01 | Breast | breast invasive carcinoma | Female | <65 | I/II | Chemotherapy | cytoxan | SD |
| MTERF4 | SNV | Missense_Mutation | novel | c.683N>A | p.Gly228Asp | p.G228D | Q7Z6M4 | protein_coding | tolerated(0.62) | benign(0.011) | TCGA-A7-A0DB-01 | Breast | breast invasive carcinoma | Female | <65 | I/II | Hormone Therapy | arimidex | SD |
| MTERF4 | SNV | Missense_Mutation | c.344N>G | p.Val115Gly | p.V115G | Q7Z6M4 | protein_coding | tolerated(0.13) | benign(0.16) | TCGA-B6-A1KN-01 | Breast | breast invasive carcinoma | Female | <65 | III/IV | Unknown | Unknown | SD | |
| MTERF4 | insertion | Frame_Shift_Ins | novel | c.562_563insGGAATCACTATGTATTTCCTTCT | p.Thr188ArgfsTer70 | p.T188Rfs*70 | Q7Z6M4 | protein_coding | TCGA-BH-A0BV-01 | Breast | breast invasive carcinoma | Female | >=65 | I/II | Chemotherapy | doxorubicin | SD | ||
| MTERF4 | SNV | Missense_Mutation | novel | c.757T>C | p.Tyr253His | p.Y253H | Q7Z6M4 | protein_coding | deleterious(0) | possibly_damaging(0.766) | TCGA-AA-3949-01 | Colorectum | colon adenocarcinoma | Female | >=65 | III/IV | Unknown | Unknown | SD |
| MTERF4 | SNV | Missense_Mutation | c.438G>T | p.Lys146Asn | p.K146N | Q7Z6M4 | protein_coding | deleterious(0.04) | benign(0.42) | TCGA-AA-3977-01 | Colorectum | colon adenocarcinoma | Male | >=65 | I/II | Unknown | Unknown | SD | |
| MTERF4 | SNV | Missense_Mutation | novel | c.633N>C | p.Gln211His | p.Q211H | Q7Z6M4 | protein_coding | deleterious(0.03) | benign(0.329) | TCGA-AJ-A5DW-01 | Endometrium | uterine corpus endometrioid carcinoma | Female | <65 | I/II | Unknown | Unknown | SD |
| MTERF4 | SNV | Missense_Mutation | rs377505682 | c.386C>T | p.Ser129Leu | p.S129L | Q7Z6M4 | protein_coding | deleterious(0) | probably_damaging(0.999) | TCGA-AP-A059-01 | Endometrium | uterine corpus endometrioid carcinoma | Female | >=65 | I/II | Unknown | Unknown | SD |
| MTERF4 | SNV | Missense_Mutation | rs763068285 | c.104C>T | p.Thr35Met | p.T35M | Q7Z6M4 | protein_coding | tolerated_low_confidence(0.28) | benign(0.003) | TCGA-B5-A0JZ-01 | Endometrium | uterine corpus endometrioid carcinoma | Female | <65 | III/IV | Chemotherapy | carboplatin | PD |
| MTERF4 | SNV | Missense_Mutation | c.586N>A | p.Asp196Asn | p.D196N | Q7Z6M4 | protein_coding | tolerated(0.55) | benign(0.005) | TCGA-B5-A11E-01 | Endometrium | uterine corpus endometrioid carcinoma | Female | <65 | I/II | Unknown | Unknown | SD |
| Page: 1 2 3 |
Top |
Related drugs of malignant transformation related genes |
| Identification of chemicals and drugs interact with genes involved in malignant transfromation |
| (DGIdb 4.0) |
| Entrez ID | Symbol | Category | Interaction Types | Drug Claim Name | Drug Name | PMIDs |
| Page: 1 |

Copyright 2023-Present -The University of Texas Health Science Center at Houston |