| Tissue | Expression Dynamics | Abbreviation |
| Breast |  | IDC: Invasive ductal carcinoma |
| DCIS: Ductal carcinoma in situ |
| Precancer(BRCA1-mut): Precancerous lesion from BRCA1 mutation carriers |
| Cervix | 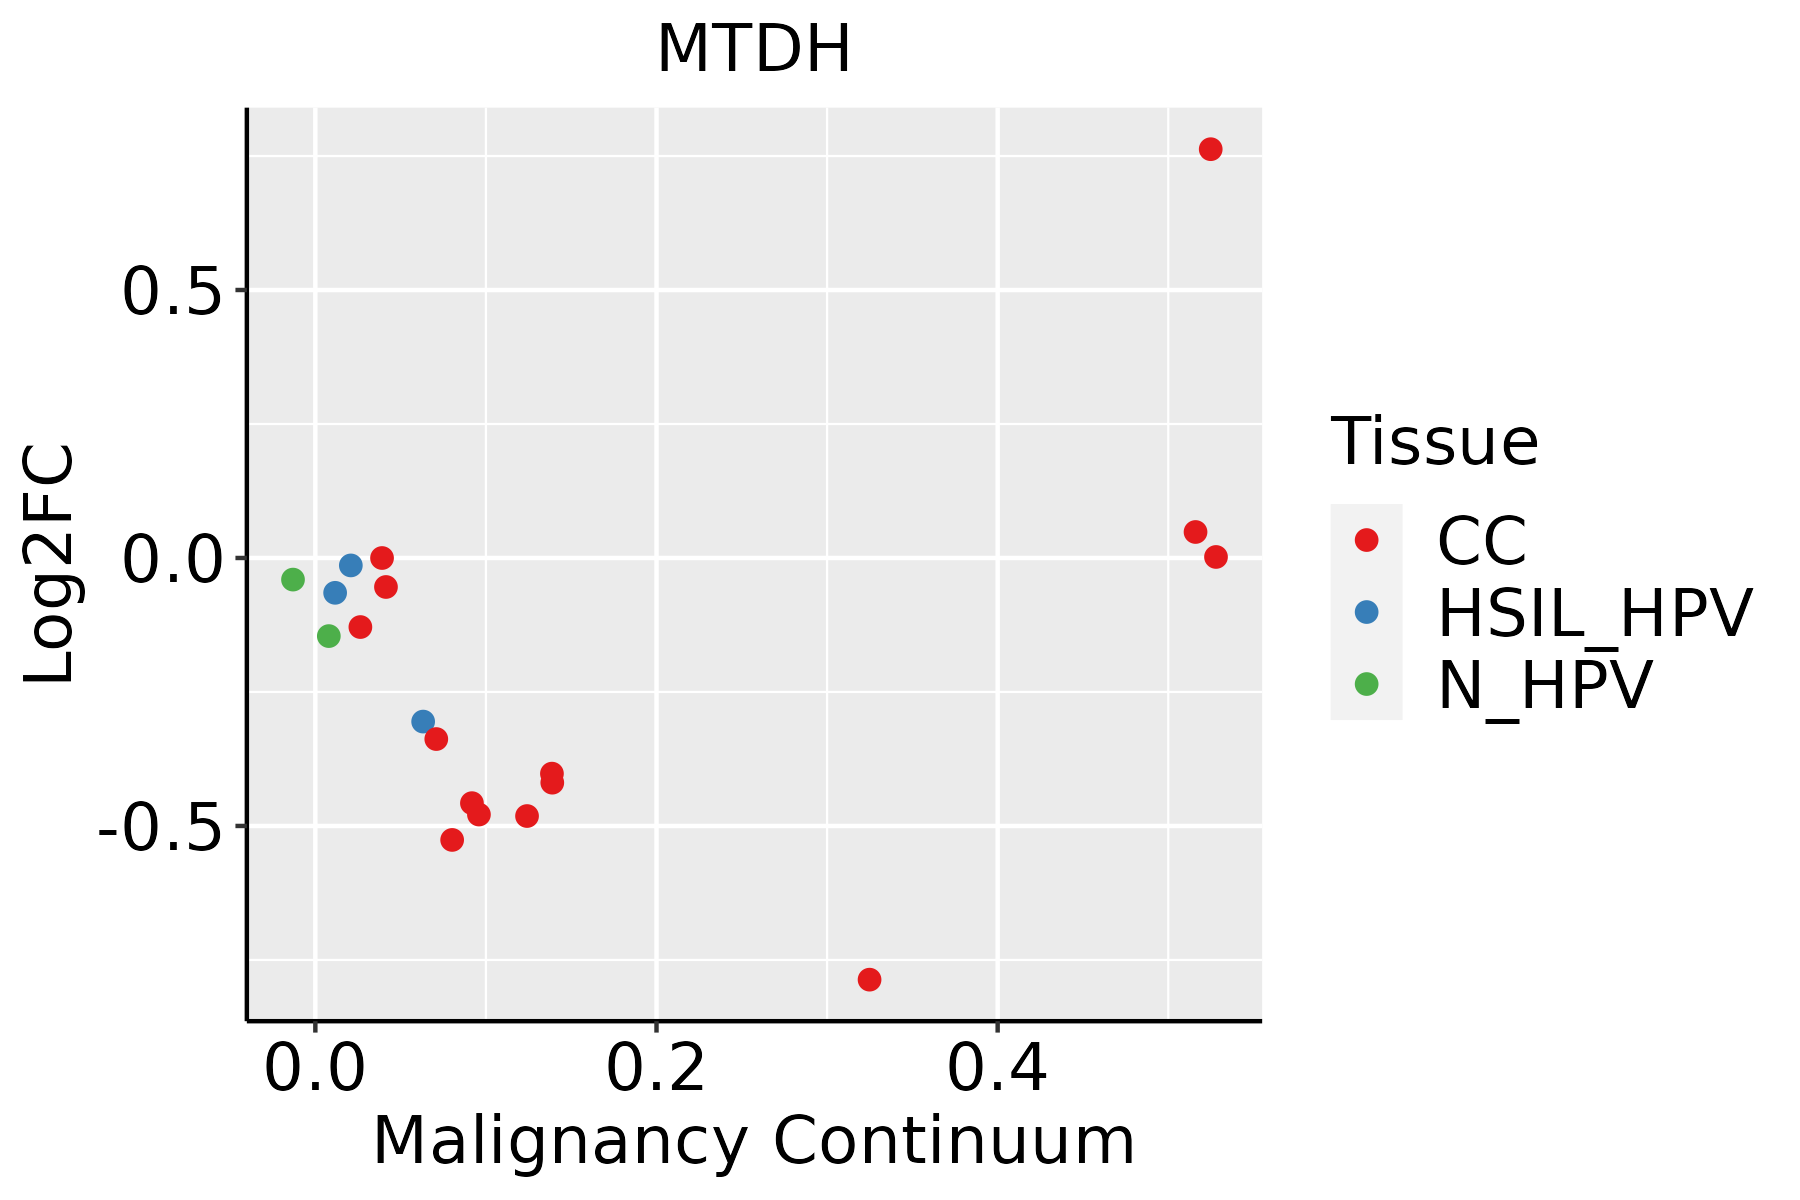 | CC: Cervix cancer |
| HSIL_HPV: HPV-infected high-grade squamous intraepithelial lesions |
| N_HPV: HPV-infected normal cervix |
| Colorectum (GSE201348) |  | FAP: Familial adenomatous polyposis |
| CRC: Colorectal cancer |
| Colorectum (HTA11) |  | AD: Adenomas |
| SER: Sessile serrated lesions |
| MSI-H: Microsatellite-high colorectal cancer |
| MSS: Microsatellite stable colorectal cancer |
| Endometrium | 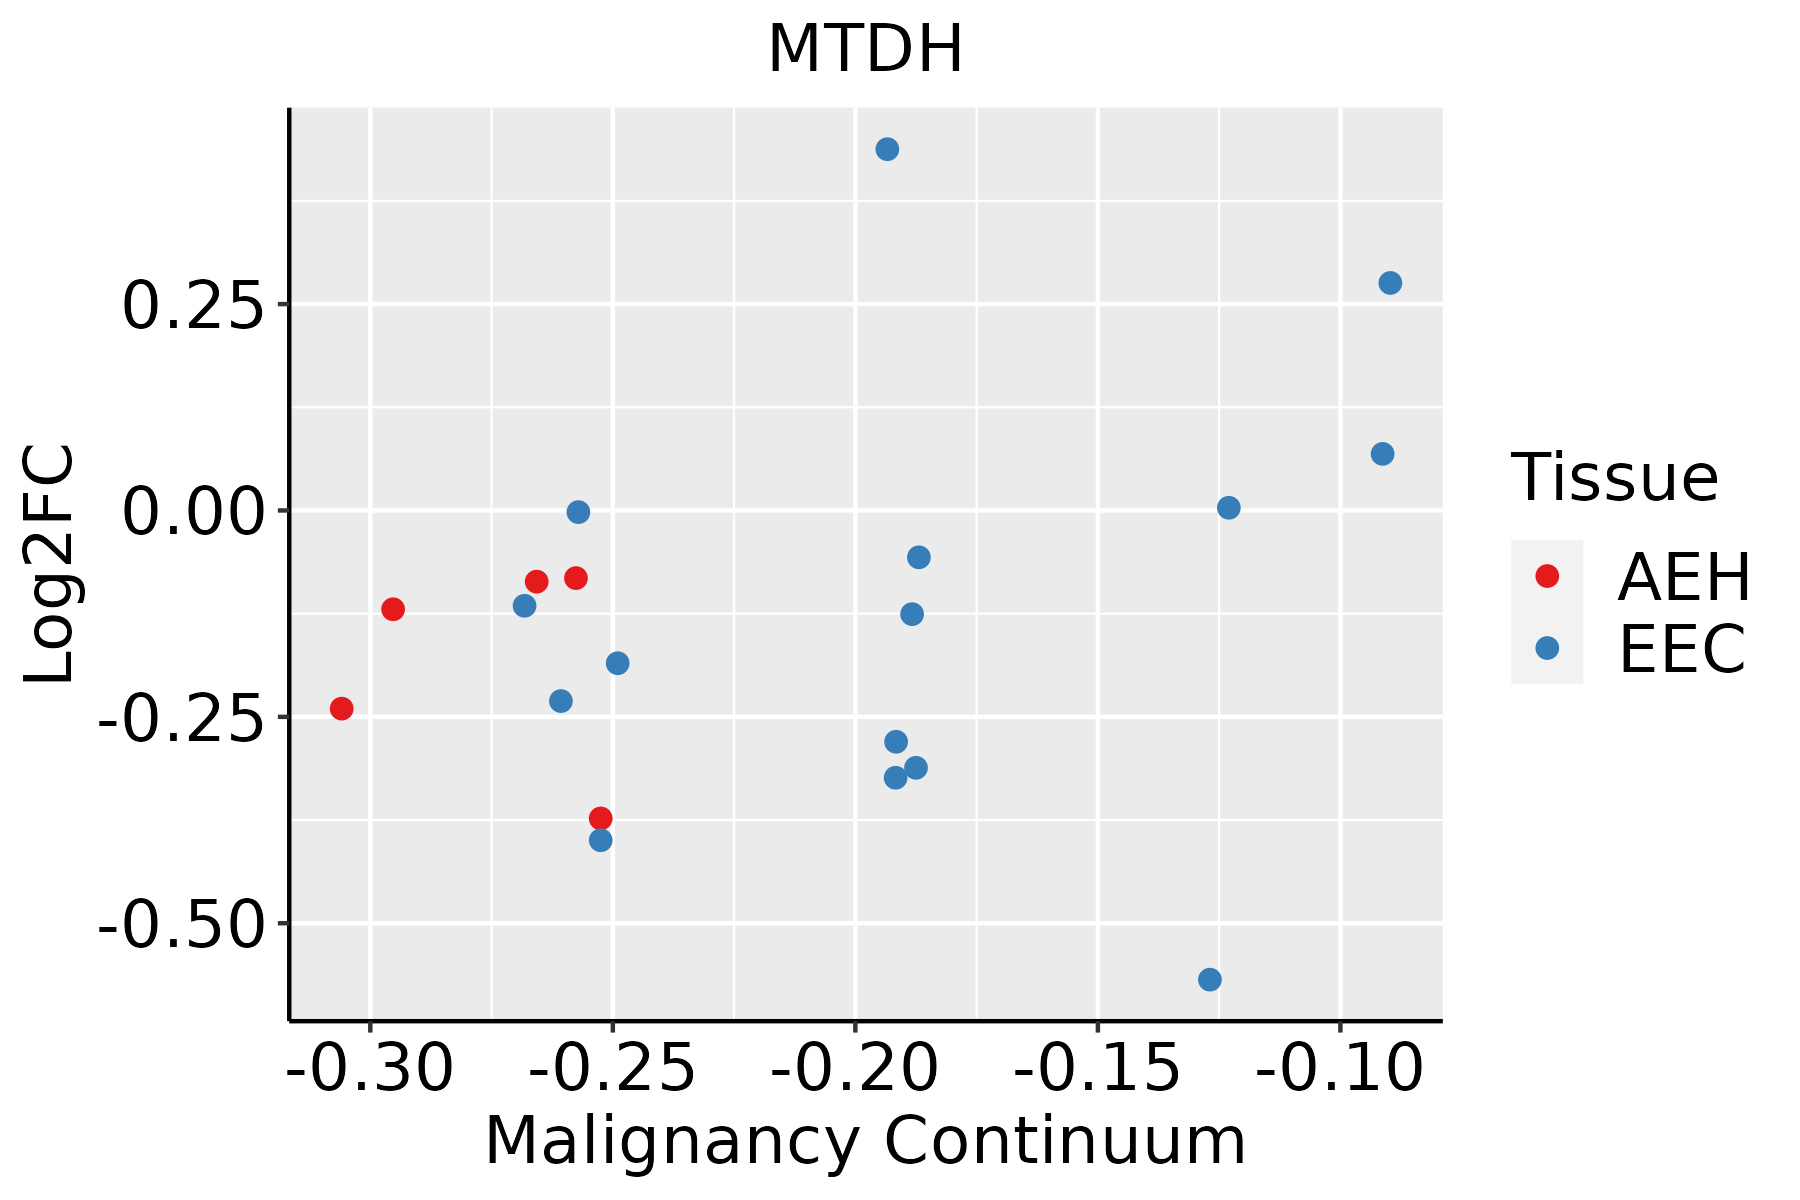 | AEH: Atypical endometrial hyperplasia |
| EEC: Endometrioid Cancer |
| Esophagus | 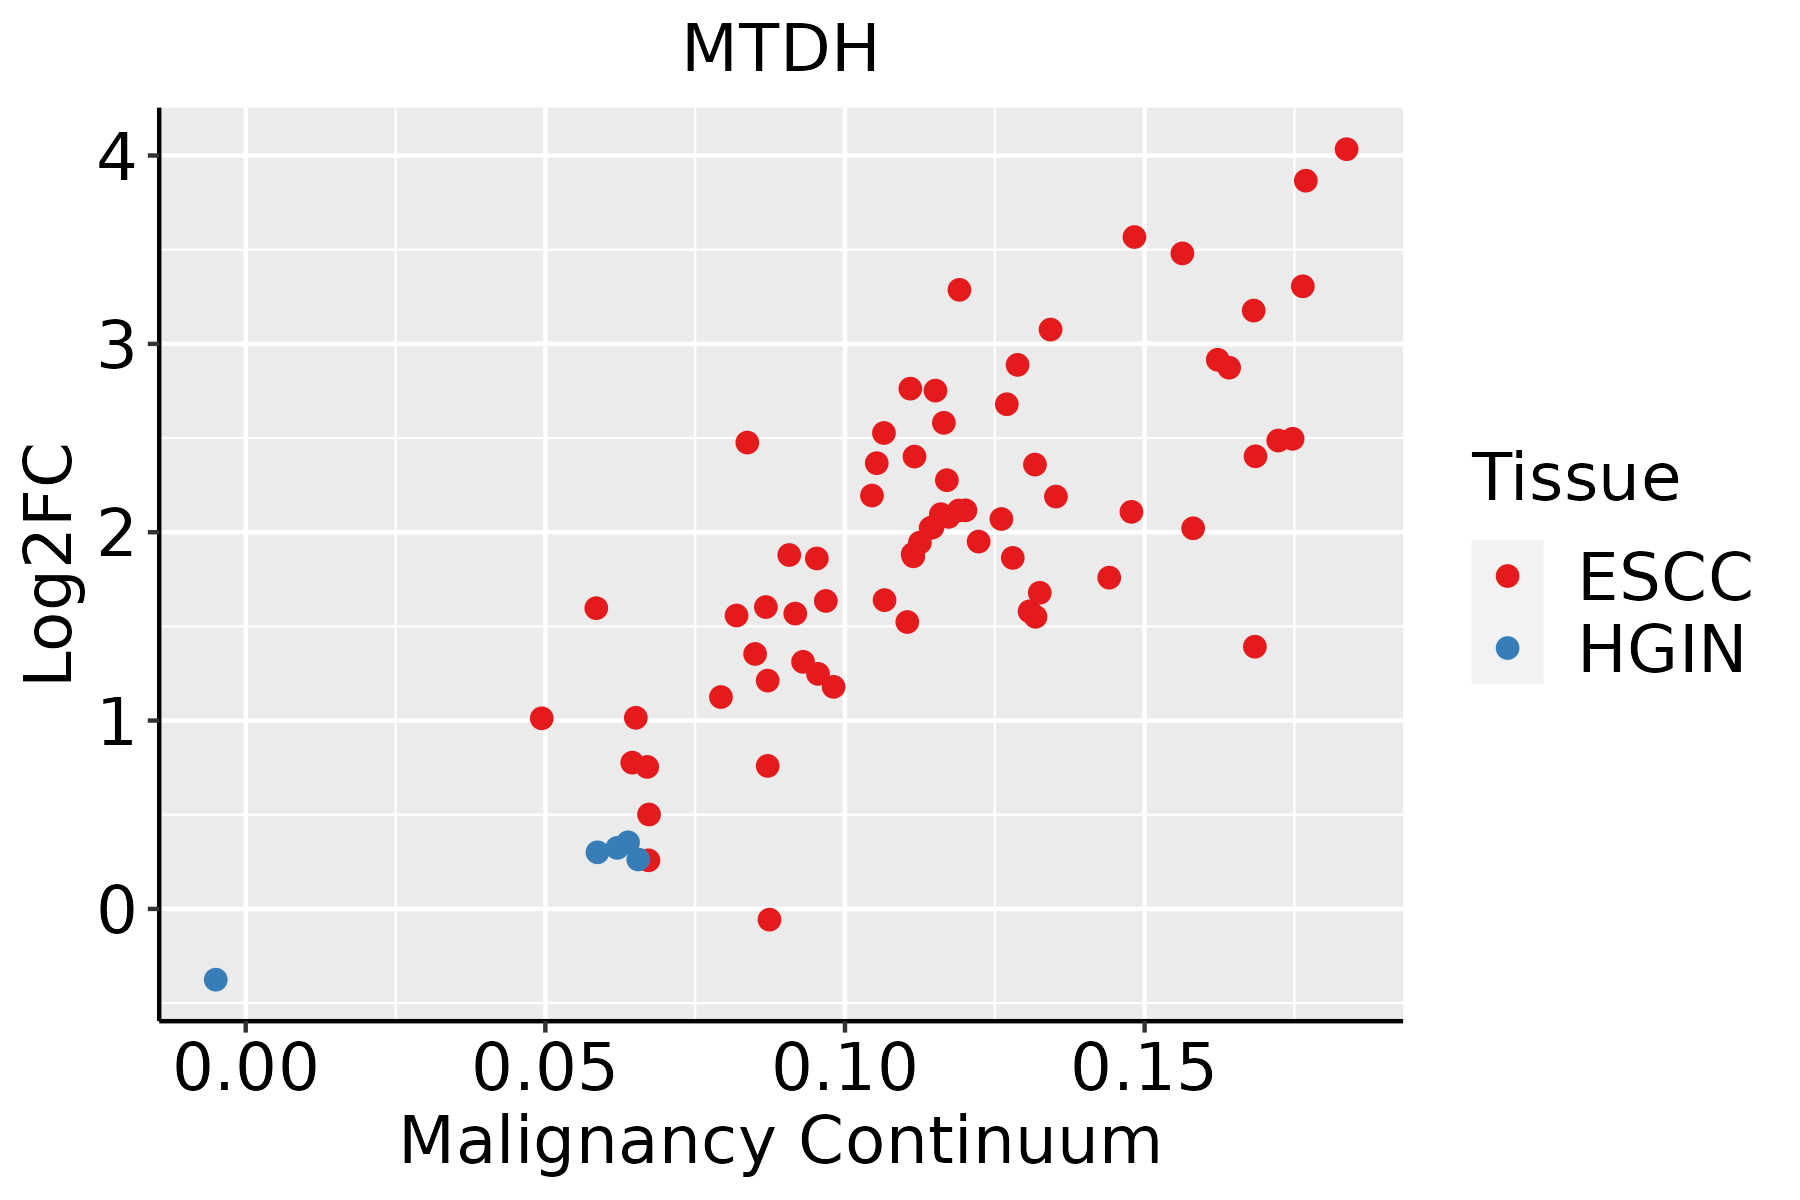 | ESCC: Esophageal squamous cell carcinoma |
| HGIN: High-grade intraepithelial neoplasias |
| LGIN: Low-grade intraepithelial neoplasias |
| GC | 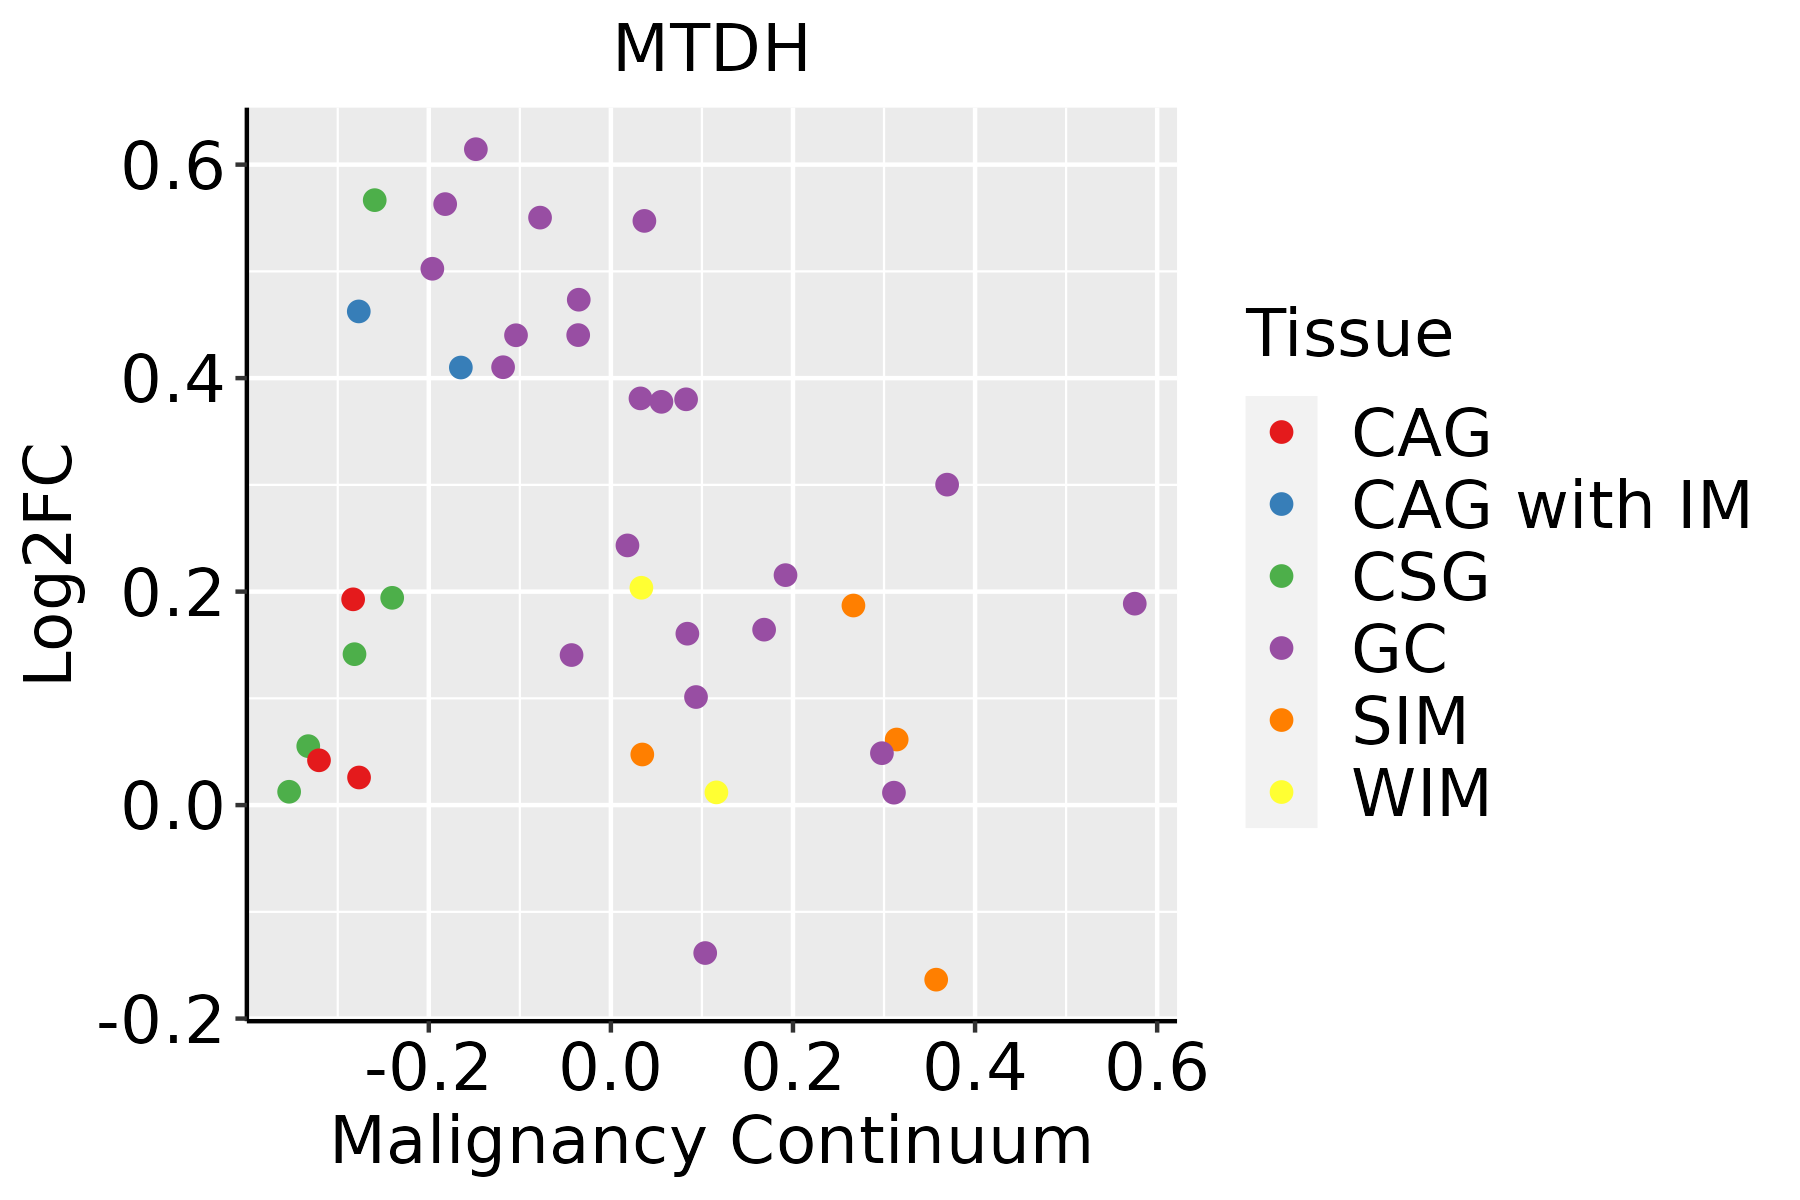 | CAG: Chronic atrophic gastritis |
| CAG with IM: Chronic atrophic gastritis with intestinal metaplasia |
| CSG: Chronic superficial gastritis |
| GC: Gastric cancer |
| SIM: Severe intestinal metaplasia |
| WIM: Wild intestinal metaplasia |
| Liver | 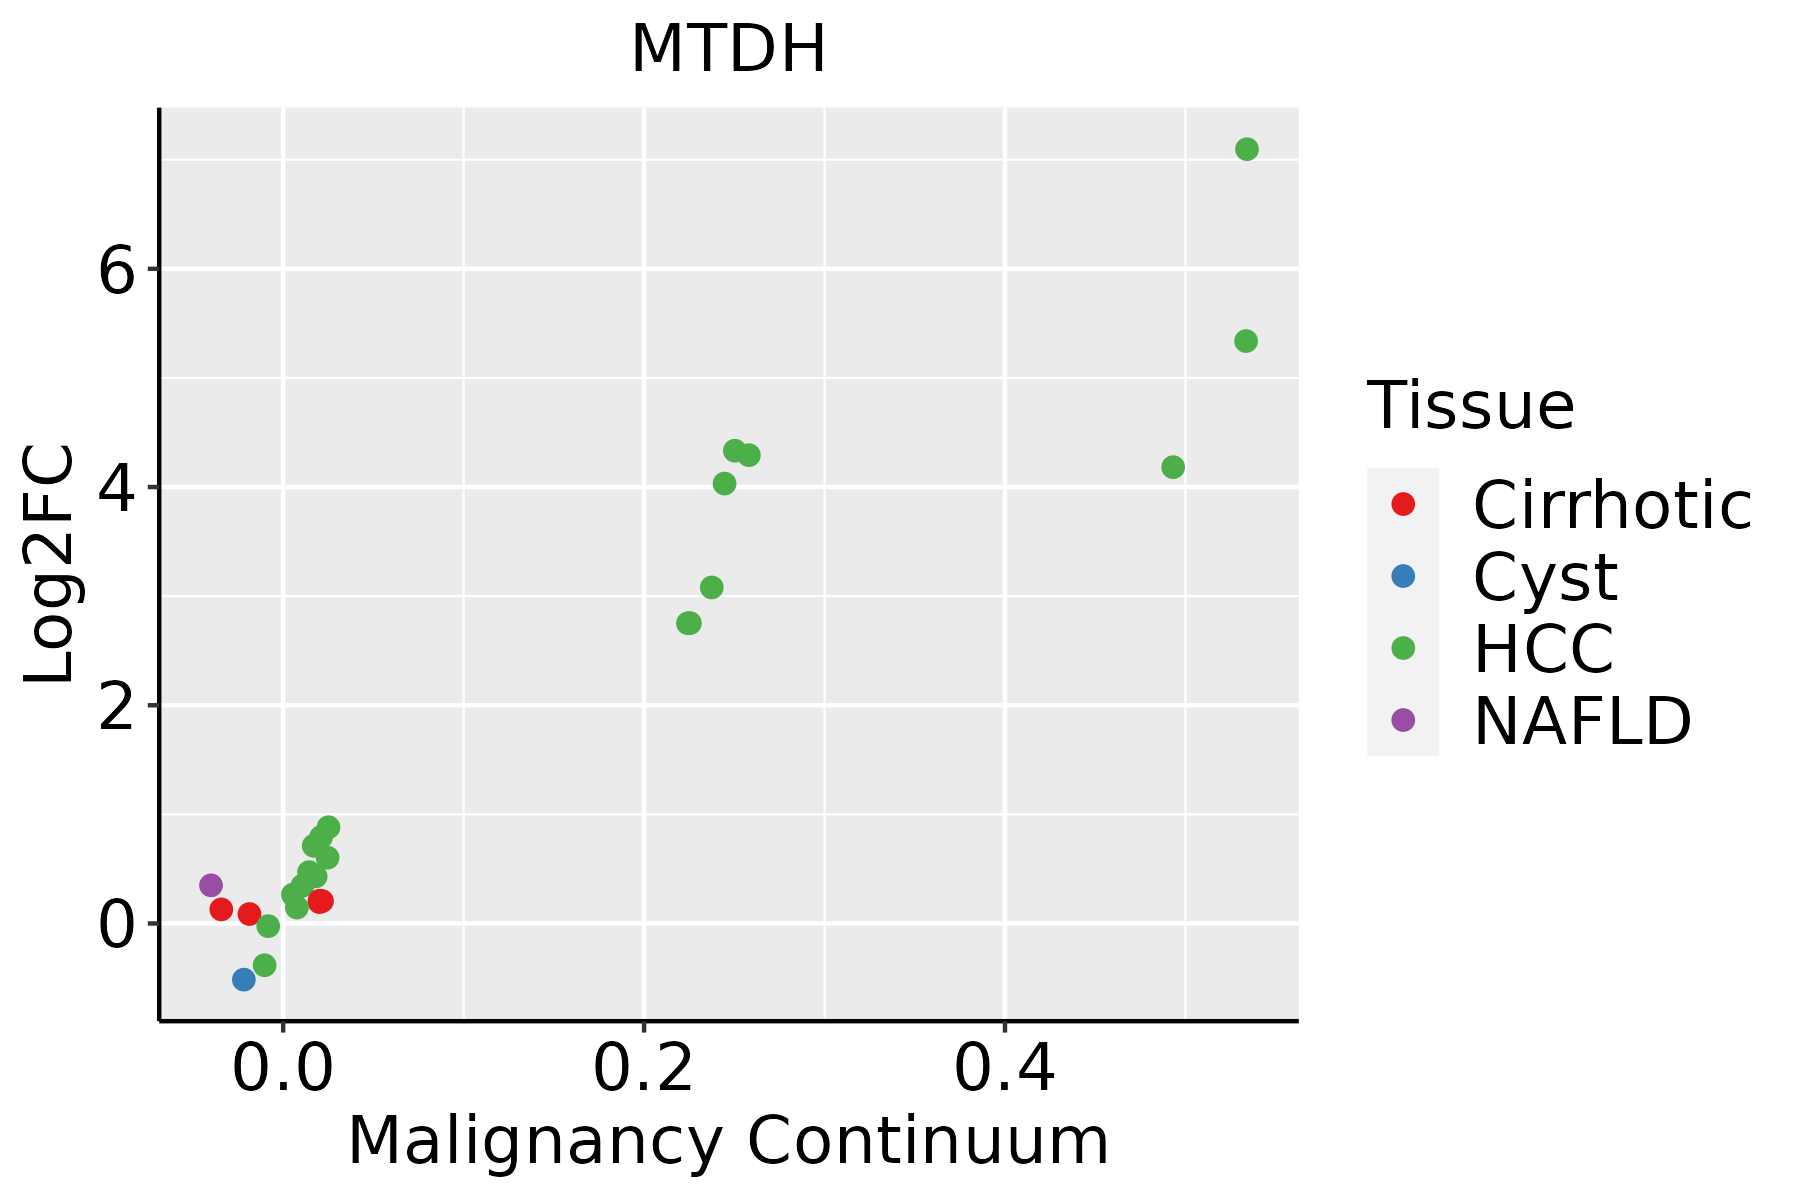 | HCC: Hepatocellular carcinoma |
| NAFLD: Non-alcoholic fatty liver disease |
| Lung | 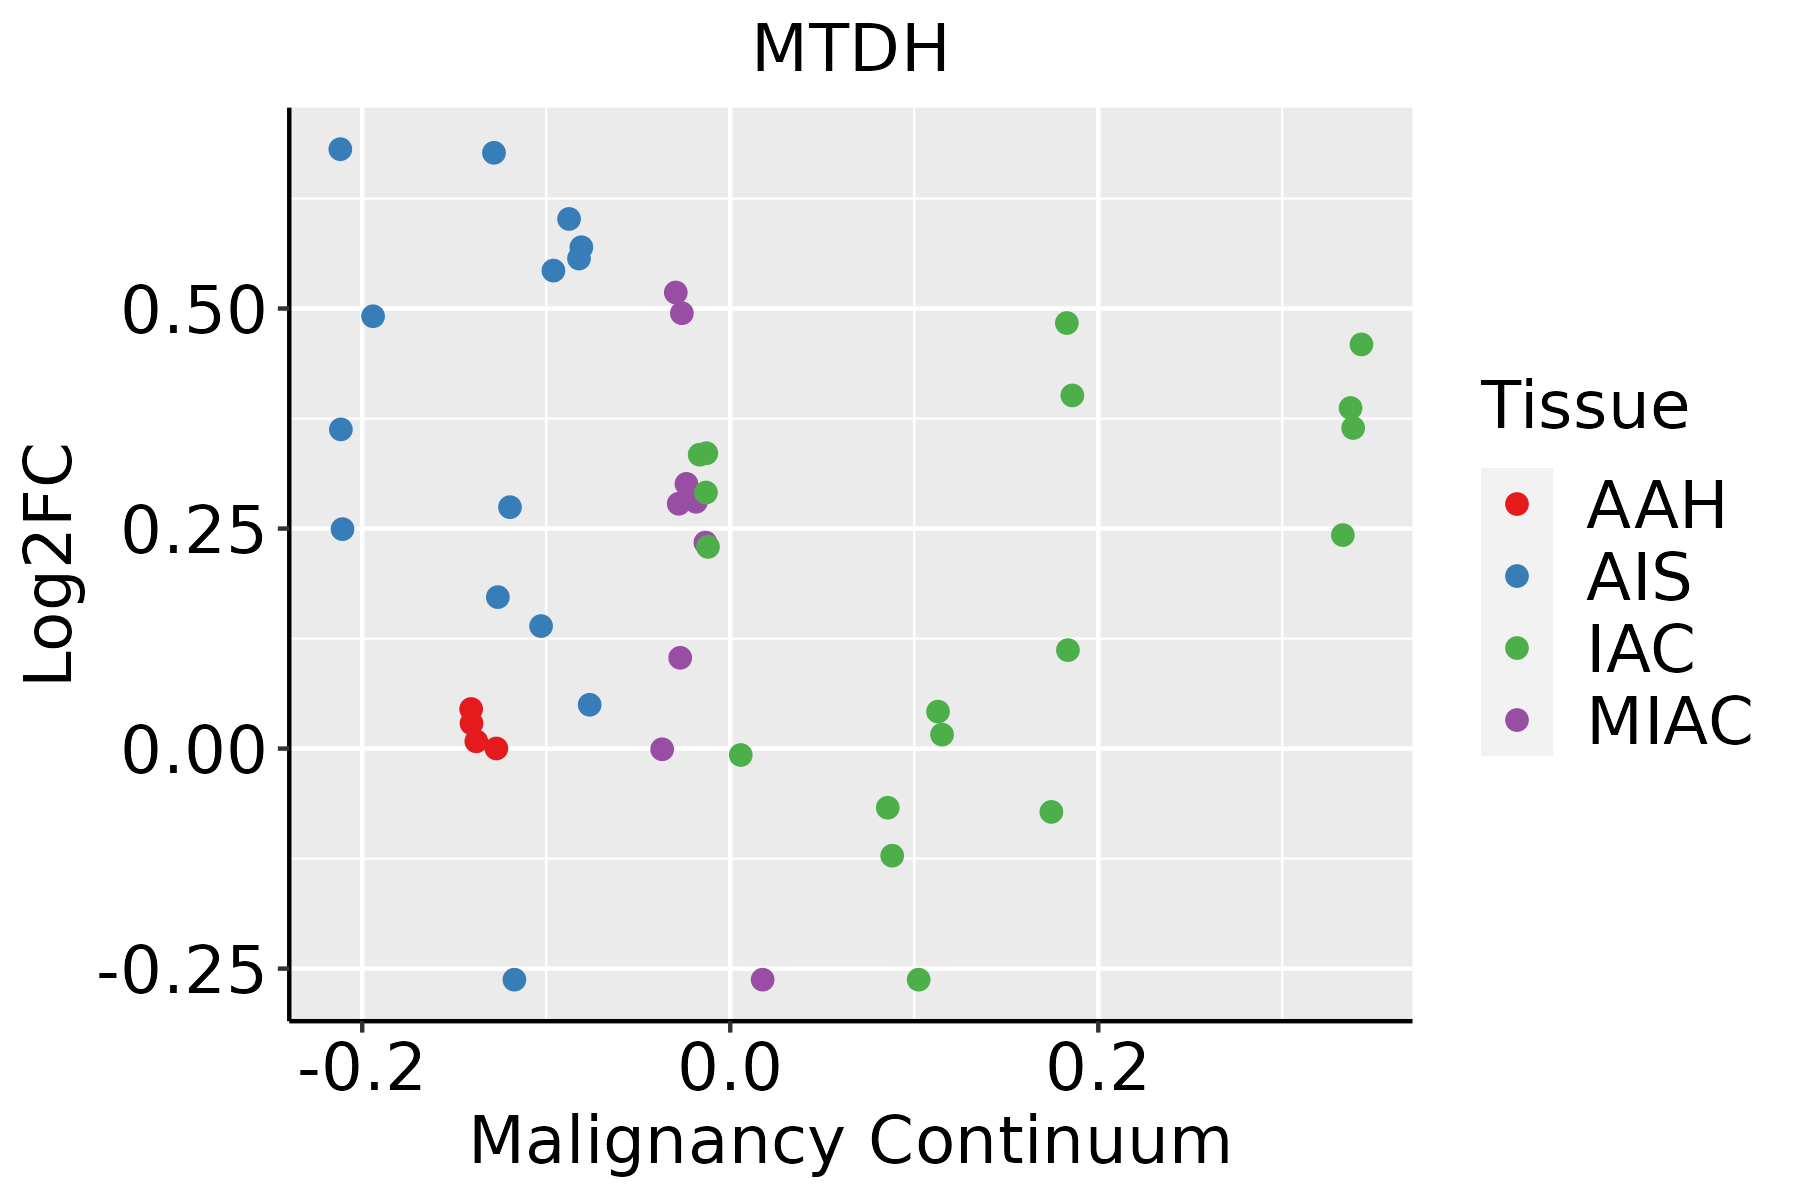 | AAH: Atypical adenomatous hyperplasia |
| AIS: Adenocarcinoma in situ |
| IAC: Invasive lung adenocarcinoma |
| MIA: Minimally invasive adenocarcinoma |
| Oral Cavity |  | EOLP: Erosive Oral lichen planus |
| LP: leukoplakia |
| NEOLP: Non-erosive oral lichen planus |
| OSCC: Oral squamous cell carcinoma |
| Prostate | 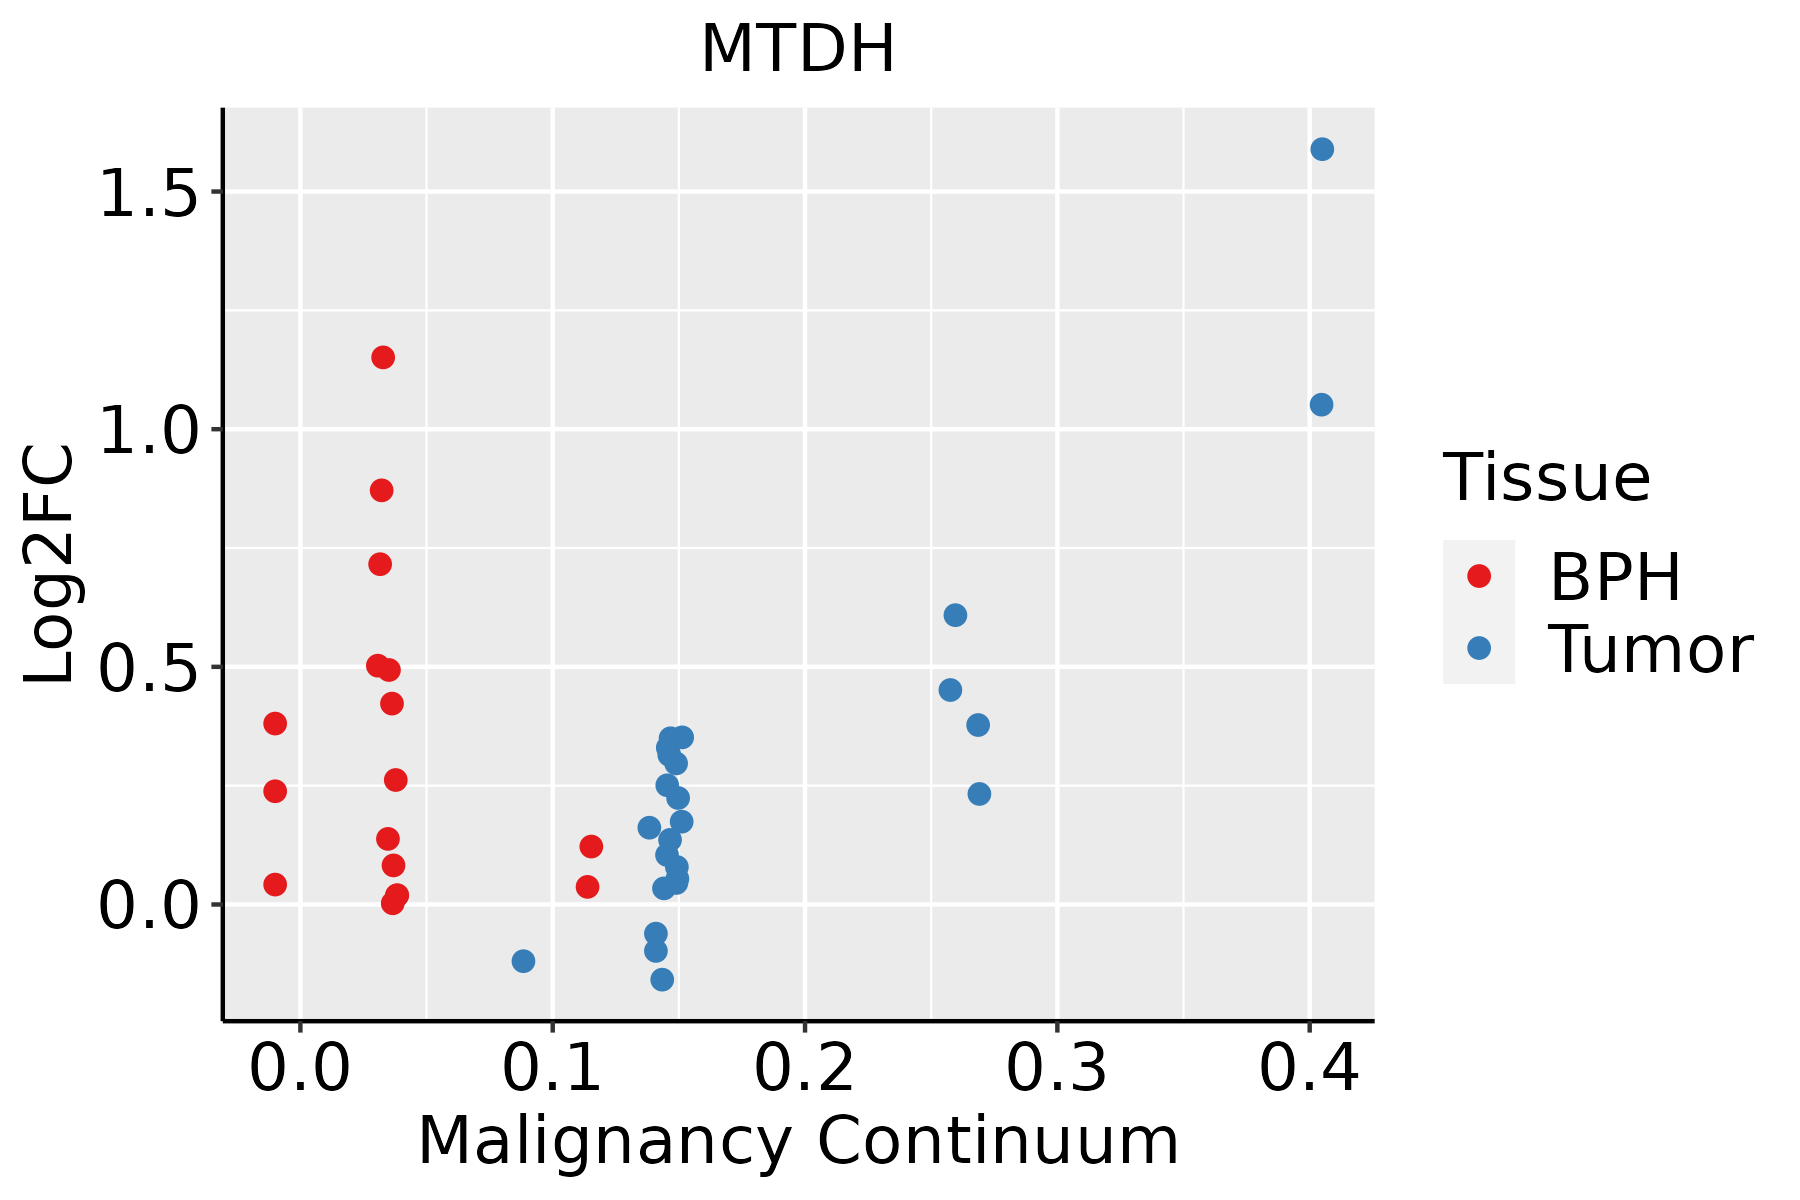 | BPH: Benign Prostatic Hyperplasia |
| Skin | 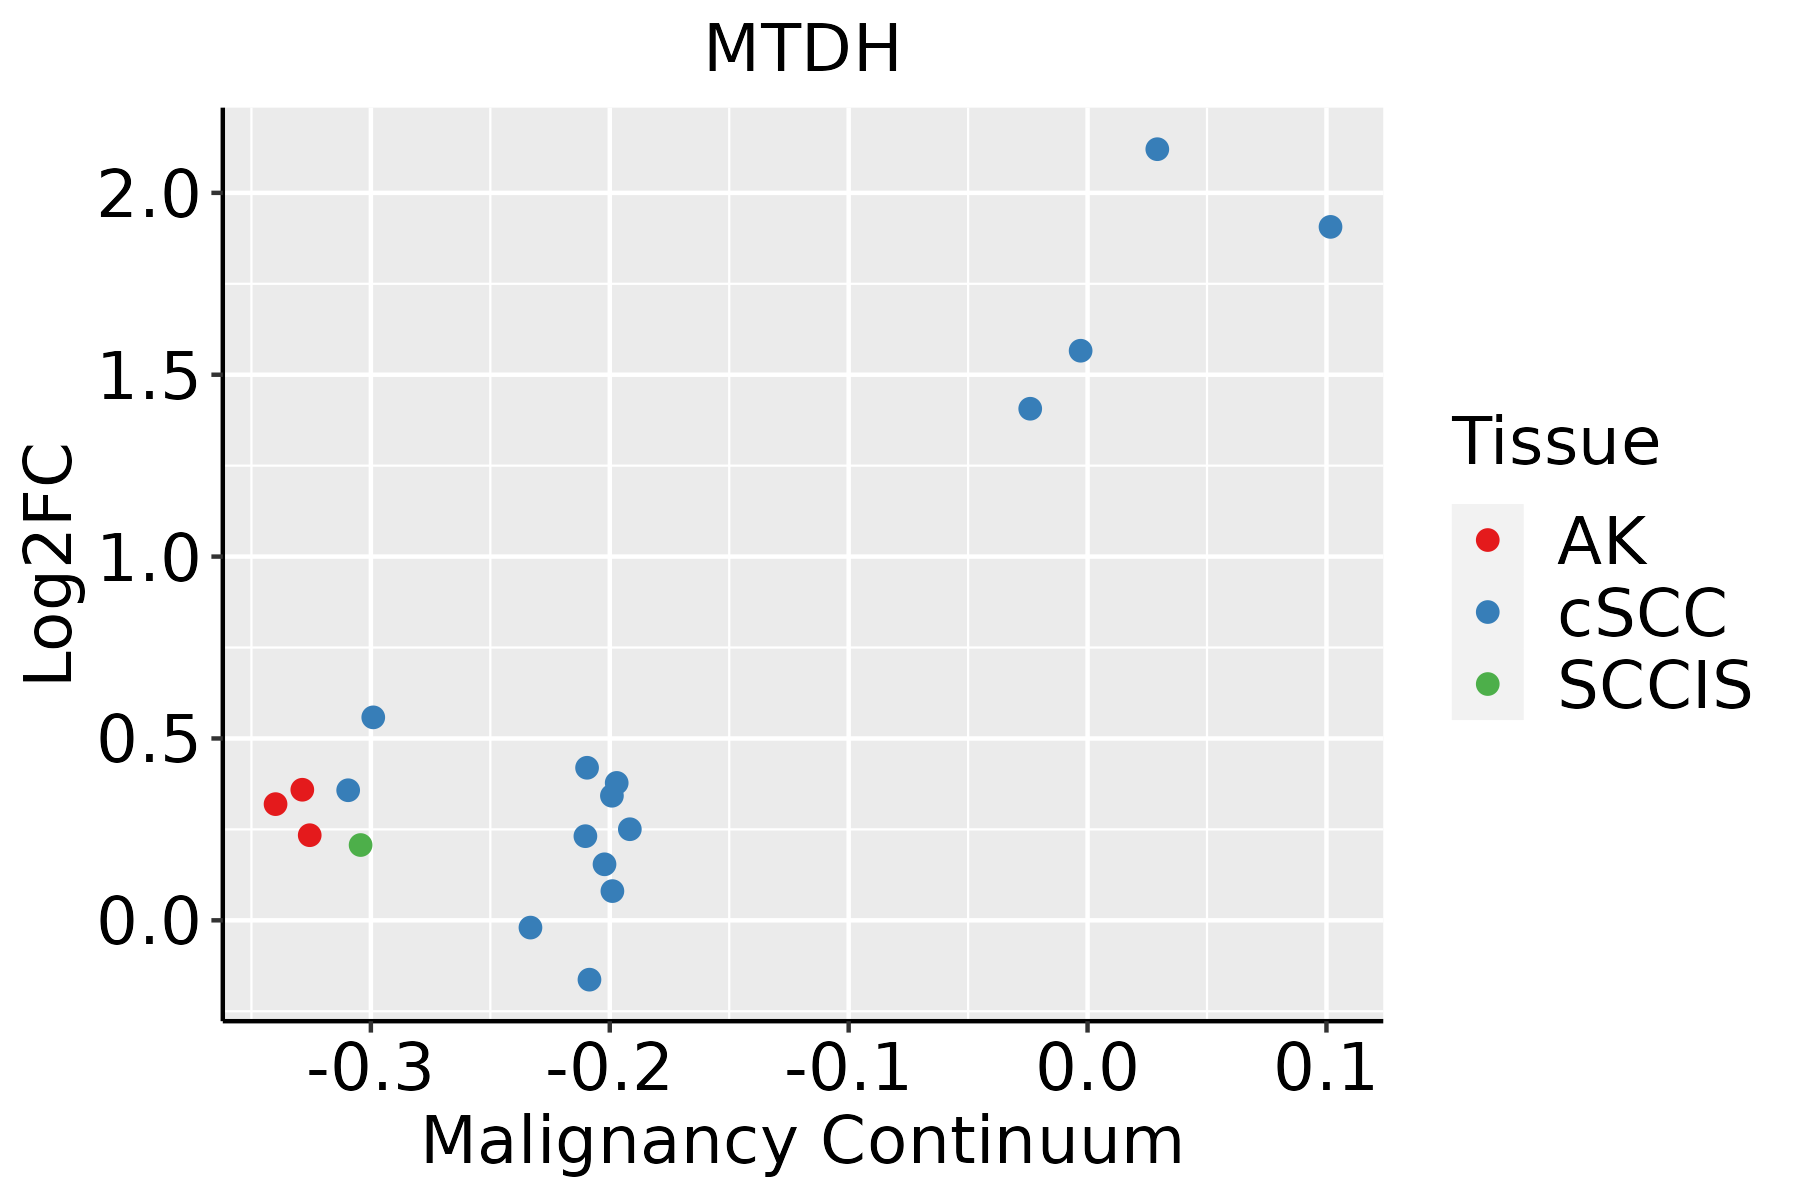 | AK: Actinic keratosis |
| cSCC: Cutaneous squamous cell carcinoma |
| SCCIS:squamous cell carcinoma in situ |
| Thyroid |  | ATC: Anaplastic thyroid cancer |
| HT: Hashimoto's thyroiditis |
| PTC: Papillary thyroid cancer |
| GO ID | Tissue | Disease Stage | Description | Gene Ratio | Bg Ratio | pvalue | p.adjust | Count |
| GO:00022378 | Breast | Precancer | response to molecule of bacterial origin | 43/1080 | 363/18723 | 6.05e-06 | 1.72e-04 | 43 |
| GO:00324968 | Breast | Precancer | response to lipopolysaccharide | 41/1080 | 343/18723 | 7.94e-06 | 2.17e-04 | 41 |
| GO:00098969 | Breast | Precancer | positive regulation of catabolic process | 48/1080 | 492/18723 | 2.62e-04 | 3.84e-03 | 48 |
| GO:00313319 | Breast | Precancer | positive regulation of cellular catabolic process | 43/1080 | 427/18723 | 2.75e-04 | 4.00e-03 | 43 |
| GO:0045766 | Breast | Precancer | positive regulation of angiogenesis | 23/1080 | 181/18723 | 3.09e-04 | 4.43e-03 | 23 |
| GO:1904018 | Breast | Precancer | positive regulation of vasculature development | 23/1080 | 181/18723 | 3.09e-04 | 4.43e-03 | 23 |
| GO:00712227 | Breast | Precancer | cellular response to lipopolysaccharide | 25/1080 | 209/18723 | 4.41e-04 | 5.85e-03 | 25 |
| GO:00712167 | Breast | Precancer | cellular response to biotic stimulus | 28/1080 | 246/18723 | 4.67e-04 | 6.14e-03 | 28 |
| GO:0045765 | Breast | Precancer | regulation of angiogenesis | 35/1080 | 342/18723 | 7.35e-04 | 8.80e-03 | 35 |
| GO:1901342 | Breast | Precancer | regulation of vasculature development | 35/1080 | 348/18723 | 1.00e-03 | 1.12e-02 | 35 |
| GO:00712197 | Breast | Precancer | cellular response to molecule of bacterial origin | 25/1080 | 221/18723 | 1.00e-03 | 1.12e-02 | 25 |
| GO:00434912 | Breast | Precancer | protein kinase B signaling | 23/1080 | 211/18723 | 2.53e-03 | 2.30e-02 | 23 |
| GO:00072496 | Breast | Precancer | I-kappaB kinase/NF-kappaB signaling | 27/1080 | 281/18723 | 6.58e-03 | 4.53e-02 | 27 |
| GO:000989614 | Breast | IDC | positive regulation of catabolic process | 62/1434 | 492/18723 | 7.06e-05 | 1.42e-03 | 62 |
| GO:003249612 | Breast | IDC | response to lipopolysaccharide | 47/1434 | 343/18723 | 7.13e-05 | 1.43e-03 | 47 |
| GO:000223712 | Breast | IDC | response to molecule of bacterial origin | 49/1434 | 363/18723 | 7.40e-05 | 1.47e-03 | 49 |
| GO:003133114 | Breast | IDC | positive regulation of cellular catabolic process | 54/1434 | 427/18723 | 1.85e-04 | 3.07e-03 | 54 |
| GO:00457651 | Breast | IDC | regulation of angiogenesis | 45/1434 | 342/18723 | 2.57e-04 | 3.98e-03 | 45 |
| GO:19013421 | Breast | IDC | regulation of vasculature development | 45/1434 | 348/18723 | 3.78e-04 | 5.38e-03 | 45 |
| GO:00431227 | Breast | IDC | regulation of I-kappaB kinase/NF-kappaB signaling | 34/1434 | 249/18723 | 7.18e-04 | 8.77e-03 | 34 |
| Hugo Symbol | Variant Class | Variant Classification | dbSNP RS | HGVSc | HGVSp | HGVSp Short | SWISSPROT | BIOTYPE | SIFT | PolyPhen | Tumor Sample Barcode | Tissue | Histology | Sex | Age | Stage | Therapy Types | Drugs | Outcome |
| MTDH | SNV | Missense_Mutation | novel | c.935N>T | p.Ala312Val | p.A312V | Q86UE4 | protein_coding | tolerated(0.11) | benign(0.005) | TCGA-AR-A0TS-01 | Breast | breast invasive carcinoma | Female | <65 | I/II | Chemotherapy | doxorubicin | SD |
| MTDH | SNV | Missense_Mutation | novel | c.1741N>A | p.Glu581Lys | p.E581K | Q86UE4 | protein_coding | deleterious(0) | probably_damaging(0.994) | TCGA-BH-A2L8-01 | Breast | breast invasive carcinoma | Female | <65 | I/II | Chemotherapy | cytoxan | CR |
| MTDH | SNV | Missense_Mutation | | c.468C>A | p.Asp156Glu | p.D156E | Q86UE4 | protein_coding | tolerated(0.83) | benign(0) | TCGA-E9-A22B-01 | Breast | breast invasive carcinoma | Female | >=65 | I/II | Hormone Therapy | tamoxiphen | SD |
| MTDH | deletion | Frame_Shift_Del | novel | c.1476delC | p.Ile493Ter | p.I493* | Q86UE4 | protein_coding | | | TCGA-EW-A2FV-01 | Breast | breast invasive carcinoma | Female | <65 | III/IV | Chemotherapy | docetaxel | SD |
| MTDH | SNV | Missense_Mutation | novel | c.712N>A | p.Ala238Thr | p.A238T | Q86UE4 | protein_coding | tolerated(0.08) | benign(0.003) | TCGA-2W-A8YY-01 | Cervix | cervical & endocervical cancer | Female | <65 | I/II | Chemotherapy | cisplatin | CR |
| MTDH | SNV | Missense_Mutation | | c.1060G>A | p.Glu354Lys | p.E354K | Q86UE4 | protein_coding | deleterious(0.01) | possibly_damaging(0.754) | TCGA-C5-A1MH-01 | Cervix | cervical & endocervical cancer | Female | >=65 | III/IV | Chemotherapy | cisplatin | PD |
| MTDH | SNV | Missense_Mutation | | c.1060N>A | p.Glu354Lys | p.E354K | Q86UE4 | protein_coding | deleterious(0.01) | possibly_damaging(0.754) | TCGA-EK-A3GK-01 | Cervix | cervical & endocervical cancer | Female | <65 | I/II | Unknown | Unknown | SD |
| MTDH | SNV | Missense_Mutation | | c.641N>G | p.Ser214Cys | p.S214C | Q86UE4 | protein_coding | tolerated(0.12) | possibly_damaging(0.855) | TCGA-JW-A5VL-01 | Cervix | cervical & endocervical cancer | Female | <65 | I/II | Unknown | Unknown | SD |
| MTDH | SNV | Missense_Mutation | | c.1677G>C | p.Gln559His | p.Q559H | Q86UE4 | protein_coding | tolerated(0.08) | probably_damaging(0.997) | TCGA-JX-A3Q0-01 | Cervix | cervical & endocervical cancer | Female | <65 | III/IV | Unknown | Unknown | SD |
| MTDH | SNV | Missense_Mutation | novel | c.130N>T | p.Pro44Ser | p.P44S | Q86UE4 | protein_coding | deleterious(0.01) | probably_damaging(0.964) | TCGA-VS-A9UJ-01 | Cervix | cervical & endocervical cancer | Female | <65 | I/II | Unknown | Unknown | PD |


