
|
|||||
|
 | |
| |
| |
| |
| |
| |
|
Gene: MTCL1 |
Gene summary for MTCL1 |
| Gene information | Species | Human | Gene symbol | MTCL1 | Gene ID | 23255 |
| Gene name | microtubule crosslinking factor 1 | |
| Gene Alias | CCDC165 | |
| Cytomap | 18p11.22 | |
| Gene Type | protein-coding | GO ID | GO:0000226 | UniProtAcc | Q9Y4B5 |
Top |
Malignant transformation analysis |
| Identification of the aberrant gene expression in precancerous and cancerous lesions by comparing the gene expression of stem-like cells in diseased tissues with normal stem cells |
| Entrez ID | Symbol | Replicates | Species | Organ | Tissue | Adj P-value | Log2FC | Malignancy |
| 23255 | MTCL1 | AEH-subject3 | Human | Endometrium | AEH | 5.60e-19 | 5.66e-01 | -0.2576 |
| 23255 | MTCL1 | AEH-subject4 | Human | Endometrium | AEH | 1.38e-03 | 2.84e-01 | -0.2657 |
| 23255 | MTCL1 | EEC-subject1 | Human | Endometrium | EEC | 7.54e-06 | 3.03e-01 | -0.2682 |
| 23255 | MTCL1 | GSM6177620_NYU_UCEC1_lib1_lib1 | Human | Endometrium | EEC | 1.70e-02 | -1.04e-01 | -0.1869 |
| 23255 | MTCL1 | GSM6177620_NYU_UCEC1_lib3_lib3 | Human | Endometrium | EEC | 1.42e-06 | -7.94e-02 | -0.1883 |
| 23255 | MTCL1 | GSM6177621_NYU_UCEC2_lib1_lib1 | Human | Endometrium | EEC | 1.09e-04 | -3.47e-02 | -0.1934 |
| 23255 | MTCL1 | GSM6177622_NYU_UCEC3_lib1_lib1 | Human | Endometrium | EEC | 2.21e-06 | -7.89e-02 | -0.1917 |
| 23255 | MTCL1 | GSM6177622_NYU_UCEC3_lib2_lib2 | Human | Endometrium | EEC | 2.48e-04 | -1.04e-01 | -0.1916 |
| 23255 | MTCL1 | GSM6177623_NYU_UCEC3_Vis | Human | Endometrium | EEC | 7.24e-03 | -7.53e-02 | -0.1269 |
| 23255 | MTCL1 | P4T-E | Human | Esophagus | ESCC | 4.70e-02 | 3.68e-02 | 0.1323 |
| 23255 | MTCL1 | P5T-E | Human | Esophagus | ESCC | 7.09e-08 | 1.56e-01 | 0.1327 |
| 23255 | MTCL1 | P9T-E | Human | Esophagus | ESCC | 7.55e-03 | 2.23e-02 | 0.1131 |
| 23255 | MTCL1 | P10T-E | Human | Esophagus | ESCC | 1.41e-11 | 3.02e-01 | 0.116 |
| 23255 | MTCL1 | P11T-E | Human | Esophagus | ESCC | 3.02e-04 | 1.42e-01 | 0.1426 |
| 23255 | MTCL1 | P12T-E | Human | Esophagus | ESCC | 4.06e-11 | 2.23e-01 | 0.1122 |
| 23255 | MTCL1 | P15T-E | Human | Esophagus | ESCC | 7.81e-11 | 1.13e-01 | 0.1149 |
| 23255 | MTCL1 | P21T-E | Human | Esophagus | ESCC | 3.39e-10 | 6.80e-02 | 0.1617 |
| 23255 | MTCL1 | P22T-E | Human | Esophagus | ESCC | 5.29e-04 | 3.87e-02 | 0.1236 |
| 23255 | MTCL1 | P23T-E | Human | Esophagus | ESCC | 6.81e-05 | 4.51e-02 | 0.108 |
| 23255 | MTCL1 | P26T-E | Human | Esophagus | ESCC | 6.40e-10 | 1.07e-01 | 0.1276 |
| Page: 1 2 |
| Tissue | Expression Dynamics | Abbreviation |
| Endometrium | 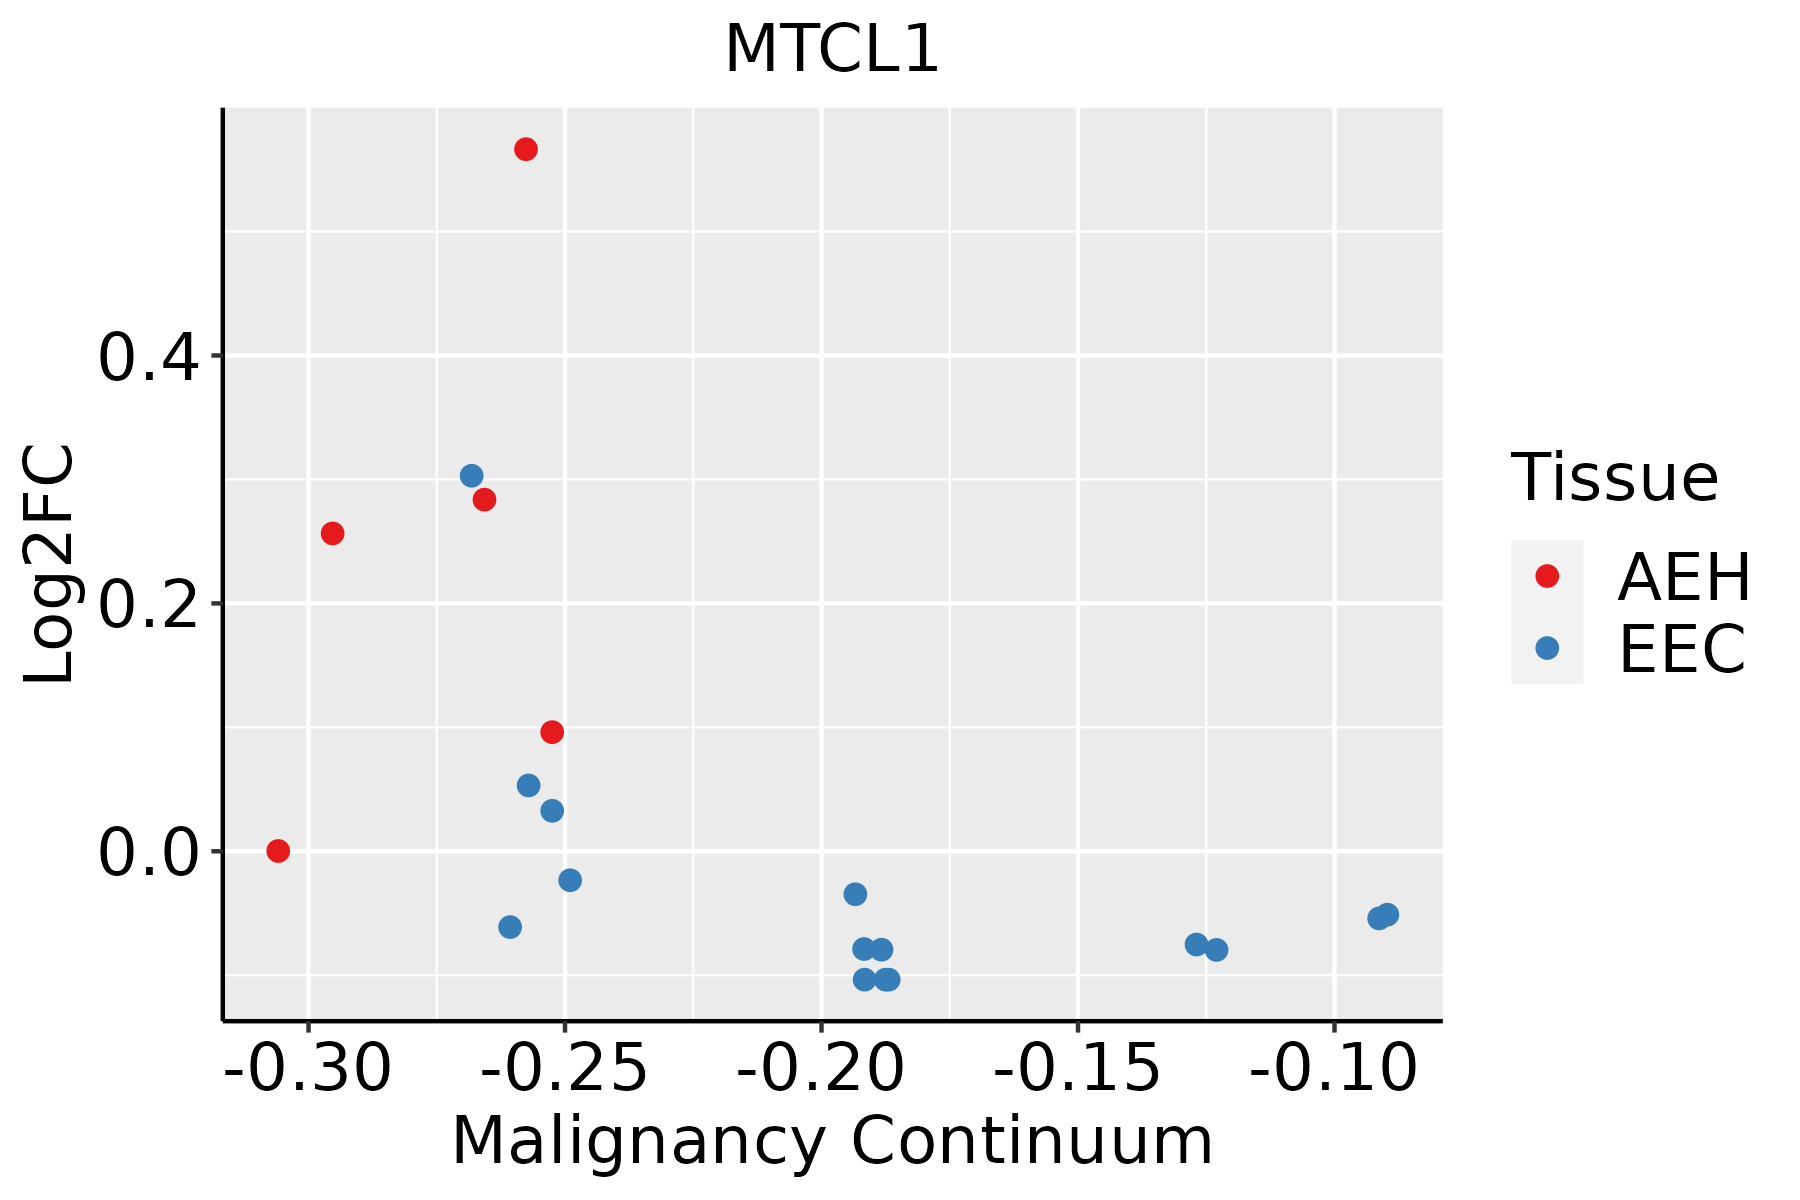 | AEH: Atypical endometrial hyperplasia |
| EEC: Endometrioid Cancer | ||
| Esophagus | 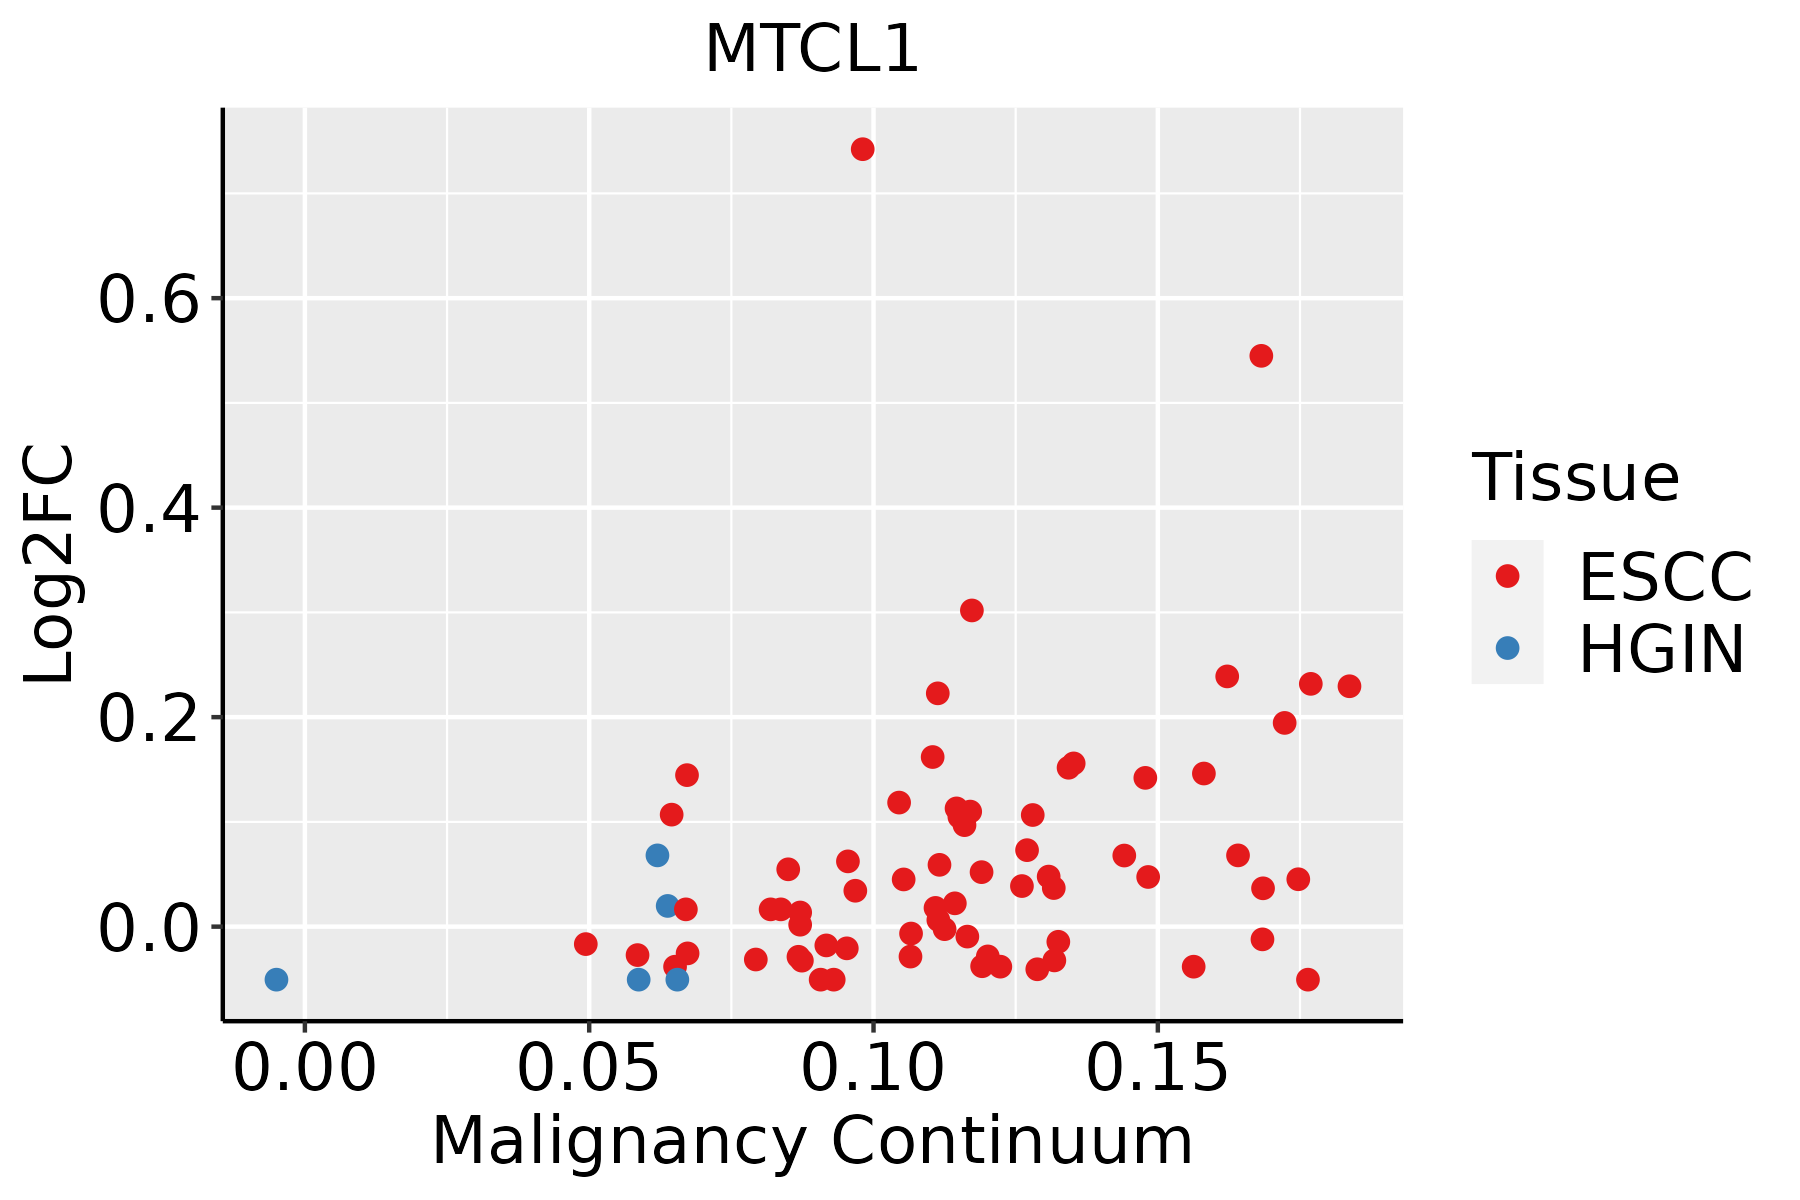 | ESCC: Esophageal squamous cell carcinoma |
| HGIN: High-grade intraepithelial neoplasias | ||
| LGIN: Low-grade intraepithelial neoplasias | ||
| Liver | 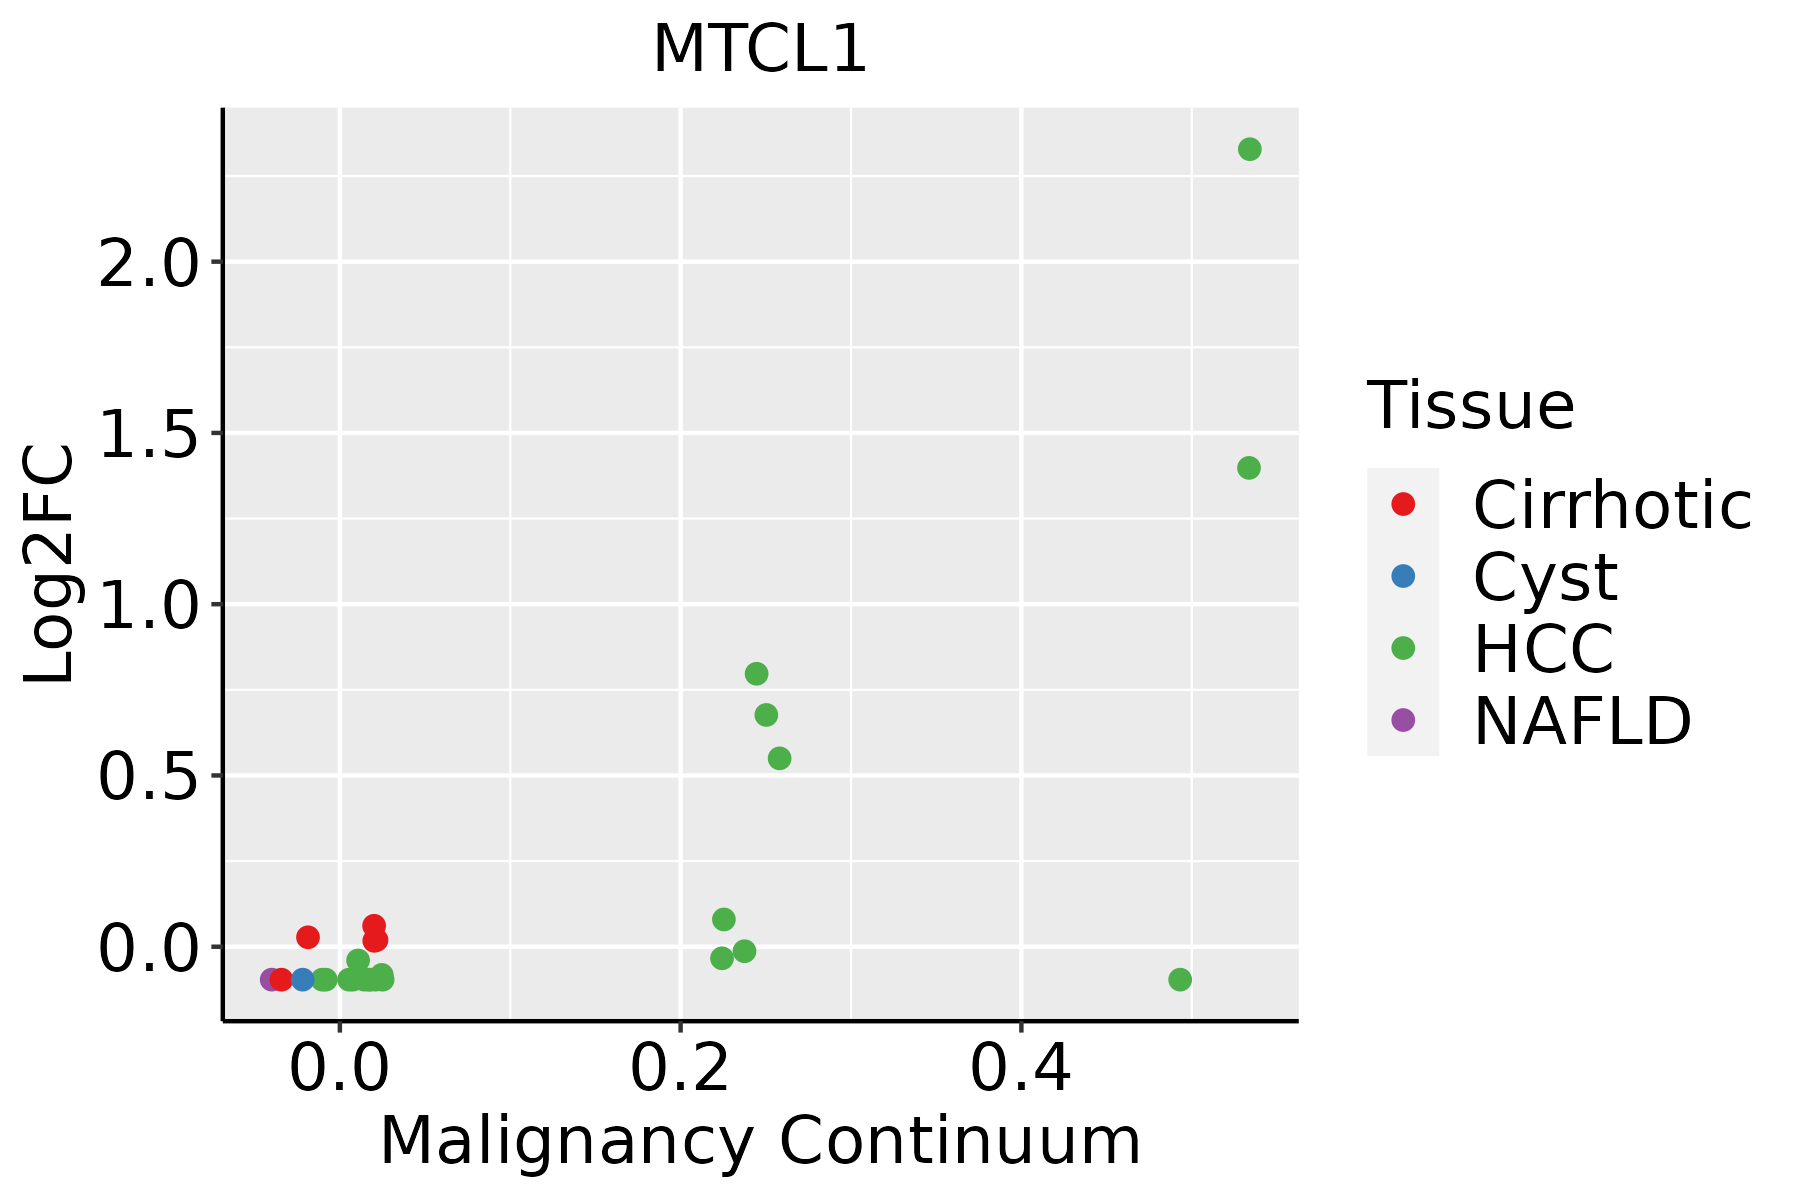 | HCC: Hepatocellular carcinoma |
| NAFLD: Non-alcoholic fatty liver disease |
| ∗log2FC in expression of this searched gene in stem-like cells from each diseased tissue sample relative to stem-like cells in normal samples in each tissue plotted against the malignancy continuum. Samples are colored based on if they are from different disease stage. |
Top |
Malignant transformation related pathway analysis |
| Find out the enriched GO biological processes and KEGG pathways involved in transition from healthy to precancer to cancer |
| Tissue | Disease Stage | Enriched GO biological Processes |
| Colorectum | AD |  |
| Colorectum | SER |  |
| Colorectum | MSS |  |
| Colorectum | MSI-H |  |
| Colorectum | FAP |  |
| ∗Top 15 enriched GO BP terms are showed in the bar plot of each disease state in each tissue. Each row represents a significant GO biological process which is colored according to the -log10(p.adjust). |
| Page: 1 2 3 4 5 6 7 8 9 |
| GO ID | Tissue | Disease Stage | Description | Gene Ratio | Bg Ratio | pvalue | p.adjust | Count |
| GO:190495115 | Endometrium | AEH | positive regulation of establishment of protein localization | 74/2100 | 319/18723 | 7.05e-10 | 6.51e-08 | 74 |
| GO:190382916 | Endometrium | AEH | positive regulation of cellular protein localization | 66/2100 | 276/18723 | 1.57e-09 | 1.36e-07 | 66 |
| GO:000716310 | Endometrium | AEH | establishment or maintenance of cell polarity | 54/2100 | 218/18723 | 1.30e-08 | 8.47e-07 | 54 |
| GO:000660516 | Endometrium | AEH | protein targeting | 68/2100 | 314/18723 | 6.30e-08 | 3.38e-06 | 68 |
| GO:005122215 | Endometrium | AEH | positive regulation of protein transport | 66/2100 | 303/18723 | 7.79e-08 | 3.99e-06 | 66 |
| GO:003315710 | Endometrium | AEH | regulation of intracellular protein transport | 51/2100 | 229/18723 | 1.13e-06 | 3.75e-05 | 51 |
| GO:003238810 | Endometrium | AEH | positive regulation of intracellular transport | 46/2100 | 202/18723 | 1.96e-06 | 5.93e-05 | 46 |
| GO:00323869 | Endometrium | AEH | regulation of intracellular transport | 66/2100 | 337/18723 | 4.18e-06 | 1.10e-04 | 66 |
| GO:00903168 | Endometrium | AEH | positive regulation of intracellular protein transport | 38/2100 | 160/18723 | 5.22e-06 | 1.33e-04 | 38 |
| GO:009015010 | Endometrium | AEH | establishment of protein localization to membrane | 51/2100 | 260/18723 | 4.74e-05 | 7.85e-04 | 51 |
| GO:19054779 | Endometrium | AEH | positive regulation of protein localization to membrane | 26/2100 | 106/18723 | 8.63e-05 | 1.27e-03 | 26 |
| GO:00350886 | Endometrium | AEH | establishment or maintenance of apical/basal cell polarity | 14/2100 | 49/18723 | 7.19e-04 | 6.90e-03 | 14 |
| GO:00612456 | Endometrium | AEH | establishment or maintenance of bipolar cell polarity | 14/2100 | 49/18723 | 7.19e-04 | 6.90e-03 | 14 |
| GO:00451976 | Endometrium | AEH | establishment or maintenance of epithelial cell apical/basal polarity | 13/2100 | 44/18723 | 7.79e-04 | 7.36e-03 | 13 |
| GO:19054759 | Endometrium | AEH | regulation of protein localization to membrane | 34/2100 | 175/18723 | 9.62e-04 | 8.75e-03 | 34 |
| GO:00105068 | Endometrium | AEH | regulation of autophagy | 54/2100 | 317/18723 | 1.15e-03 | 9.97e-03 | 54 |
| GO:19035335 | Endometrium | AEH | regulation of protein targeting | 18/2100 | 81/18723 | 3.28e-03 | 2.30e-02 | 18 |
| GO:190382917 | Endometrium | EEC | positive regulation of cellular protein localization | 67/2168 | 276/18723 | 2.27e-09 | 1.84e-07 | 67 |
| GO:190495116 | Endometrium | EEC | positive regulation of establishment of protein localization | 74/2168 | 319/18723 | 2.90e-09 | 2.10e-07 | 74 |
| GO:000716315 | Endometrium | EEC | establishment or maintenance of cell polarity | 56/2168 | 218/18723 | 5.41e-09 | 3.57e-07 | 56 |
| Page: 1 2 3 4 |
| Pathway ID | Tissue | Disease Stage | Description | Gene Ratio | Bg Ratio | pvalue | p.adjust | qvalue | Count |
| Page: 1 |
Top |
Cell-cell communication analysis |
| Identification of potential cell-cell interactions between two cell types and their ligand-receptor pairs for different disease states |
| Ligand | Receptor | LRpair | Pathway | Tissue | Disease Stage |
| Page: 1 |
Top |
Single-cell gene regulatory network inference analysis |
| Find out the significant the regulons (TFs) and the target genes of each regulon across cell types for different disease states |
| TF | Cell Type | Tissue | Disease Stage | Target Gene | RSS | Regulon Activity |
| ∗The dot plots of a searched regulon are shown for all cell subpopulations in each disease state of each tissue based on the regulon specific score inferred using pySCENIC and by calculating the average expression. |
| Page: 1 |
Top |
Somatic mutation of malignant transformation related genes |
| Annotation of somatic variants for genes involved in malignant transformation |
| Hugo Symbol | Variant Class | Variant Classification | dbSNP RS | HGVSc | HGVSp | HGVSp Short | SWISSPROT | BIOTYPE | SIFT | PolyPhen | Tumor Sample Barcode | Tissue | Histology | Sex | Age | Stage | Therapy Types | Drugs | Outcome |
| MTCL1 | SNV | Missense_Mutation | novel | c.2037N>C | p.Leu679Phe | p.L679F | Q9Y4B5 | protein_coding | deleterious(0) | probably_damaging(0.982) | TCGA-A2-A3Y0-01 | Breast | breast invasive carcinoma | Female | <65 | I/II | Chemotherapy | adriamycin | CR |
| MTCL1 | SNV | Missense_Mutation | novel | c.3214N>A | p.Glu1072Lys | p.E1072K | Q9Y4B5 | protein_coding | deleterious(0) | probably_damaging(0.919) | TCGA-A7-A0DB-01 | Breast | breast invasive carcinoma | Female | <65 | I/II | Hormone Therapy | arimidex | SD |
| MTCL1 | SNV | Missense_Mutation | c.2158N>T | p.Leu720Phe | p.L720F | Q9Y4B5 | protein_coding | deleterious(0) | probably_damaging(0.954) | TCGA-AN-A0FK-01 | Breast | breast invasive carcinoma | Female | >=65 | III/IV | Unknown | Unknown | SD | |
| MTCL1 | SNV | Missense_Mutation | novel | c.1451N>A | p.Leu484Gln | p.L484Q | Q9Y4B5 | protein_coding | deleterious(0) | probably_damaging(0.972) | TCGA-B6-A0RE-01 | Breast | breast invasive carcinoma | Female | <65 | I/II | Unknown | Unknown | SD |
| MTCL1 | SNV | Missense_Mutation | novel | c.2832N>C | p.Lys944Asn | p.K944N | Q9Y4B5 | protein_coding | tolerated(0.3) | benign(0.297) | TCGA-BH-A0B6-01 | Breast | breast invasive carcinoma | Female | <65 | I/II | Unknown | Unknown | SD |
| MTCL1 | SNV | Missense_Mutation | c.2878N>A | p.Pro960Thr | p.P960T | Q9Y4B5 | protein_coding | tolerated(0.1) | benign(0.024) | TCGA-BH-A0DL-01 | Breast | breast invasive carcinoma | Female | <65 | I/II | Chemotherapy | cytoxan | CR | |
| MTCL1 | SNV | Missense_Mutation | rs145193610 | c.3266C>T | p.Pro1089Leu | p.P1089L | Q9Y4B5 | protein_coding | deleterious(0.03) | benign(0.324) | TCGA-BH-A6R8-01 | Breast | breast invasive carcinoma | Female | <65 | I/II | Unknown | Unknown | SD |
| MTCL1 | insertion | Frame_Shift_Ins | novel | c.399_400insGTTATCCCAGCCACTCTCCTTTTTC | p.Lys134ValfsTer13 | p.K134Vfs*13 | Q9Y4B5 | protein_coding | TCGA-A8-A09T-01 | Breast | breast invasive carcinoma | Female | >=65 | I/II | Hormone Therapy | anastrozole | SD | ||
| MTCL1 | insertion | Frame_Shift_Ins | novel | c.1450_1451insCAGCAGG | p.Leu484ProfsTer22 | p.L484Pfs*22 | Q9Y4B5 | protein_coding | TCGA-B6-A0RE-01 | Breast | breast invasive carcinoma | Female | <65 | I/II | Unknown | Unknown | SD | ||
| MTCL1 | insertion | Frame_Shift_Ins | novel | c.4291_4292insTGTCGTCTCCTTCCCGGAGCCTTAGGAGCAGACAGGT | p.Arg1431MetfsTer22 | p.R1431Mfs*22 | Q9Y4B5 | protein_coding | TCGA-BH-A1FD-01 | Breast | breast invasive carcinoma | Female | >=65 | I/II | Unknown | Unknown | PD |
| Page: 1 2 3 4 5 6 7 8 9 10 11 12 13 14 15 16 17 18 19 |
Top |
Related drugs of malignant transformation related genes |
| Identification of chemicals and drugs interact with genes involved in malignant transfromation |
| (DGIdb 4.0) |
| Entrez ID | Symbol | Category | Interaction Types | Drug Claim Name | Drug Name | PMIDs |
| Page: 1 |

Copyright 2023-Present -The University of Texas Health Science Center at Houston |