
|
|||||
|
 | |
| |
| |
| |
| |
| |
|
Gene: MTCH2 |
Gene summary for MTCH2 |
| Gene information | Species | Human | Gene symbol | MTCH2 | Gene ID | 23788 |
| Gene name | mitochondrial carrier 2 | |
| Gene Alias | HSPC032 | |
| Cytomap | 11p11.2 | |
| Gene Type | protein-coding | GO ID | GO:0006915 | UniProtAcc | Q9Y6C9 |
Top |
Malignant transformation analysis |
| Identification of the aberrant gene expression in precancerous and cancerous lesions by comparing the gene expression of stem-like cells in diseased tissues with normal stem cells |
| Entrez ID | Symbol | Replicates | Species | Organ | Tissue | Adj P-value | Log2FC | Malignancy |
| 23788 | MTCH2 | HTA11_347_2000001011 | Human | Colorectum | AD | 1.44e-16 | 6.55e-01 | -0.1954 |
| 23788 | MTCH2 | HTA11_83_2000001011 | Human | Colorectum | SER | 1.58e-05 | 6.22e-01 | -0.1526 |
| 23788 | MTCH2 | HTA11_1391_2000001011 | Human | Colorectum | AD | 4.13e-03 | 4.34e-01 | -0.059 |
| 23788 | MTCH2 | HTA11_99999965104_69814 | Human | Colorectum | MSS | 6.00e-04 | 4.88e-01 | 0.281 |
| 23788 | MTCH2 | HTA11_99999971662_82457 | Human | Colorectum | MSS | 3.34e-03 | 5.35e-01 | 0.3859 |
| 23788 | MTCH2 | A001-C-207 | Human | Colorectum | FAP | 3.63e-03 | -3.05e-01 | 0.1278 |
| 23788 | MTCH2 | A015-C-203 | Human | Colorectum | FAP | 7.39e-18 | -2.13e-01 | -0.1294 |
| 23788 | MTCH2 | A015-C-204 | Human | Colorectum | FAP | 7.14e-03 | -1.88e-01 | -0.0228 |
| 23788 | MTCH2 | A002-C-201 | Human | Colorectum | FAP | 2.66e-06 | -2.18e-01 | 0.0324 |
| 23788 | MTCH2 | A002-C-203 | Human | Colorectum | FAP | 8.10e-06 | -1.91e-01 | 0.2786 |
| 23788 | MTCH2 | A001-C-119 | Human | Colorectum | FAP | 4.78e-03 | -2.88e-01 | -0.1557 |
| 23788 | MTCH2 | A001-C-108 | Human | Colorectum | FAP | 3.69e-12 | -2.34e-01 | -0.0272 |
| 23788 | MTCH2 | A002-C-205 | Human | Colorectum | FAP | 2.27e-13 | -3.64e-01 | -0.1236 |
| 23788 | MTCH2 | A001-C-104 | Human | Colorectum | FAP | 8.93e-03 | -1.90e-01 | 0.0184 |
| 23788 | MTCH2 | A015-C-006 | Human | Colorectum | FAP | 6.98e-08 | -3.21e-01 | -0.0994 |
| 23788 | MTCH2 | A015-C-106 | Human | Colorectum | FAP | 1.83e-08 | -2.32e-01 | -0.0511 |
| 23788 | MTCH2 | A002-C-114 | Human | Colorectum | FAP | 2.05e-09 | -2.61e-01 | -0.1561 |
| 23788 | MTCH2 | A015-C-104 | Human | Colorectum | FAP | 1.02e-18 | -2.91e-01 | -0.1899 |
| 23788 | MTCH2 | A001-C-014 | Human | Colorectum | FAP | 4.77e-11 | -2.47e-01 | 0.0135 |
| 23788 | MTCH2 | A002-C-016 | Human | Colorectum | FAP | 3.03e-10 | -2.45e-01 | 0.0521 |
| Page: 1 2 3 4 5 6 7 8 9 |
| Tissue | Expression Dynamics | Abbreviation |
| Colorectum (GSE201348) |  | FAP: Familial adenomatous polyposis |
| CRC: Colorectal cancer | ||
| Colorectum (HTA11) |  | AD: Adenomas |
| SER: Sessile serrated lesions | ||
| MSI-H: Microsatellite-high colorectal cancer | ||
| MSS: Microsatellite stable colorectal cancer | ||
| Esophagus | 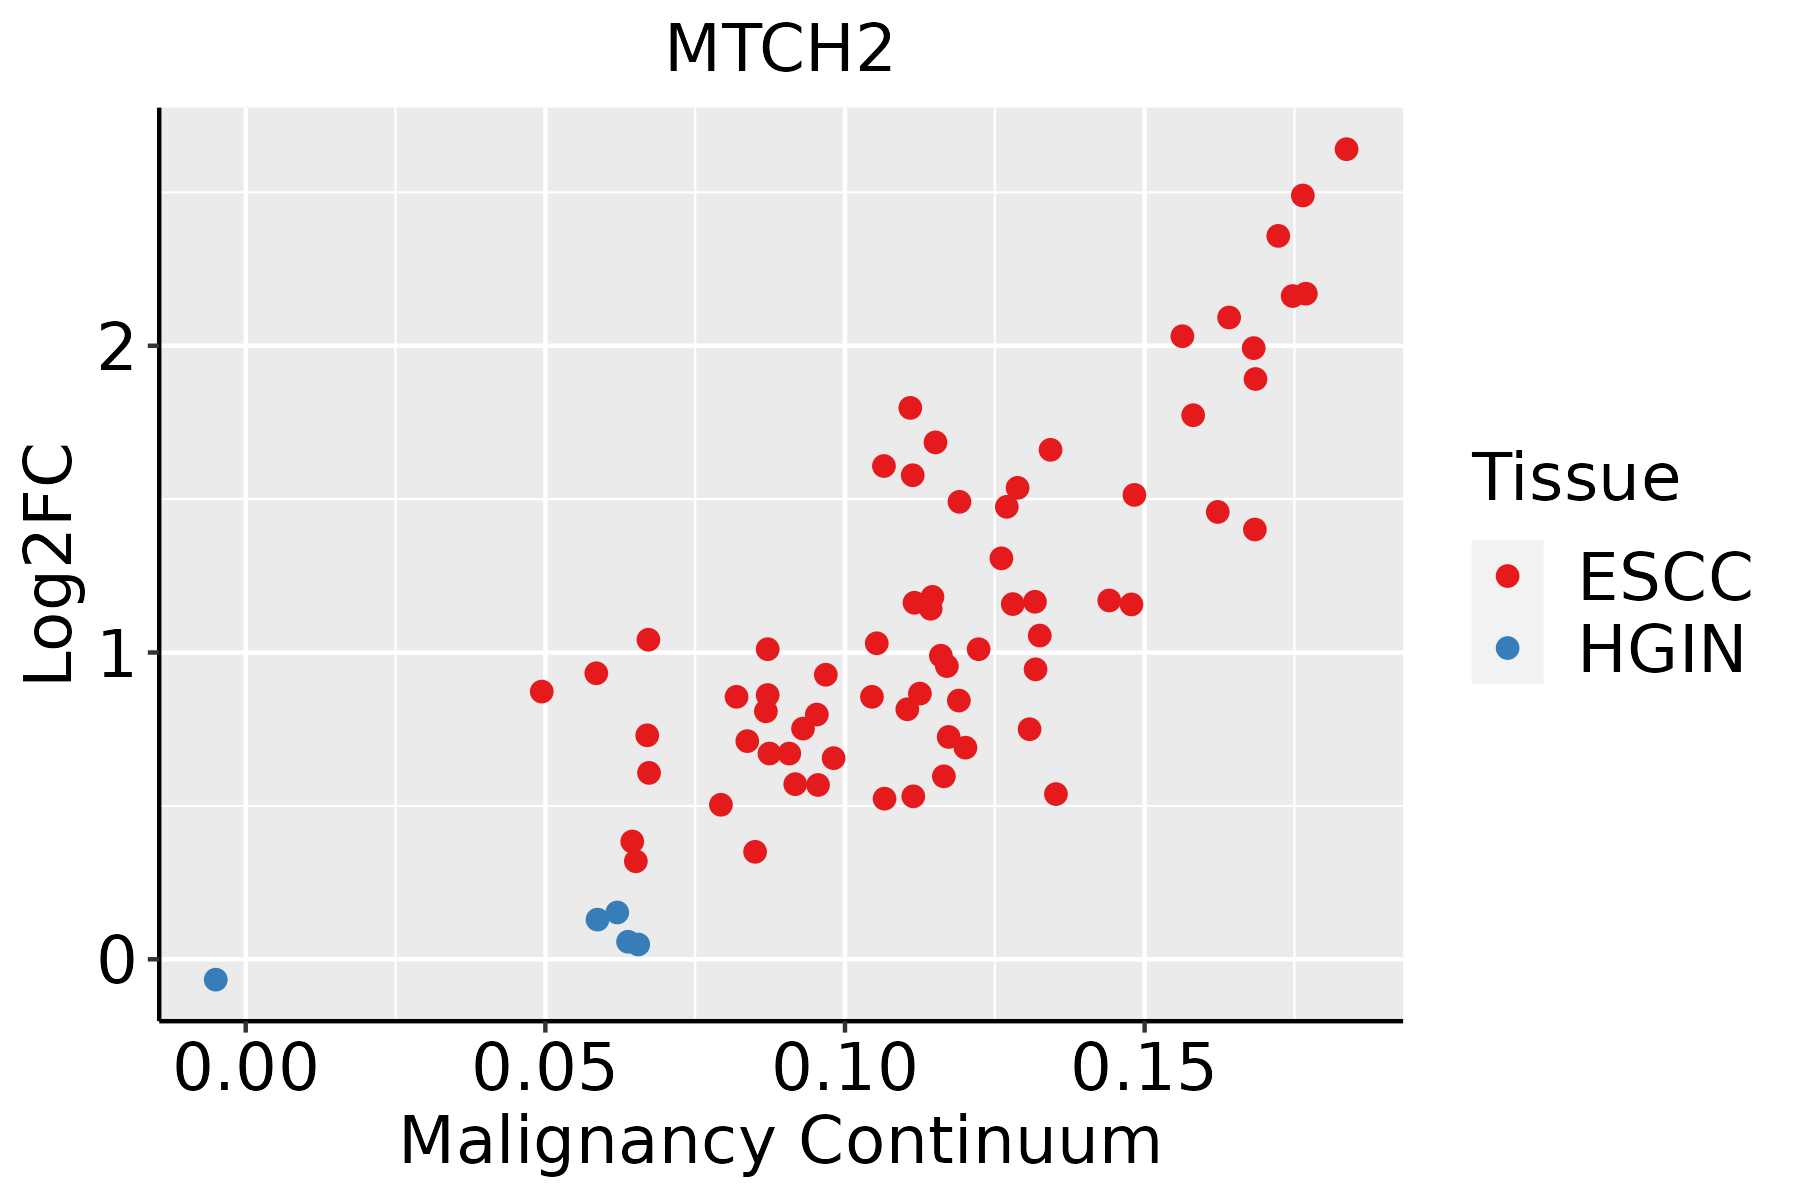 | ESCC: Esophageal squamous cell carcinoma |
| HGIN: High-grade intraepithelial neoplasias | ||
| LGIN: Low-grade intraepithelial neoplasias | ||
| Liver | 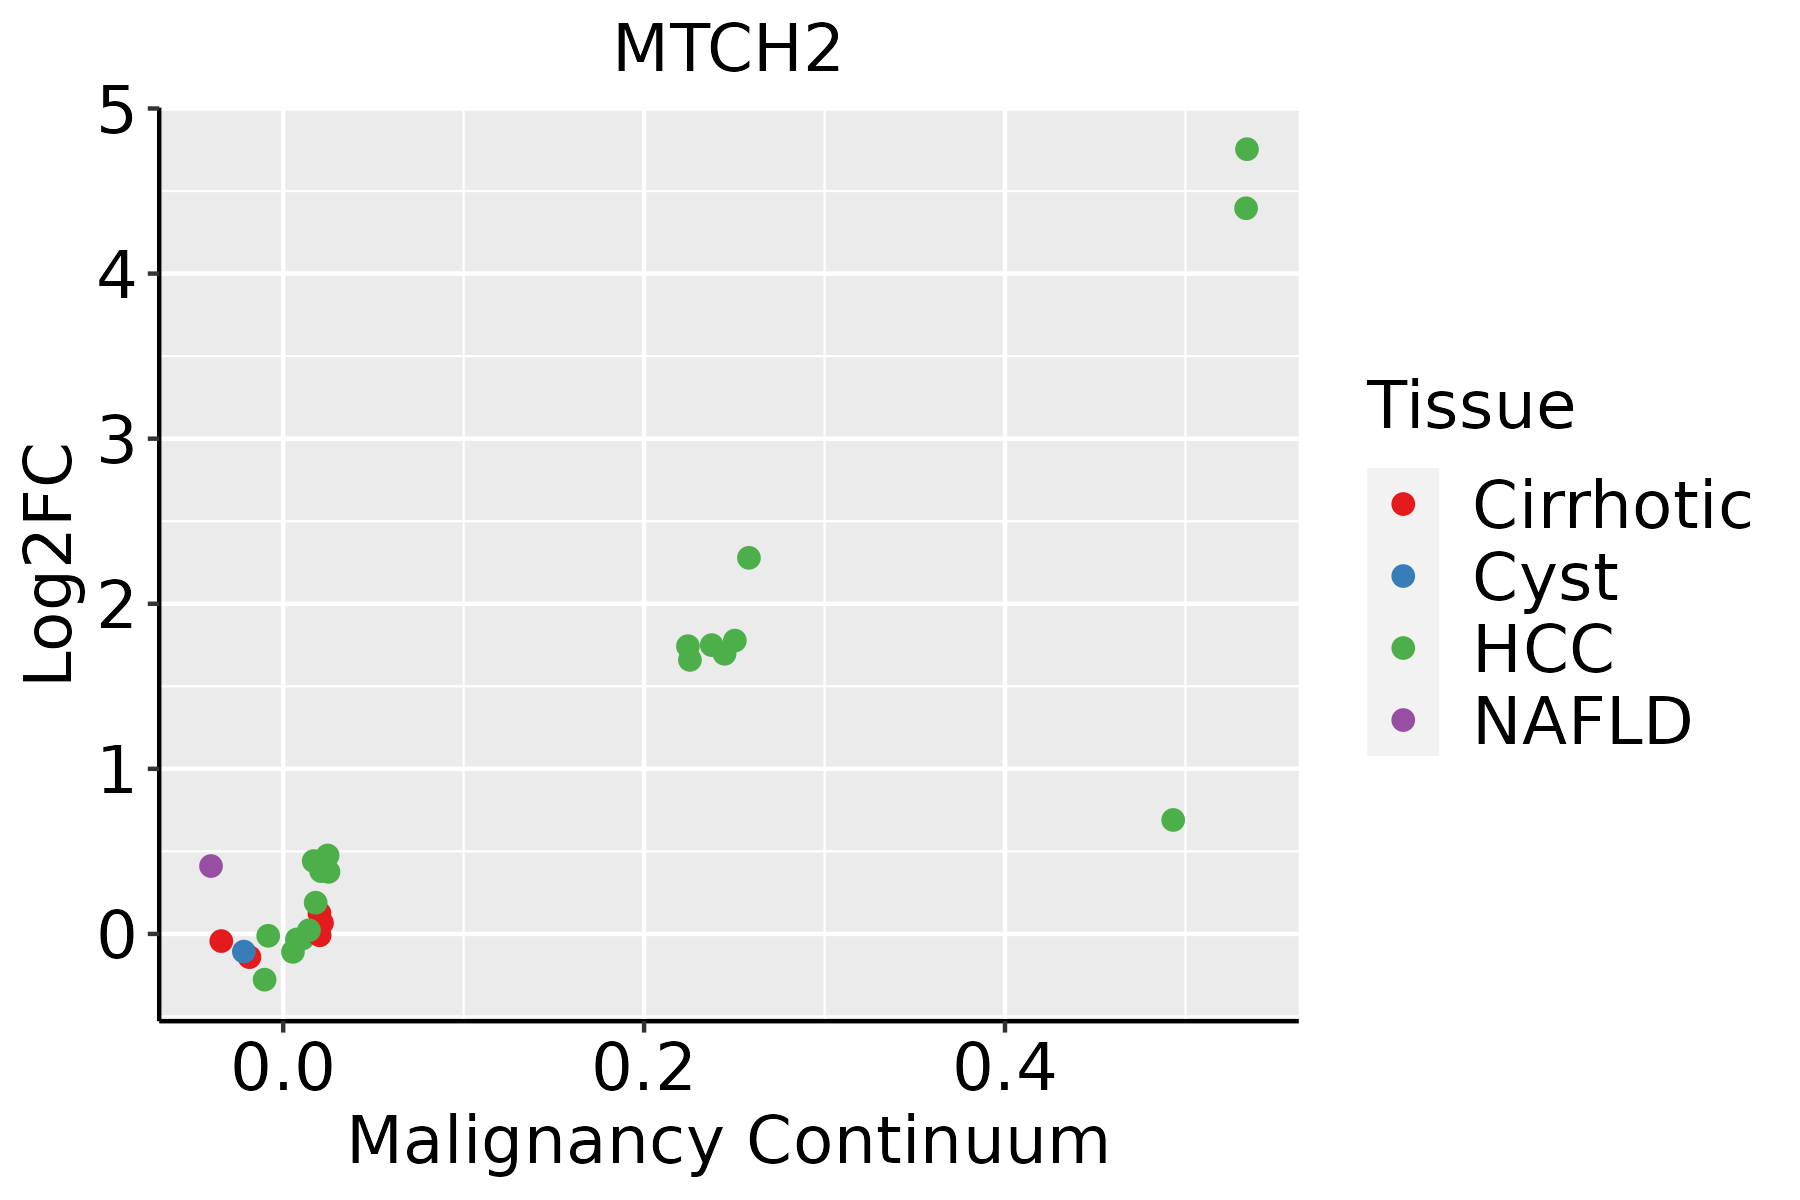 | HCC: Hepatocellular carcinoma |
| NAFLD: Non-alcoholic fatty liver disease | ||
| Oral Cavity | 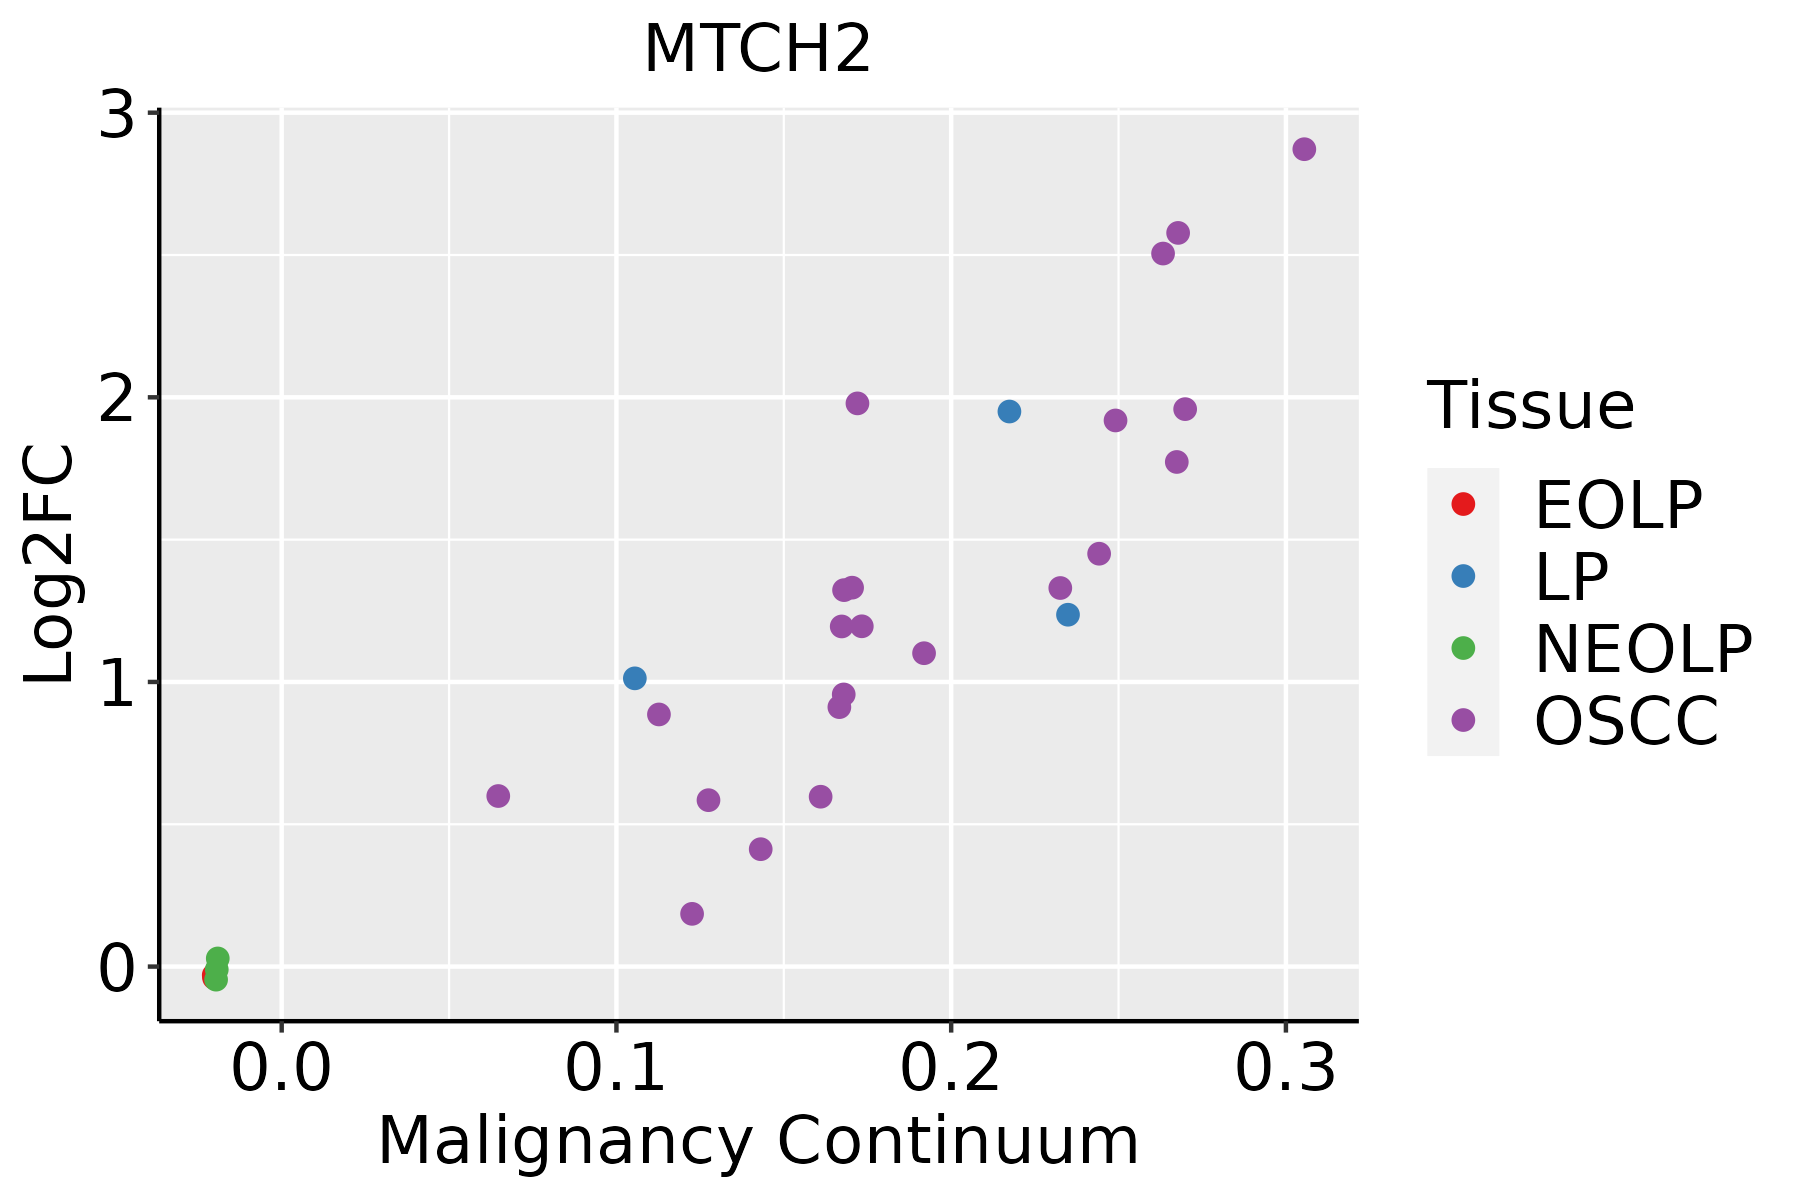 | EOLP: Erosive Oral lichen planus |
| LP: leukoplakia | ||
| NEOLP: Non-erosive oral lichen planus | ||
| OSCC: Oral squamous cell carcinoma | ||
| Prostate | 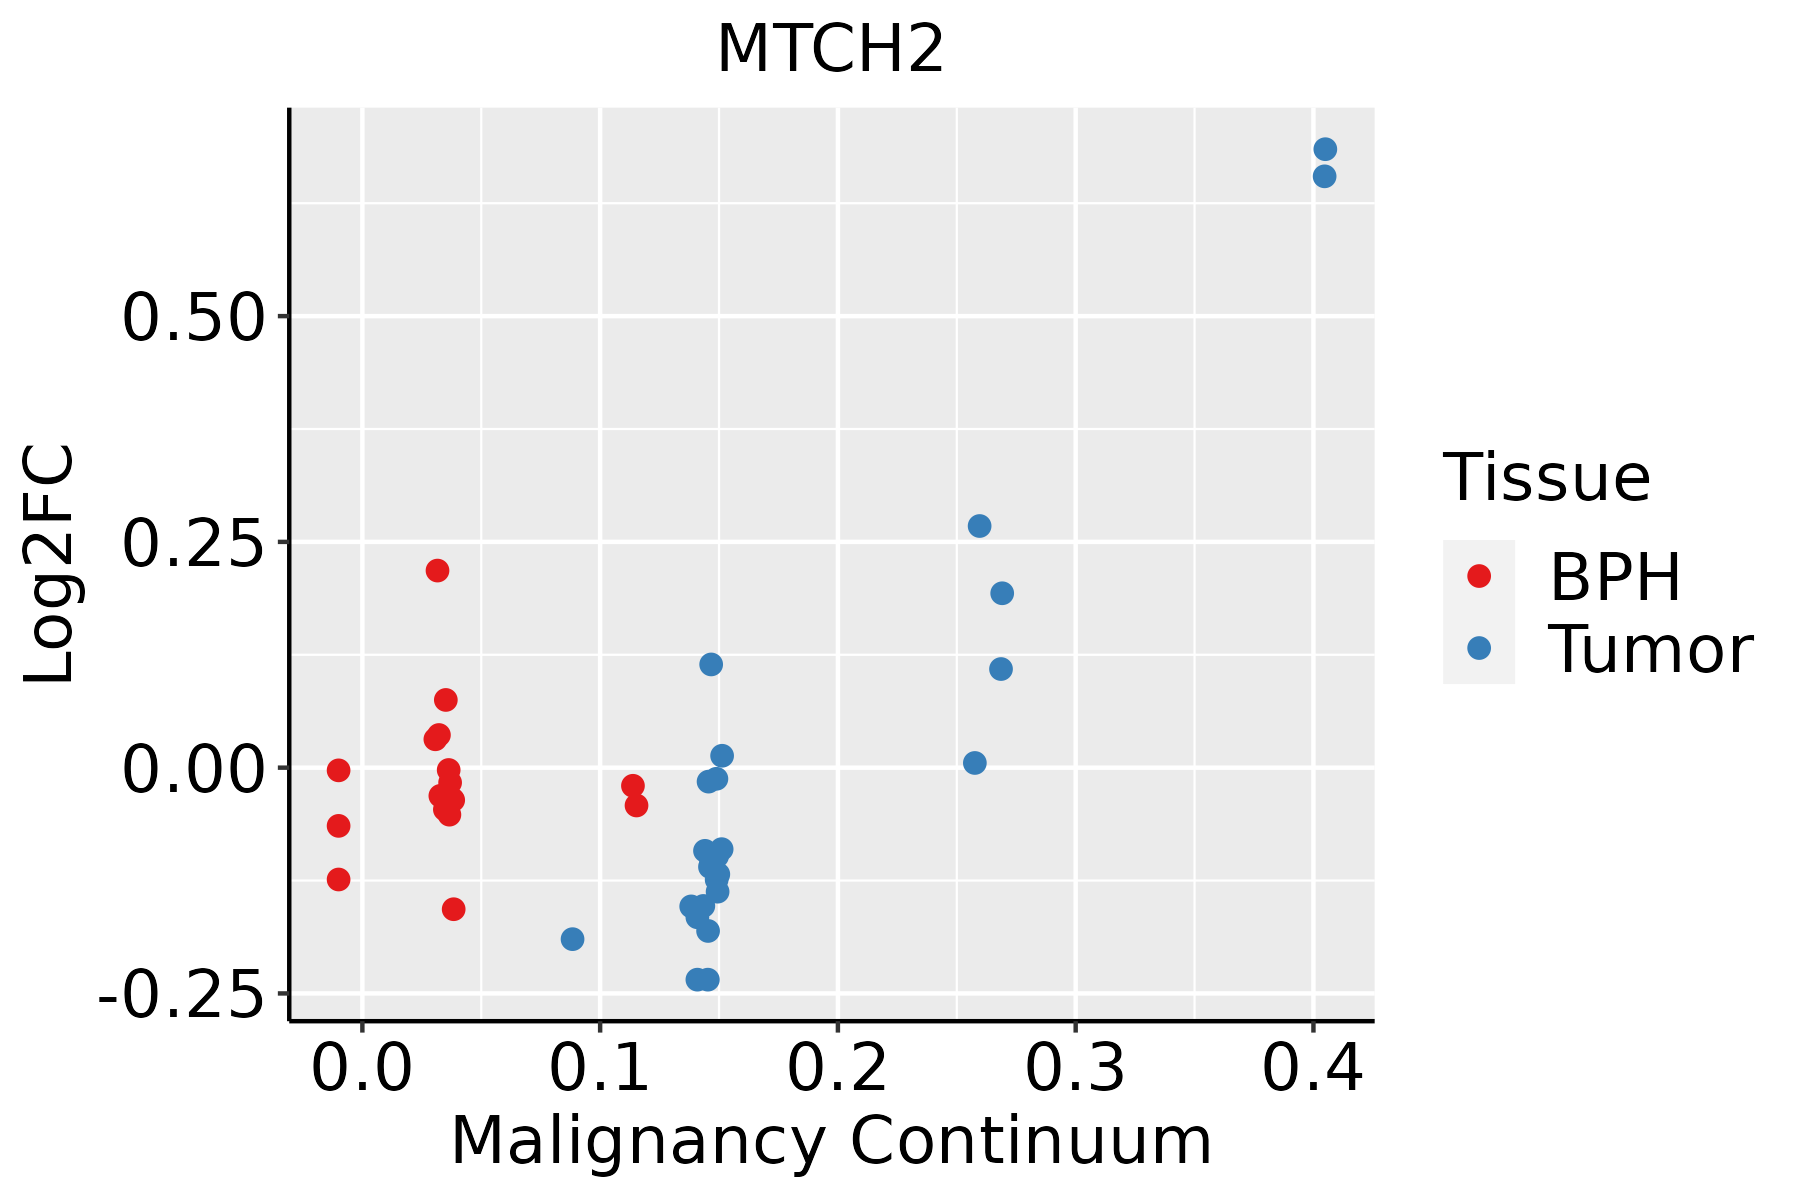 | BPH: Benign Prostatic Hyperplasia |
| Skin |  | AK: Actinic keratosis |
| cSCC: Cutaneous squamous cell carcinoma | ||
| SCCIS:squamous cell carcinoma in situ | ||
| Thyroid | 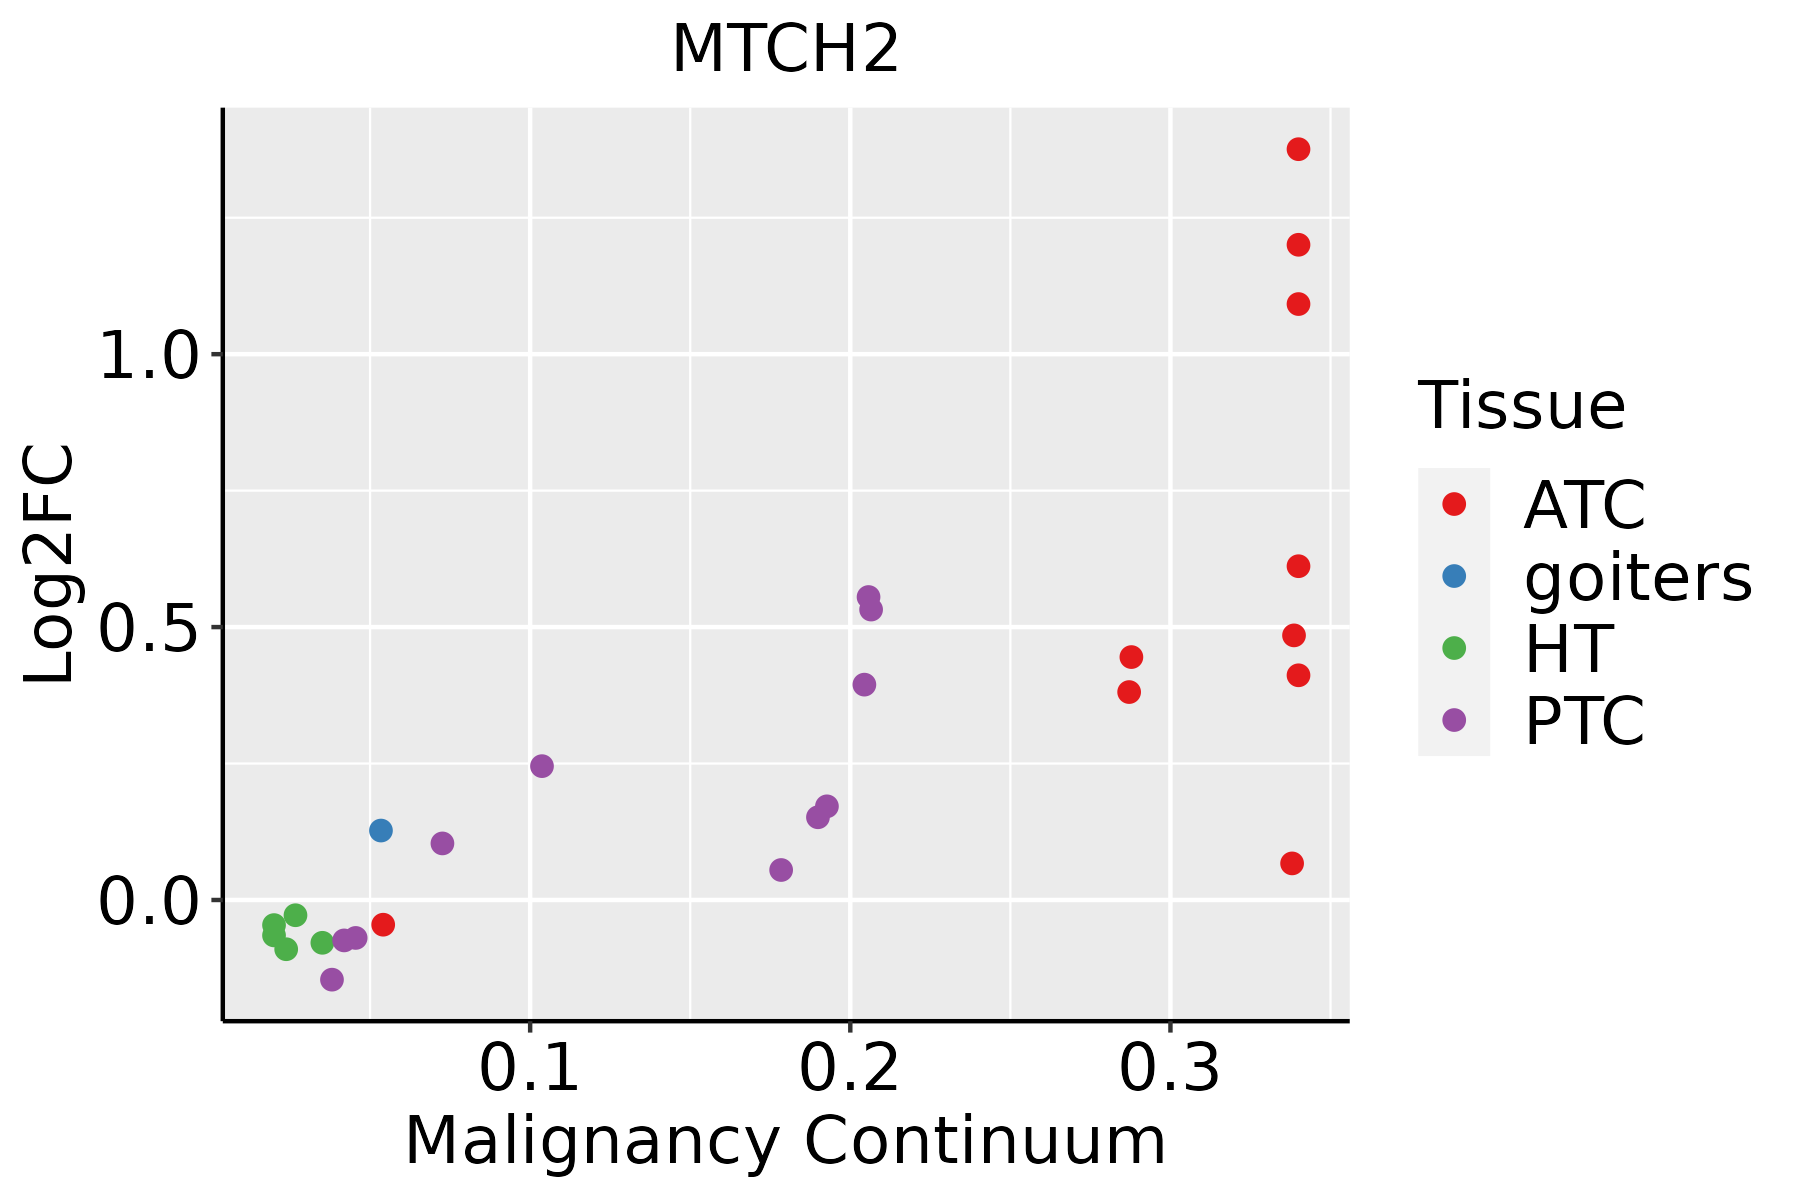 | ATC: Anaplastic thyroid cancer |
| HT: Hashimoto's thyroiditis | ||
| PTC: Papillary thyroid cancer |
| ∗log2FC in expression of this searched gene in stem-like cells from each diseased tissue sample relative to stem-like cells in normal samples in each tissue plotted against the malignancy continuum. Samples are colored based on if they are from different disease stage. |
Top |
Malignant transformation related pathway analysis |
| Find out the enriched GO biological processes and KEGG pathways involved in transition from healthy to precancer to cancer |
| Tissue | Disease Stage | Enriched GO biological Processes |
| Colorectum | AD |  |
| Colorectum | SER |  |
| Colorectum | MSS |  |
| Colorectum | MSI-H |  |
| Colorectum | FAP |  |
| ∗Top 15 enriched GO BP terms are showed in the bar plot of each disease state in each tissue. Each row represents a significant GO biological process which is colored according to the -log10(p.adjust). |
| Page: 1 2 3 4 5 6 7 8 9 |
| GO ID | Tissue | Disease Stage | Description | Gene Ratio | Bg Ratio | pvalue | p.adjust | Count |
| GO:0070585 | Colorectum | AD | protein localization to mitochondrion | 51/3918 | 125/18723 | 3.40e-07 | 1.33e-05 | 51 |
| GO:00705851 | Colorectum | SER | protein localization to mitochondrion | 42/2897 | 125/18723 | 3.75e-07 | 1.98e-05 | 42 |
| GO:00705852 | Colorectum | MSS | protein localization to mitochondrion | 47/3467 | 125/18723 | 3.98e-07 | 1.58e-05 | 47 |
| GO:007058520 | Esophagus | HGIN | protein localization to mitochondrion | 43/2587 | 125/18723 | 4.43e-09 | 3.03e-07 | 43 |
| GO:0070585110 | Esophagus | ESCC | protein localization to mitochondrion | 100/8552 | 125/18723 | 2.96e-15 | 1.77e-13 | 100 |
| GO:00705857 | Liver | Cirrhotic | protein localization to mitochondrion | 65/4634 | 125/18723 | 4.91e-11 | 2.77e-09 | 65 |
| GO:007058512 | Liver | HCC | protein localization to mitochondrion | 101/7958 | 125/18723 | 1.53e-18 | 1.86e-16 | 101 |
| GO:007058518 | Oral cavity | OSCC | protein localization to mitochondrion | 91/7305 | 125/18723 | 1.60e-14 | 9.27e-13 | 91 |
| GO:007058519 | Oral cavity | LP | protein localization to mitochondrion | 70/4623 | 125/18723 | 6.73e-14 | 7.02e-12 | 70 |
| GO:007058516 | Prostate | BPH | protein localization to mitochondrion | 43/3107 | 125/18723 | 9.29e-07 | 1.70e-05 | 43 |
| GO:007058517 | Prostate | Tumor | protein localization to mitochondrion | 47/3246 | 125/18723 | 5.20e-08 | 1.58e-06 | 47 |
| GO:007058524 | Skin | AK | protein localization to mitochondrion | 26/1910 | 125/18723 | 3.17e-04 | 3.24e-03 | 26 |
| GO:007058525 | Skin | cSCC | protein localization to mitochondrion | 74/4864 | 125/18723 | 3.95e-15 | 3.06e-13 | 74 |
| GO:0070585112 | Thyroid | PTC | protein localization to mitochondrion | 83/5968 | 125/18723 | 2.15e-15 | 1.56e-13 | 83 |
| GO:007058533 | Thyroid | ATC | protein localization to mitochondrion | 83/6293 | 125/18723 | 6.24e-14 | 3.37e-12 | 83 |
| Page: 1 |
| Pathway ID | Tissue | Disease Stage | Description | Gene Ratio | Bg Ratio | pvalue | p.adjust | qvalue | Count |
| Page: 1 |
Top |
Cell-cell communication analysis |
| Identification of potential cell-cell interactions between two cell types and their ligand-receptor pairs for different disease states |
| Ligand | Receptor | LRpair | Pathway | Tissue | Disease Stage |
| Page: 1 |
Top |
Single-cell gene regulatory network inference analysis |
| Find out the significant the regulons (TFs) and the target genes of each regulon across cell types for different disease states |
| TF | Cell Type | Tissue | Disease Stage | Target Gene | RSS | Regulon Activity |
| ∗The dot plots of a searched regulon are shown for all cell subpopulations in each disease state of each tissue based on the regulon specific score inferred using pySCENIC and by calculating the average expression. |
| Page: 1 |
Top |
Somatic mutation of malignant transformation related genes |
| Annotation of somatic variants for genes involved in malignant transformation |
| Hugo Symbol | Variant Class | Variant Classification | dbSNP RS | HGVSc | HGVSp | HGVSp Short | SWISSPROT | BIOTYPE | SIFT | PolyPhen | Tumor Sample Barcode | Tissue | Histology | Sex | Age | Stage | Therapy Types | Drugs | Outcome |
| MTCH2 | SNV | Missense_Mutation | novel | c.173N>G | p.Ala58Gly | p.A58G | Q9Y6C9 | protein_coding | deleterious(0) | benign(0.414) | TCGA-A8-A07W-01 | Breast | breast invasive carcinoma | Female | >=65 | III/IV | Hormone Therapy | exemestane | SD |
| MTCH2 | SNV | Missense_Mutation | c.645N>C | p.Met215Ile | p.M215I | Q9Y6C9 | protein_coding | tolerated(0.07) | benign(0.017) | TCGA-D8-A1JA-01 | Breast | breast invasive carcinoma | Female | <65 | III/IV | Chemotherapy | adriamycin | PD | |
| MTCH2 | SNV | Missense_Mutation | novel | c.173N>G | p.Ala58Gly | p.A58G | Q9Y6C9 | protein_coding | deleterious(0) | benign(0.414) | TCGA-E2-A15G-01 | Breast | breast invasive carcinoma | Female | >=65 | I/II | Hormone Therapy | arimidex | SD |
| MTCH2 | SNV | Missense_Mutation | rs530710316 | c.553N>T | p.Arg185Cys | p.R185C | Q9Y6C9 | protein_coding | deleterious(0.02) | probably_damaging(0.988) | TCGA-VS-A9UD-01 | Cervix | cervical & endocervical cancer | Female | >=65 | III/IV | Chemotherapy | cisplatin | CR |
| MTCH2 | insertion | Frame_Shift_Ins | novel | c.183_184insT | p.Ala62CysfsTer29 | p.A62Cfs*29 | Q9Y6C9 | protein_coding | TCGA-VS-A9UT-01 | Cervix | cervical & endocervical cancer | Female | >=65 | I/II | Unknown | Unknown | SD | ||
| MTCH2 | SNV | Missense_Mutation | c.392N>A | p.Arg131His | p.R131H | Q9Y6C9 | protein_coding | deleterious(0.01) | benign(0.149) | TCGA-A6-4105-01 | Colorectum | colon adenocarcinoma | Male | >=65 | I/II | Unknown | Unknown | PD | |
| MTCH2 | SNV | Missense_Mutation | rs749975225 | c.239N>T | p.Ser80Leu | p.S80L | Q9Y6C9 | protein_coding | deleterious(0) | possibly_damaging(0.627) | TCGA-AA-3984-01 | Colorectum | colon adenocarcinoma | Female | <65 | I/II | Unknown | Unknown | SD |
| MTCH2 | SNV | Missense_Mutation | c.583N>A | p.Leu195Met | p.L195M | Q9Y6C9 | protein_coding | tolerated(0.11) | possibly_damaging(0.588) | TCGA-AA-A010-01 | Colorectum | colon adenocarcinoma | Female | <65 | I/II | Chemotherapy | folinic | CR | |
| MTCH2 | insertion | In_Frame_Ins | novel | c.178_179insTTTCTGGTTTCTTTTGTTATGCTCTGA | p.His60delinsLeuSerGlyPhePheCysTyrAlaLeuAsn | p.H60delinsLSGFFCYALN | Q9Y6C9 | protein_coding | TCGA-G4-6317-01 | Colorectum | colon adenocarcinoma | Female | <65 | III/IV | Chemotherapy | fluorouracil | PD | ||
| MTCH2 | SNV | Missense_Mutation | rs774323410 | c.358N>A | p.Val120Ile | p.V120I | Q9Y6C9 | protein_coding | tolerated(0.06) | benign(0.2) | TCGA-AP-A056-01 | Endometrium | uterine corpus endometrioid carcinoma | Female | <65 | I/II | Unknown | Unknown | SD |
| Page: 1 2 3 |
Top |
Related drugs of malignant transformation related genes |
| Identification of chemicals and drugs interact with genes involved in malignant transfromation |
| (DGIdb 4.0) |
| Entrez ID | Symbol | Category | Interaction Types | Drug Claim Name | Drug Name | PMIDs |
| Page: 1 |

Copyright 2023-Present -The University of Texas Health Science Center at Houston |