
|
|||||
|
 | |
| |
| |
| |
| |
| |
|
Gene: MTAP |
Gene summary for MTAP |
| Gene information | Species | Human | Gene symbol | MTAP | Gene ID | 4507 |
| Gene name | methylthioadenosine phosphorylase | |
| Gene Alias | BDMF | |
| Cytomap | 9p21.3 | |
| Gene Type | protein-coding | GO ID | GO:0000096 | UniProtAcc | Q13126 |
Top |
Malignant transformation analysis |
| Identification of the aberrant gene expression in precancerous and cancerous lesions by comparing the gene expression of stem-like cells in diseased tissues with normal stem cells |
| Entrez ID | Symbol | Replicates | Species | Organ | Tissue | Adj P-value | Log2FC | Malignancy |
| 4507 | MTAP | LZE4T | Human | Esophagus | ESCC | 5.69e-07 | 2.28e-01 | 0.0811 |
| 4507 | MTAP | LZE7T | Human | Esophagus | ESCC | 3.39e-06 | 4.94e-01 | 0.0667 |
| 4507 | MTAP | LZE20T | Human | Esophagus | ESCC | 8.15e-05 | 1.08e-01 | 0.0662 |
| 4507 | MTAP | LZE24T | Human | Esophagus | ESCC | 1.24e-14 | 3.49e-01 | 0.0596 |
| 4507 | MTAP | LZE21T | Human | Esophagus | ESCC | 1.12e-03 | 2.97e-01 | 0.0655 |
| 4507 | MTAP | P2T-E | Human | Esophagus | ESCC | 5.76e-19 | 2.91e-01 | 0.1177 |
| 4507 | MTAP | P4T-E | Human | Esophagus | ESCC | 6.98e-07 | 1.39e-01 | 0.1323 |
| 4507 | MTAP | P11T-E | Human | Esophagus | ESCC | 3.58e-15 | 1.16e+00 | 0.1426 |
| 4507 | MTAP | P15T-E | Human | Esophagus | ESCC | 4.67e-06 | 1.32e-01 | 0.1149 |
| 4507 | MTAP | P16T-E | Human | Esophagus | ESCC | 5.13e-07 | 1.04e-01 | 0.1153 |
| 4507 | MTAP | P21T-E | Human | Esophagus | ESCC | 1.90e-16 | 2.33e-01 | 0.1617 |
| 4507 | MTAP | P22T-E | Human | Esophagus | ESCC | 1.42e-18 | 7.71e-02 | 0.1236 |
| 4507 | MTAP | P23T-E | Human | Esophagus | ESCC | 1.12e-13 | 2.91e-01 | 0.108 |
| 4507 | MTAP | P24T-E | Human | Esophagus | ESCC | 2.84e-13 | 5.52e-02 | 0.1287 |
| 4507 | MTAP | P26T-E | Human | Esophagus | ESCC | 2.95e-17 | 2.27e-01 | 0.1276 |
| 4507 | MTAP | P27T-E | Human | Esophagus | ESCC | 7.53e-12 | 9.29e-02 | 0.1055 |
| 4507 | MTAP | P28T-E | Human | Esophagus | ESCC | 4.97e-28 | 4.97e-01 | 0.1149 |
| 4507 | MTAP | P30T-E | Human | Esophagus | ESCC | 4.21e-04 | 1.16e-01 | 0.137 |
| 4507 | MTAP | P32T-E | Human | Esophagus | ESCC | 6.08e-11 | 2.29e-01 | 0.1666 |
| 4507 | MTAP | P36T-E | Human | Esophagus | ESCC | 1.93e-08 | 2.79e-01 | 0.1187 |
| Page: 1 2 3 4 5 6 |
| Tissue | Expression Dynamics | Abbreviation |
| Esophagus | 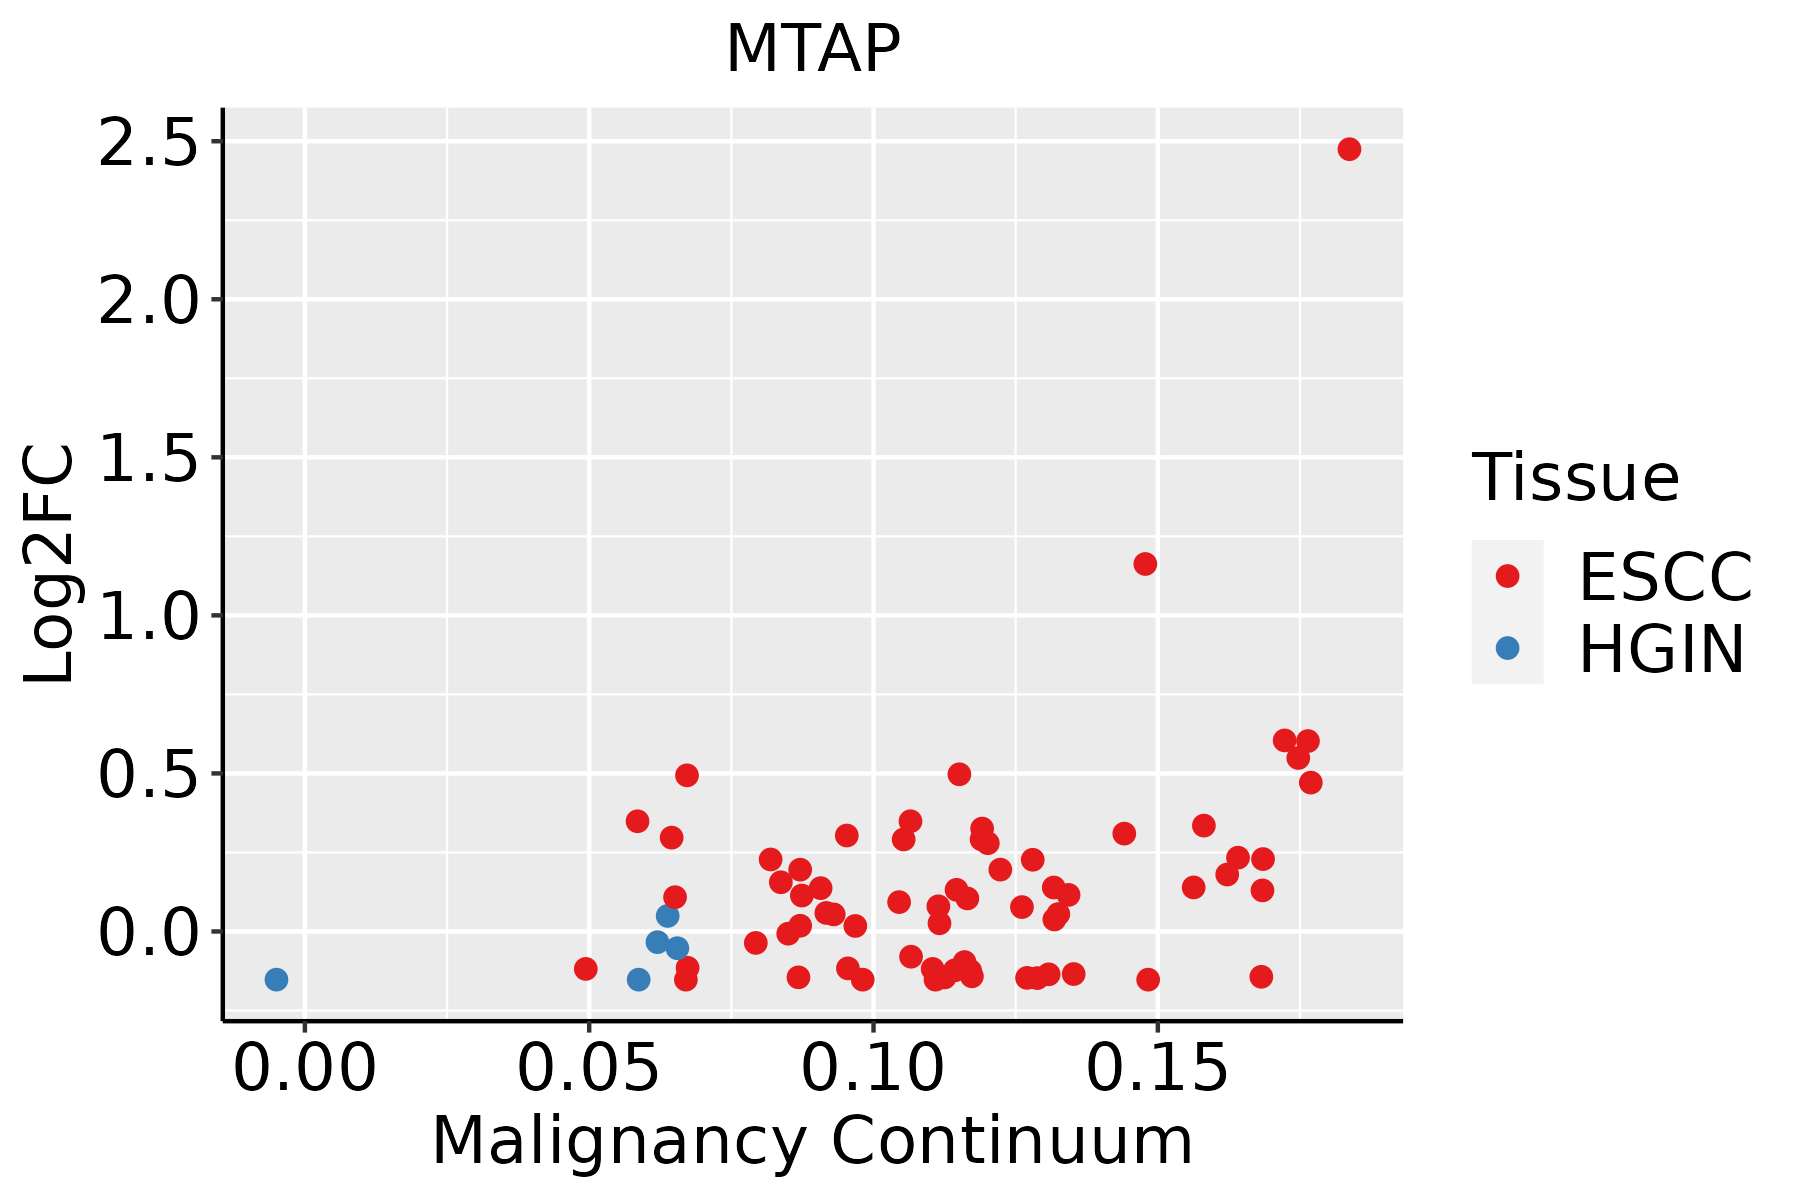 | ESCC: Esophageal squamous cell carcinoma |
| HGIN: High-grade intraepithelial neoplasias | ||
| LGIN: Low-grade intraepithelial neoplasias | ||
| Liver | 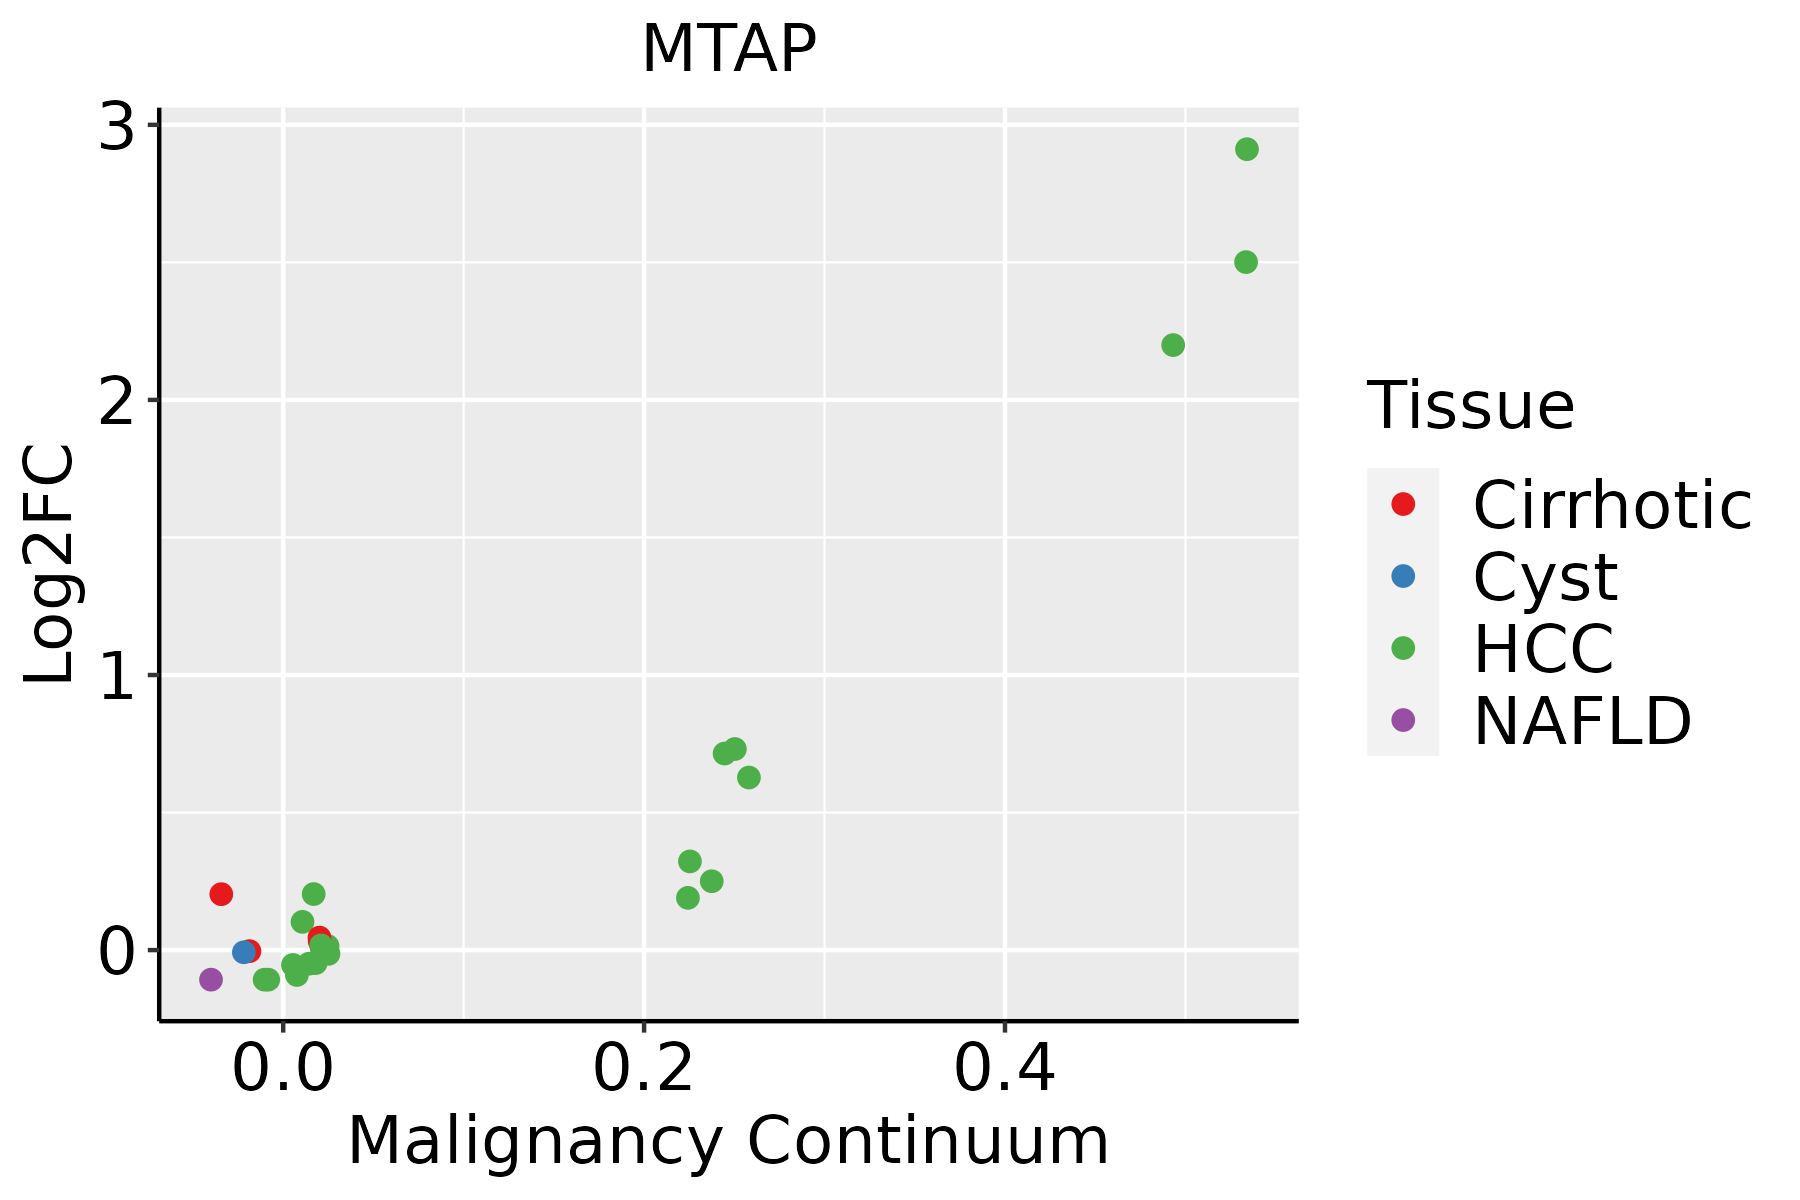 | HCC: Hepatocellular carcinoma |
| NAFLD: Non-alcoholic fatty liver disease | ||
| Lung |  | AAH: Atypical adenomatous hyperplasia |
| AIS: Adenocarcinoma in situ | ||
| IAC: Invasive lung adenocarcinoma | ||
| MIA: Minimally invasive adenocarcinoma | ||
| Oral Cavity | 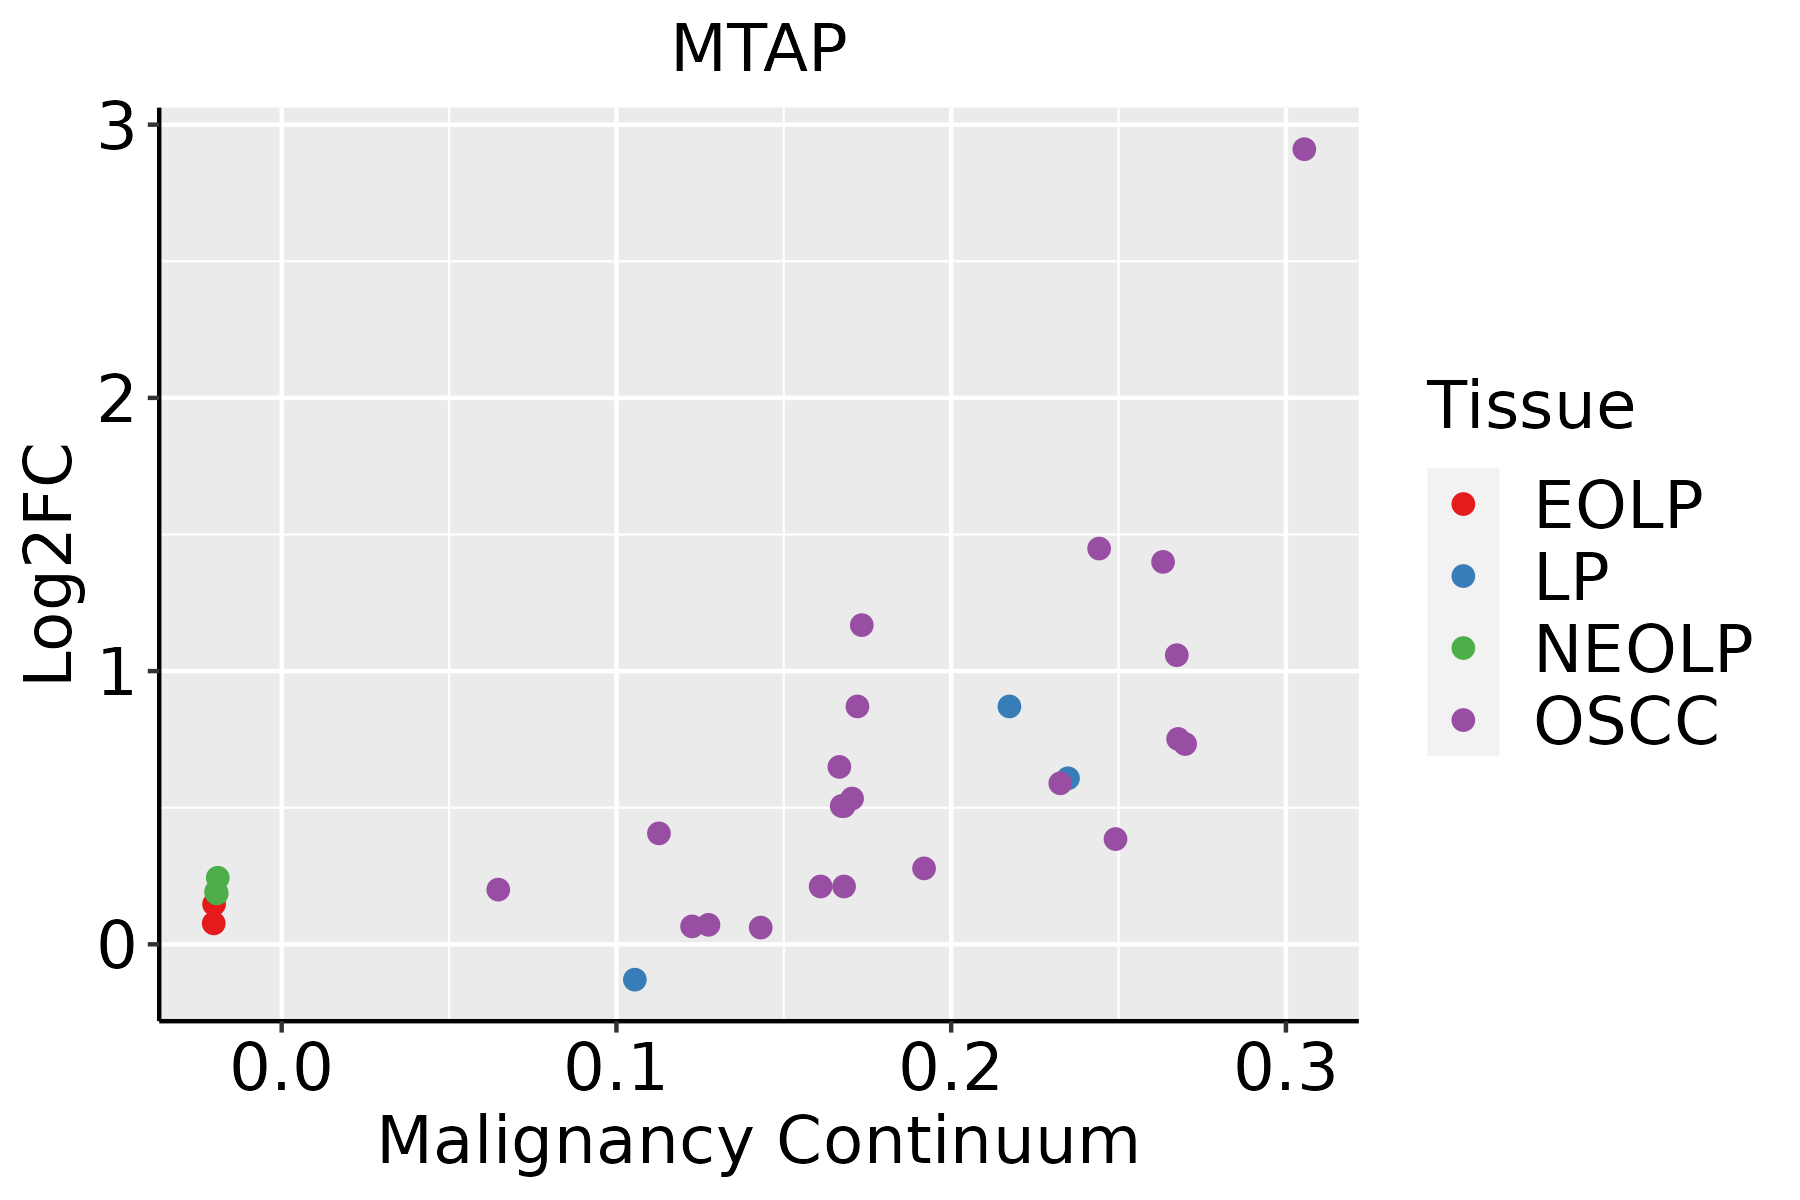 | EOLP: Erosive Oral lichen planus |
| LP: leukoplakia | ||
| NEOLP: Non-erosive oral lichen planus | ||
| OSCC: Oral squamous cell carcinoma | ||
| Prostate | 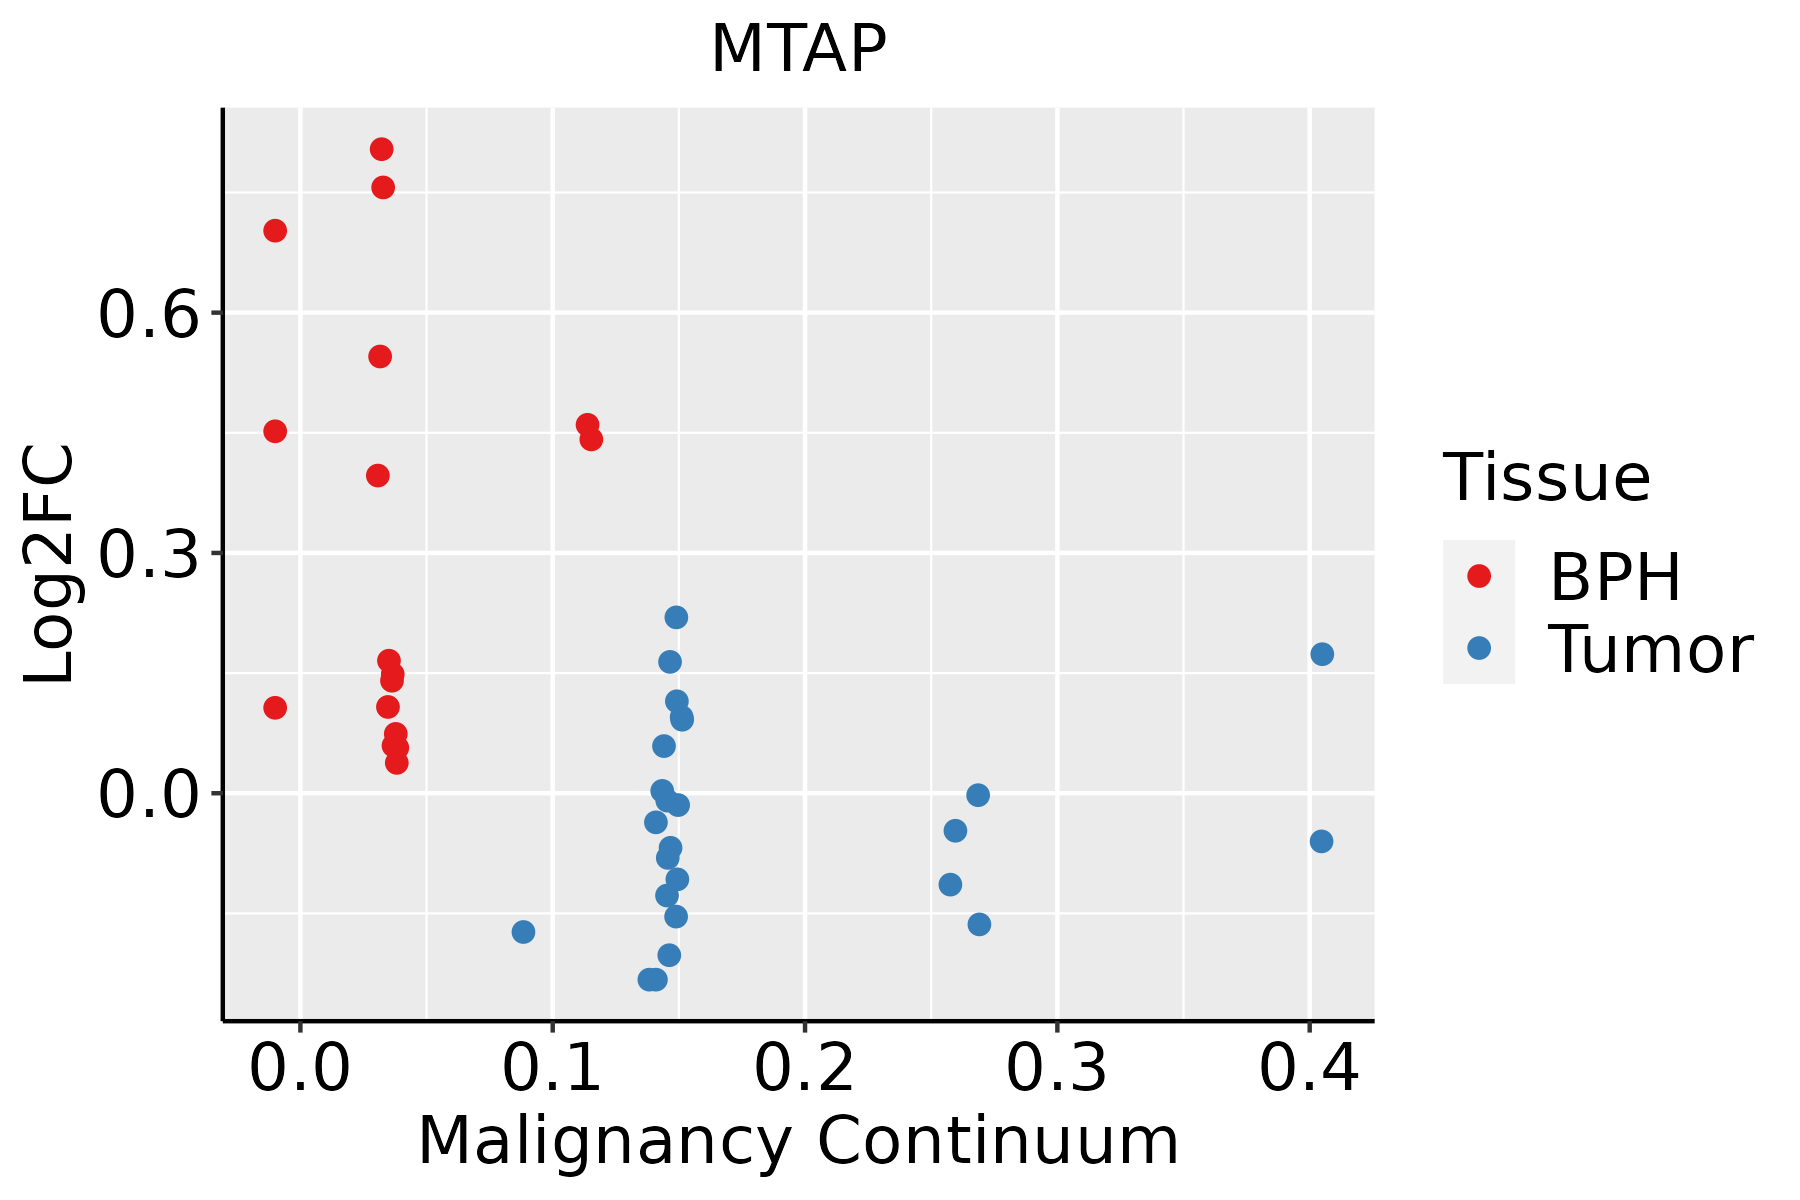 | BPH: Benign Prostatic Hyperplasia |
| Skin |  | AK: Actinic keratosis |
| cSCC: Cutaneous squamous cell carcinoma | ||
| SCCIS:squamous cell carcinoma in situ | ||
| Thyroid | 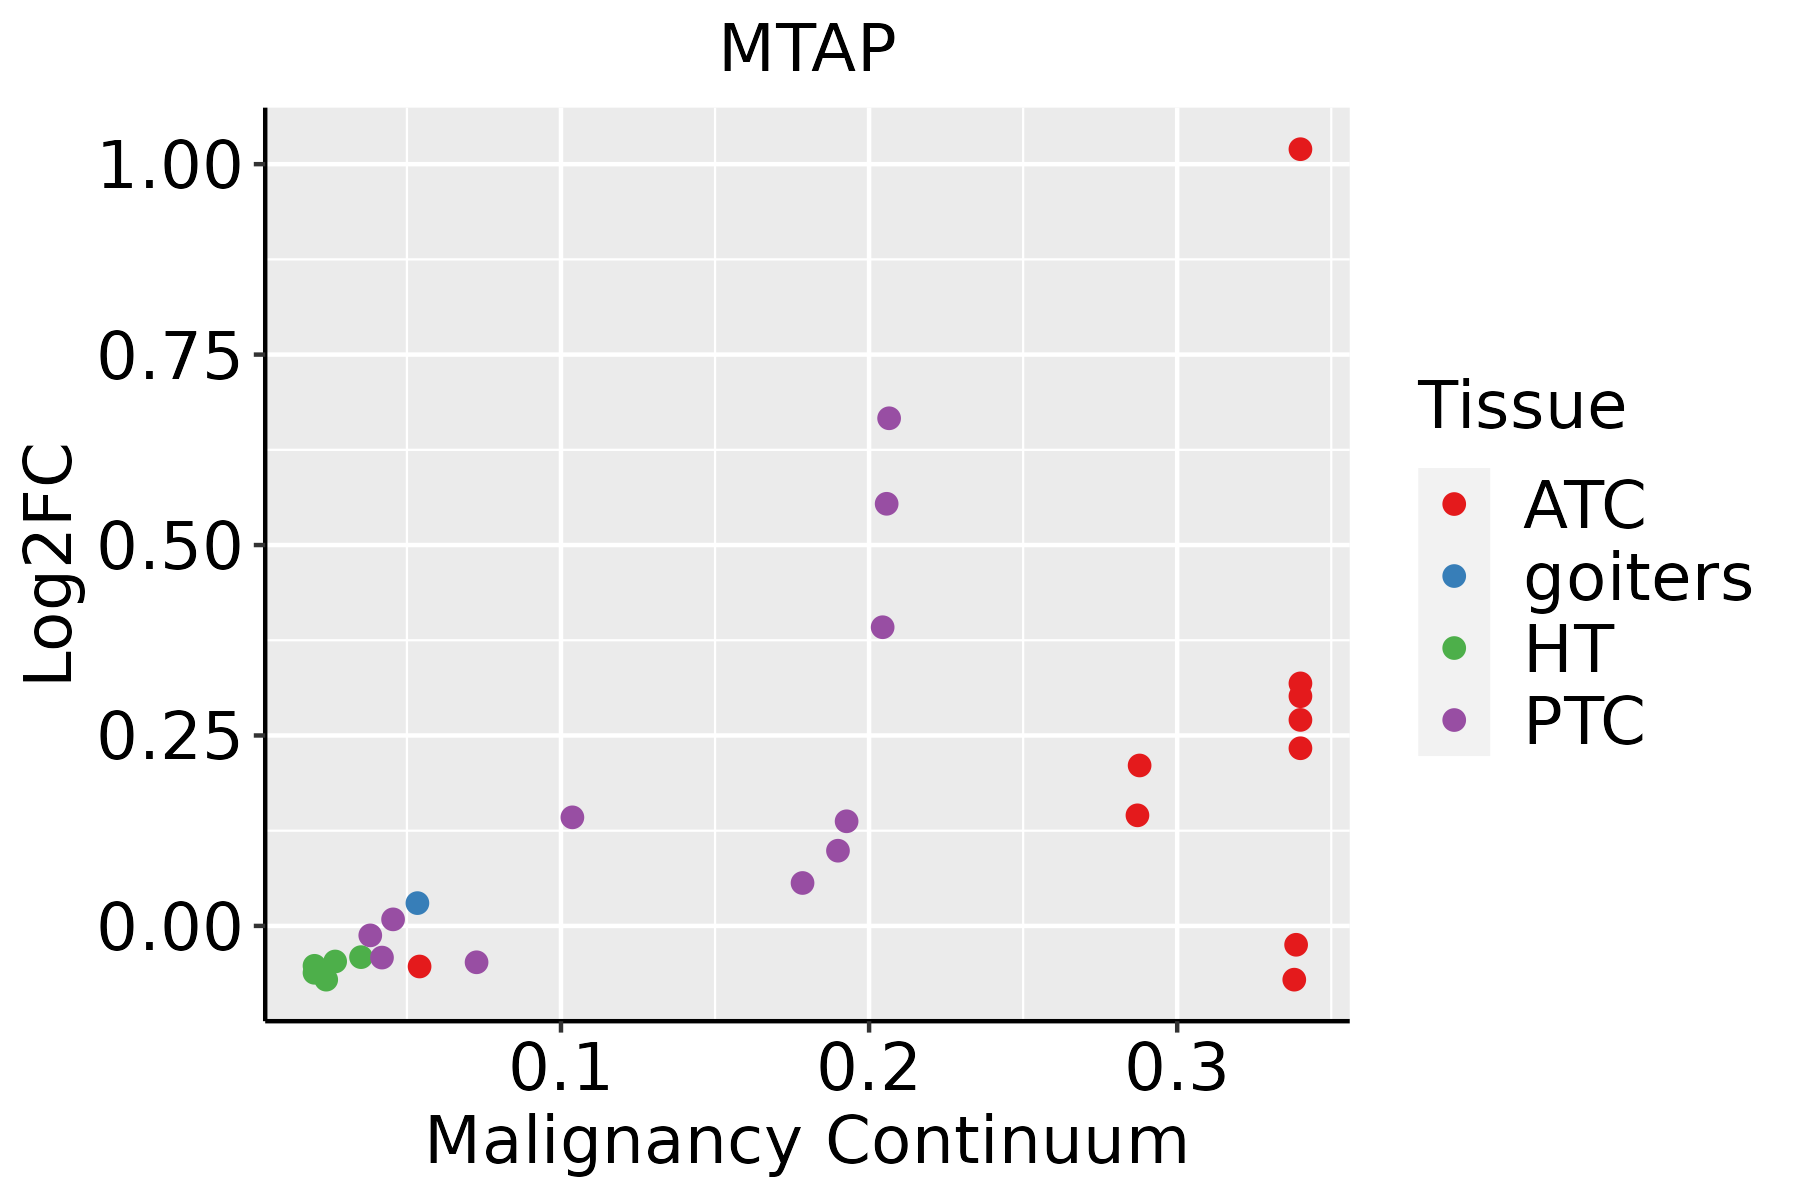 | ATC: Anaplastic thyroid cancer |
| HT: Hashimoto's thyroiditis | ||
| PTC: Papillary thyroid cancer |
| ∗log2FC in expression of this searched gene in stem-like cells from each diseased tissue sample relative to stem-like cells in normal samples in each tissue plotted against the malignancy continuum. Samples are colored based on if they are from different disease stage. |
Top |
Malignant transformation related pathway analysis |
| Find out the enriched GO biological processes and KEGG pathways involved in transition from healthy to precancer to cancer |
| Tissue | Disease Stage | Enriched GO biological Processes |
| Colorectum | AD |  |
| Colorectum | SER |  |
| Colorectum | MSS |  |
| Colorectum | MSI-H |  |
| Colorectum | FAP |  |
| ∗Top 15 enriched GO BP terms are showed in the bar plot of each disease state in each tissue. Each row represents a significant GO biological process which is colored according to the -log10(p.adjust). |
| Page: 1 2 3 4 5 6 7 8 9 |
| GO ID | Tissue | Disease Stage | Description | Gene Ratio | Bg Ratio | pvalue | p.adjust | Count |
| GO:00322592 | Esophagus | ESCC | methylation | 222/8552 | 364/18723 | 2.26e-09 | 5.09e-08 | 222 |
| GO:00067906 | Esophagus | ESCC | sulfur compound metabolic process | 201/8552 | 339/18723 | 2.64e-07 | 3.94e-06 | 201 |
| GO:0072521111 | Esophagus | ESCC | purine-containing compound metabolic process | 238/8552 | 416/18723 | 1.20e-06 | 1.49e-05 | 238 |
| GO:00442725 | Esophagus | ESCC | sulfur compound biosynthetic process | 96/8552 | 148/18723 | 1.86e-06 | 2.16e-05 | 96 |
| GO:1901654111 | Esophagus | ESCC | response to ketone | 118/8552 | 194/18723 | 1.45e-05 | 1.31e-04 | 118 |
| GO:007252217 | Esophagus | ESCC | purine-containing compound biosynthetic process | 120/8552 | 200/18723 | 3.02e-05 | 2.51e-04 | 120 |
| GO:00086525 | Esophagus | ESCC | cellular amino acid biosynthetic process | 51/8552 | 76/18723 | 1.30e-04 | 8.88e-04 | 51 |
| GO:00463948 | Esophagus | ESCC | carboxylic acid biosynthetic process | 175/8552 | 314/18723 | 1.98e-04 | 1.26e-03 | 175 |
| GO:19016574 | Esophagus | ESCC | glycosyl compound metabolic process | 57/8552 | 88/18723 | 2.32e-04 | 1.44e-03 | 57 |
| GO:00160538 | Esophagus | ESCC | organic acid biosynthetic process | 175/8552 | 316/18723 | 3.04e-04 | 1.82e-03 | 175 |
| GO:19016075 | Esophagus | ESCC | alpha-amino acid biosynthetic process | 45/8552 | 68/18723 | 5.13e-04 | 2.84e-03 | 45 |
| GO:00090674 | Esophagus | ESCC | aspartate family amino acid biosynthetic process | 17/8552 | 21/18723 | 1.03e-03 | 5.19e-03 | 17 |
| GO:003357415 | Esophagus | ESCC | response to testosterone | 29/8552 | 42/18723 | 1.87e-03 | 8.46e-03 | 29 |
| GO:00091163 | Esophagus | ESCC | nucleoside metabolic process | 39/8552 | 62/18723 | 4.68e-03 | 1.82e-02 | 39 |
| GO:00090862 | Esophagus | ESCC | methionine biosynthetic process | 10/8552 | 12/18723 | 8.94e-03 | 3.12e-02 | 10 |
| GO:00430941 | Esophagus | ESCC | cellular metabolic compound salvage | 18/8552 | 26/18723 | 1.32e-02 | 4.31e-02 | 18 |
| GO:001605321 | Liver | HCC | organic acid biosynthetic process | 200/7958 | 316/18723 | 5.24e-14 | 3.22e-12 | 200 |
| GO:000679021 | Liver | HCC | sulfur compound metabolic process | 212/7958 | 339/18723 | 5.60e-14 | 3.39e-12 | 212 |
| GO:004639421 | Liver | HCC | carboxylic acid biosynthetic process | 198/7958 | 314/18723 | 1.19e-13 | 6.78e-12 | 198 |
| GO:007252122 | Liver | HCC | purine-containing compound metabolic process | 250/7958 | 416/18723 | 2.26e-13 | 1.24e-11 | 250 |
| Page: 1 2 3 4 5 6 |
| Pathway ID | Tissue | Disease Stage | Description | Gene Ratio | Bg Ratio | pvalue | p.adjust | qvalue | Count |
| hsa002702 | Liver | HCC | Cysteine and methionine metabolism | 35/4020 | 52/8465 | 3.03e-03 | 9.94e-03 | 5.53e-03 | 35 |
| hsa002703 | Liver | HCC | Cysteine and methionine metabolism | 35/4020 | 52/8465 | 3.03e-03 | 9.94e-03 | 5.53e-03 | 35 |
| Page: 1 |
Top |
Cell-cell communication analysis |
| Identification of potential cell-cell interactions between two cell types and their ligand-receptor pairs for different disease states |
| Ligand | Receptor | LRpair | Pathway | Tissue | Disease Stage |
| Page: 1 |
Top |
Single-cell gene regulatory network inference analysis |
| Find out the significant the regulons (TFs) and the target genes of each regulon across cell types for different disease states |
| TF | Cell Type | Tissue | Disease Stage | Target Gene | RSS | Regulon Activity |
| ∗The dot plots of a searched regulon are shown for all cell subpopulations in each disease state of each tissue based on the regulon specific score inferred using pySCENIC and by calculating the average expression. |
| Page: 1 |
Top |
Somatic mutation of malignant transformation related genes |
| Annotation of somatic variants for genes involved in malignant transformation |
| Hugo Symbol | Variant Class | Variant Classification | dbSNP RS | HGVSc | HGVSp | HGVSp Short | SWISSPROT | BIOTYPE | SIFT | PolyPhen | Tumor Sample Barcode | Tissue | Histology | Sex | Age | Stage | Therapy Types | Drugs | Outcome |
| MTAP | SNV | Missense_Mutation | novel | c.796A>C | p.Thr266Pro | p.T266P | Q13126 | protein_coding | tolerated(0.15) | possibly_damaging(0.491) | TCGA-AR-A1AP-01 | Breast | breast invasive carcinoma | Female | >=65 | I/II | Hormone Therapy | anastrozole | SD |
| MTAP | SNV | Missense_Mutation | novel | c.796N>C | p.Thr266Pro | p.T266P | Q13126 | protein_coding | tolerated(0.15) | possibly_damaging(0.491) | TCGA-BH-A0BR-01 | Breast | breast invasive carcinoma | Female | <65 | I/II | Unknown | Unknown | SD |
| MTAP | SNV | Missense_Mutation | novel | c.610N>T | p.Leu204Phe | p.L204F | Q13126 | protein_coding | deleterious(0) | probably_damaging(0.998) | TCGA-E9-A1R4-01 | Breast | breast invasive carcinoma | Female | >=65 | I/II | Chemotherapy | 5-fluorouracil | SD |
| MTAP | SNV | Missense_Mutation | rs200708704 | c.572N>T | p.Ala191Val | p.A191V | Q13126 | protein_coding | deleterious(0.02) | possibly_damaging(0.77) | TCGA-G4-6304-01 | Colorectum | colon adenocarcinoma | Female | >=65 | I/II | Chemotherapy | fluorouracil | PD |
| MTAP | SNV | Missense_Mutation | novel | c.819N>A | p.Met273Ile | p.M273I | Q13126 | protein_coding | tolerated(0.45) | benign(0.003) | TCGA-NH-A6GB-01 | Colorectum | colon adenocarcinoma | Female | >=65 | III/IV | Chemotherapy | oxaliplatin | SD |
| MTAP | SNV | Missense_Mutation | c.508N>A | p.Val170Ile | p.V170I | Q13126 | protein_coding | tolerated(0.43) | benign(0.007) | TCGA-AP-A051-01 | Endometrium | uterine corpus endometrioid carcinoma | Female | >=65 | I/II | Unknown | Unknown | SD | |
| MTAP | SNV | Missense_Mutation | novel | c.319N>C | p.Ile107Leu | p.I107L | Q13126 | protein_coding | tolerated(1) | benign(0) | TCGA-AP-A0LS-01 | Endometrium | uterine corpus endometrioid carcinoma | Female | <65 | I/II | Unknown | Unknown | SD |
| MTAP | SNV | Missense_Mutation | novel | c.316N>A | p.Asp106Asn | p.D106N | Q13126 | protein_coding | deleterious(0.03) | benign(0.34) | TCGA-AP-A1E0-01 | Endometrium | uterine corpus endometrioid carcinoma | Female | <65 | III/IV | Chemotherapy | paclitaxel | SD |
| MTAP | SNV | Missense_Mutation | c.527G>A | p.Arg176His | p.R176H | Q13126 | protein_coding | deleterious(0) | probably_damaging(0.995) | TCGA-B5-A3FC-01 | Endometrium | uterine corpus endometrioid carcinoma | Female | <65 | I/II | Unknown | Unknown | SD | |
| MTAP | SNV | Missense_Mutation | novel | c.125C>A | p.Ser42Tyr | p.S42Y | Q13126 | protein_coding | deleterious(0) | probably_damaging(0.998) | TCGA-BS-A0UV-01 | Endometrium | uterine corpus endometrioid carcinoma | Female | <65 | III/IV | Unknown | Unknown | SD |
| Page: 1 2 3 |
Top |
Related drugs of malignant transformation related genes |
| Identification of chemicals and drugs interact with genes involved in malignant transfromation |
| (DGIdb 4.0) |
| Entrez ID | Symbol | Category | Interaction Types | Drug Claim Name | Drug Name | PMIDs |
| 4507 | MTAP | DRUGGABLE GENOME, ENZYME, CLINICALLY ACTIONABLE | L-ALANOSINE | ALANOSINE | 16505107 | |
| 4507 | MTAP | DRUGGABLE GENOME, ENZYME, CLINICALLY ACTIONABLE | DIFLUOROMETHYLORNITHINE | 15534104 |
| Page: 1 |

Copyright 2023-Present -The University of Texas Health Science Center at Houston |