
|
|||||
|
 | |
| |
| |
| |
| |
| |
|
Gene: MTA2 |
Gene summary for MTA2 |
| Gene information | Species | Human | Gene symbol | MTA2 | Gene ID | 9219 |
| Gene name | metastasis associated 1 family member 2 | |
| Gene Alias | MTA1L1 | |
| Cytomap | 11q12.3 | |
| Gene Type | protein-coding | GO ID | GO:0000122 | UniProtAcc | O94776 |
Top |
Malignant transformation analysis |
| Identification of the aberrant gene expression in precancerous and cancerous lesions by comparing the gene expression of stem-like cells in diseased tissues with normal stem cells |
| Entrez ID | Symbol | Replicates | Species | Organ | Tissue | Adj P-value | Log2FC | Malignancy |
| 9219 | MTA2 | LZE7T | Human | Esophagus | ESCC | 6.25e-03 | 1.37e-01 | 0.0667 |
| 9219 | MTA2 | LZE22T | Human | Esophagus | ESCC | 1.41e-03 | 1.75e-01 | 0.068 |
| 9219 | MTA2 | LZE24T | Human | Esophagus | ESCC | 7.02e-20 | 3.27e-01 | 0.0596 |
| 9219 | MTA2 | P1T-E | Human | Esophagus | ESCC | 6.15e-07 | 2.19e-01 | 0.0875 |
| 9219 | MTA2 | P2T-E | Human | Esophagus | ESCC | 1.44e-24 | 5.29e-01 | 0.1177 |
| 9219 | MTA2 | P4T-E | Human | Esophagus | ESCC | 4.23e-17 | 5.33e-01 | 0.1323 |
| 9219 | MTA2 | P5T-E | Human | Esophagus | ESCC | 4.10e-07 | 1.61e-01 | 0.1327 |
| 9219 | MTA2 | P8T-E | Human | Esophagus | ESCC | 4.45e-22 | 4.11e-01 | 0.0889 |
| 9219 | MTA2 | P9T-E | Human | Esophagus | ESCC | 1.28e-07 | 1.76e-01 | 0.1131 |
| 9219 | MTA2 | P10T-E | Human | Esophagus | ESCC | 3.44e-08 | 1.99e-01 | 0.116 |
| 9219 | MTA2 | P11T-E | Human | Esophagus | ESCC | 1.91e-11 | 2.45e-01 | 0.1426 |
| 9219 | MTA2 | P12T-E | Human | Esophagus | ESCC | 3.11e-21 | 4.83e-01 | 0.1122 |
| 9219 | MTA2 | P15T-E | Human | Esophagus | ESCC | 1.51e-16 | 1.97e-01 | 0.1149 |
| 9219 | MTA2 | P16T-E | Human | Esophagus | ESCC | 5.67e-16 | 2.76e-01 | 0.1153 |
| 9219 | MTA2 | P17T-E | Human | Esophagus | ESCC | 2.17e-07 | 3.25e-01 | 0.1278 |
| 9219 | MTA2 | P19T-E | Human | Esophagus | ESCC | 3.93e-06 | 4.95e-01 | 0.1662 |
| 9219 | MTA2 | P20T-E | Human | Esophagus | ESCC | 3.84e-19 | 3.30e-01 | 0.1124 |
| 9219 | MTA2 | P21T-E | Human | Esophagus | ESCC | 4.09e-27 | 5.38e-01 | 0.1617 |
| 9219 | MTA2 | P22T-E | Human | Esophagus | ESCC | 4.08e-07 | 1.21e-01 | 0.1236 |
| 9219 | MTA2 | P23T-E | Human | Esophagus | ESCC | 4.68e-09 | 3.91e-01 | 0.108 |
| Page: 1 2 3 4 |
| Tissue | Expression Dynamics | Abbreviation |
| Esophagus | 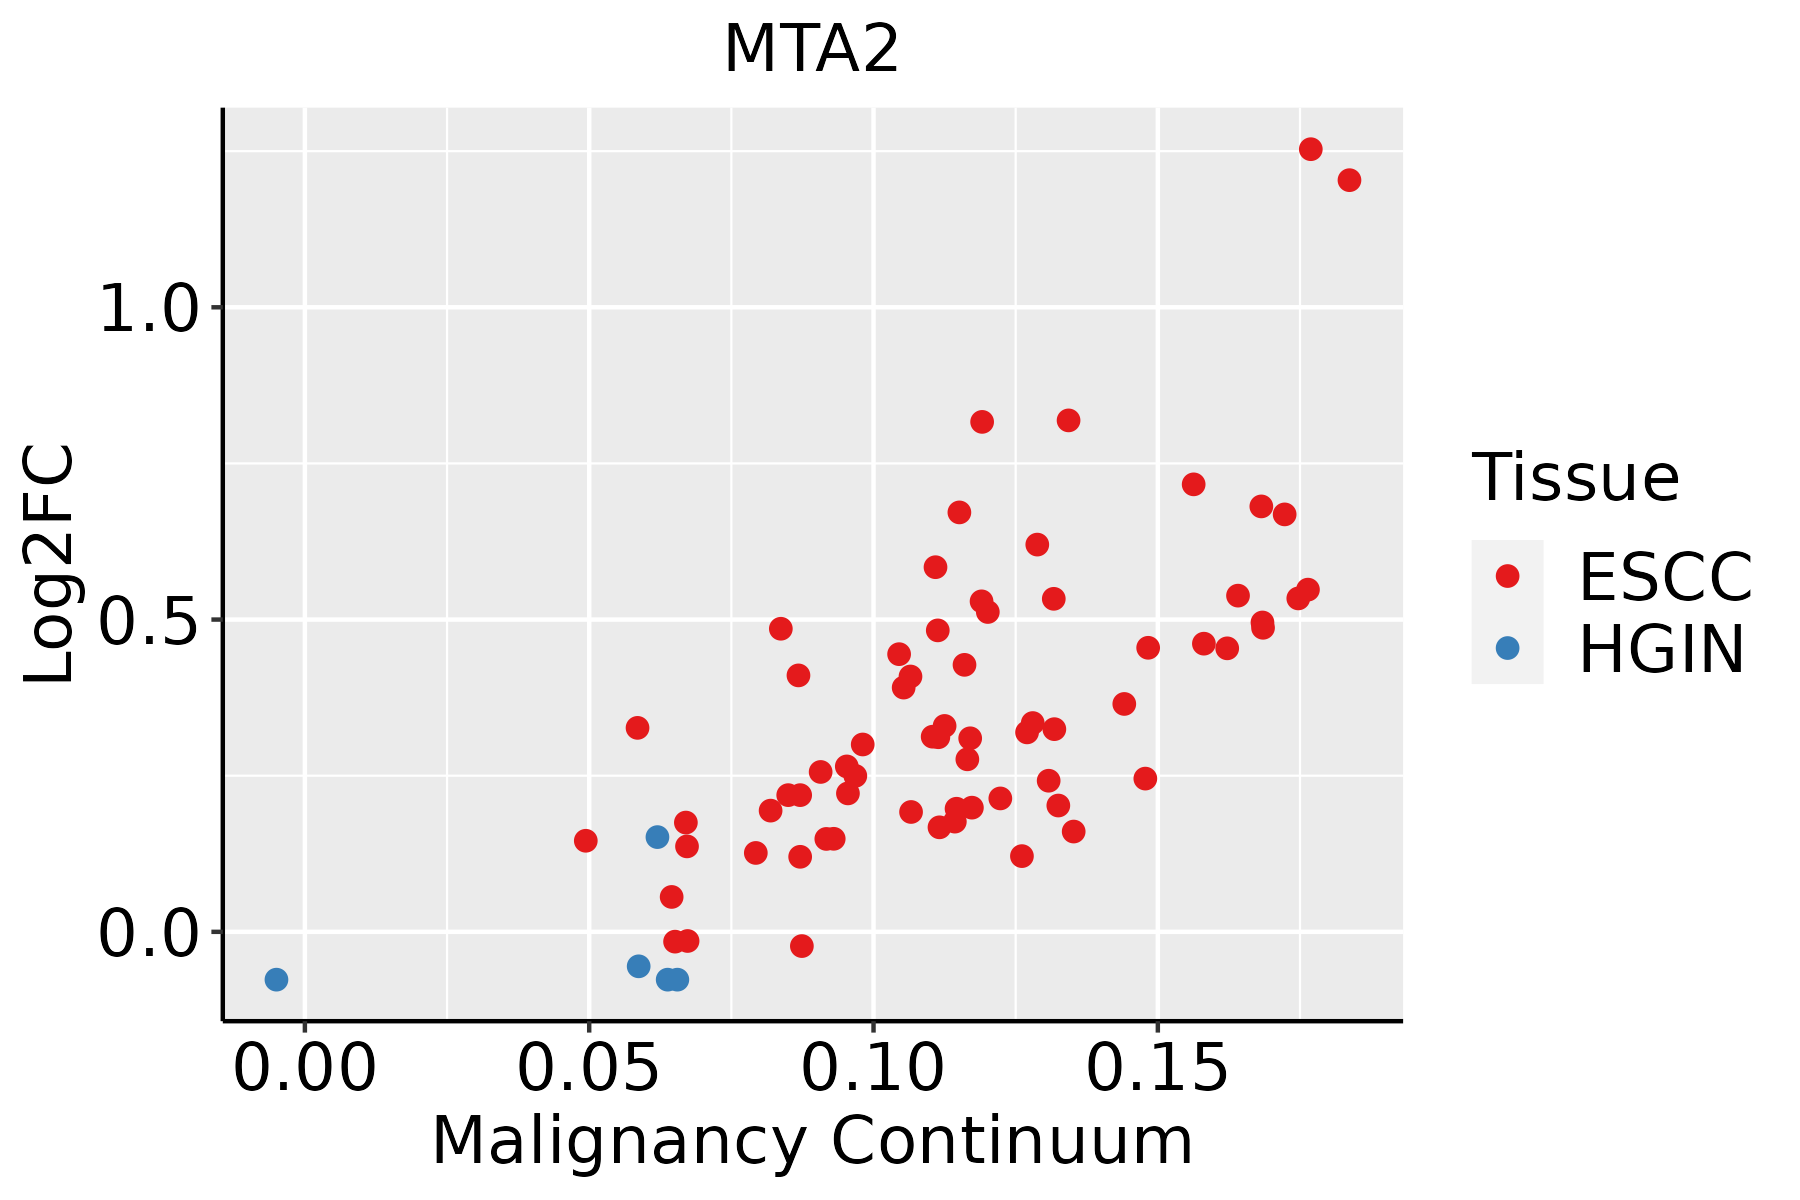 | ESCC: Esophageal squamous cell carcinoma |
| HGIN: High-grade intraepithelial neoplasias | ||
| LGIN: Low-grade intraepithelial neoplasias | ||
| Liver | 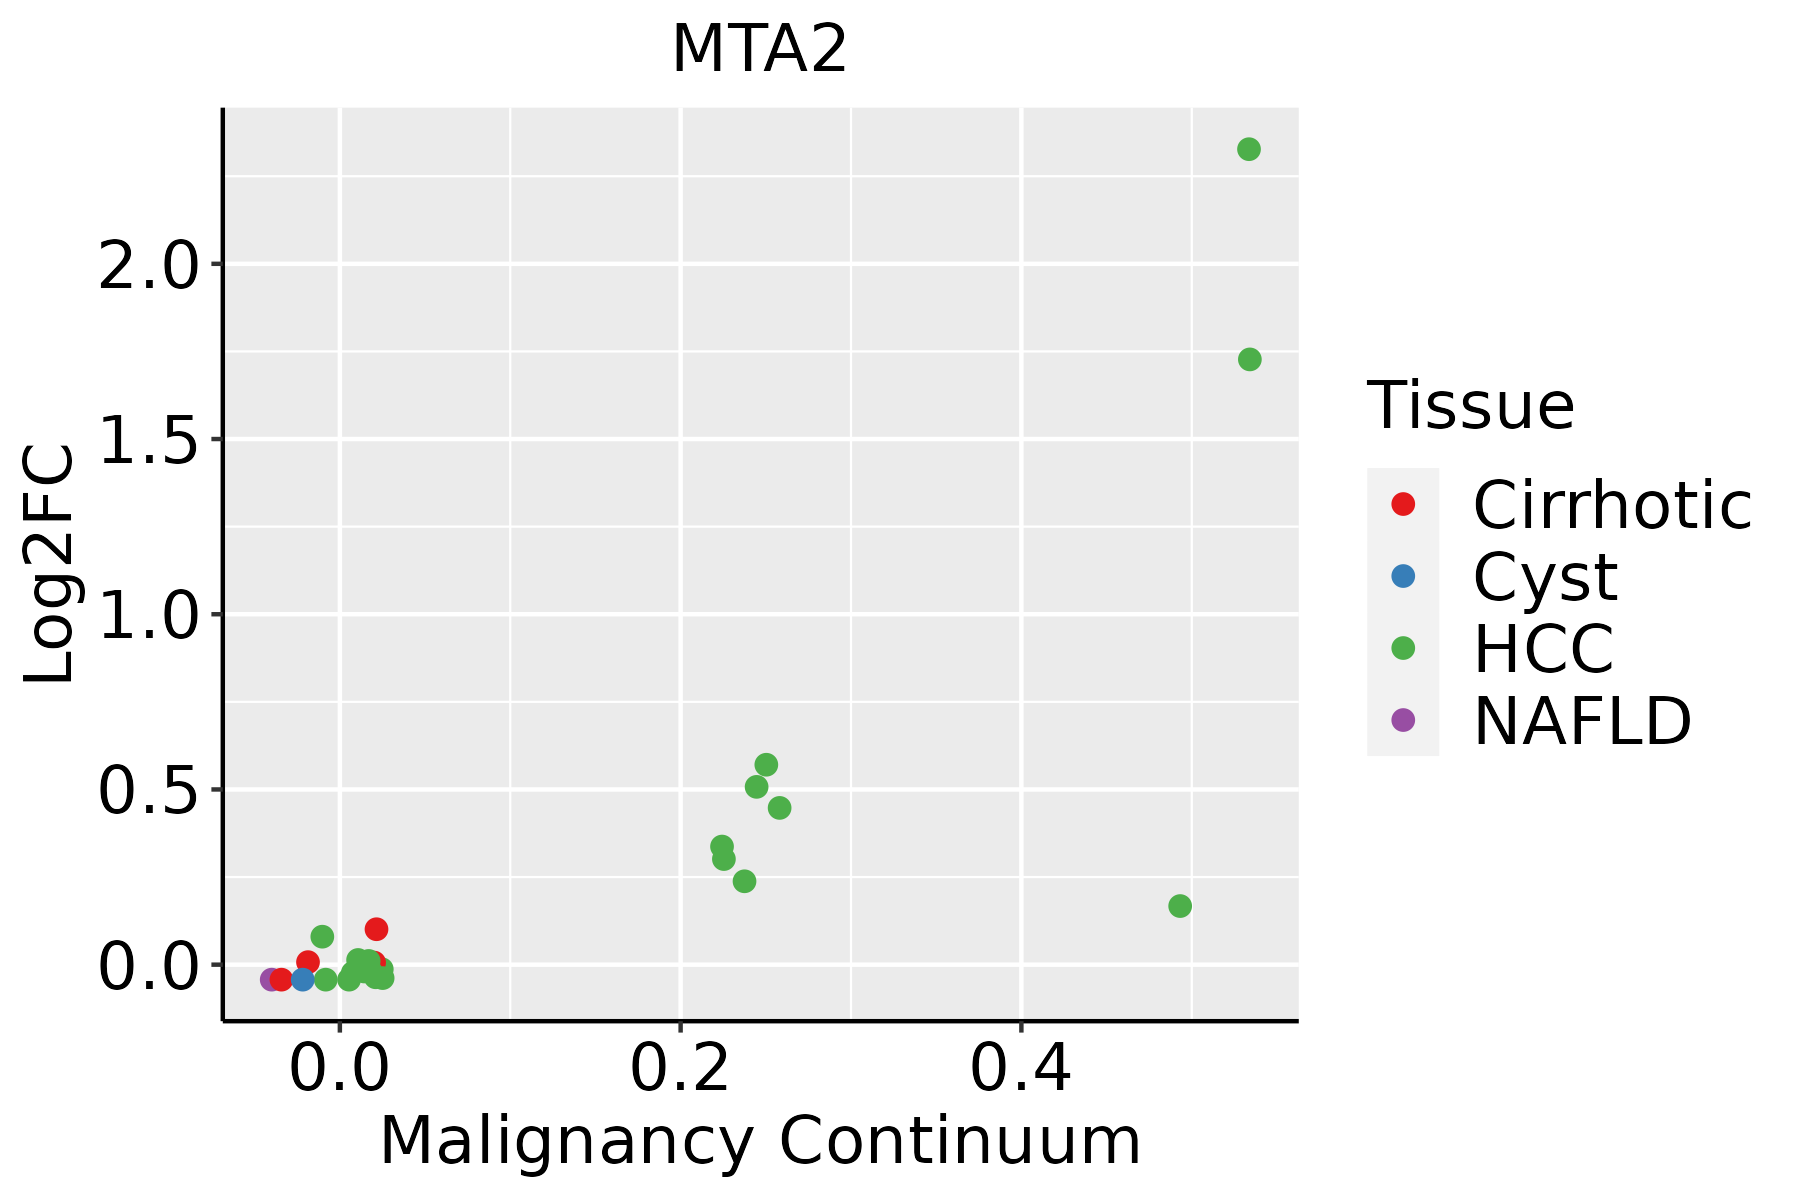 | HCC: Hepatocellular carcinoma |
| NAFLD: Non-alcoholic fatty liver disease |
| ∗log2FC in expression of this searched gene in stem-like cells from each diseased tissue sample relative to stem-like cells in normal samples in each tissue plotted against the malignancy continuum. Samples are colored based on if they are from different disease stage. |
Top |
Malignant transformation related pathway analysis |
| Find out the enriched GO biological processes and KEGG pathways involved in transition from healthy to precancer to cancer |
| Tissue | Disease Stage | Enriched GO biological Processes |
| Colorectum | AD |  |
| Colorectum | SER |  |
| Colorectum | MSS |  |
| Colorectum | MSI-H |  |
| Colorectum | FAP |  |
| ∗Top 15 enriched GO BP terms are showed in the bar plot of each disease state in each tissue. Each row represents a significant GO biological process which is colored according to the -log10(p.adjust). |
| Page: 1 2 3 4 5 6 7 8 9 |
| GO ID | Tissue | Disease Stage | Description | Gene Ratio | Bg Ratio | pvalue | p.adjust | Count |
| GO:001657015 | Esophagus | ESCC | histone modification | 323/8552 | 463/18723 | 2.61e-26 | 7.88e-24 | 323 |
| GO:00434143 | Esophagus | ESCC | macromolecule methylation | 199/8552 | 316/18723 | 3.44e-10 | 9.57e-09 | 199 |
| GO:00322592 | Esophagus | ESCC | methylation | 222/8552 | 364/18723 | 2.26e-09 | 5.09e-08 | 222 |
| GO:000632517 | Esophagus | ESCC | chromatin organization | 240/8552 | 409/18723 | 6.52e-08 | 1.14e-06 | 240 |
| GO:00356015 | Esophagus | ESCC | protein deacylation | 79/8552 | 112/18723 | 8.30e-08 | 1.42e-06 | 79 |
| GO:00987325 | Esophagus | ESCC | macromolecule deacylation | 80/8552 | 116/18723 | 3.19e-07 | 4.50e-06 | 80 |
| GO:00165754 | Esophagus | ESCC | histone deacetylation | 60/8552 | 82/18723 | 3.85e-07 | 5.32e-06 | 60 |
| GO:00064765 | Esophagus | ESCC | protein deacetylation | 70/8552 | 101/18723 | 1.29e-06 | 1.58e-05 | 70 |
| GO:000166720 | Esophagus | ESCC | ameboidal-type cell migration | 250/8552 | 475/18723 | 1.22e-03 | 5.97e-03 | 250 |
| GO:00107619 | Esophagus | ESCC | fibroblast migration | 32/8552 | 47/18723 | 1.59e-03 | 7.43e-03 | 32 |
| GO:0006304 | Esophagus | ESCC | DNA modification | 68/8552 | 120/18723 | 9.95e-03 | 3.42e-02 | 68 |
| GO:001657021 | Liver | HCC | histone modification | 283/7958 | 463/18723 | 2.68e-16 | 2.33e-14 | 283 |
| GO:00434141 | Liver | HCC | macromolecule methylation | 183/7958 | 316/18723 | 2.00e-08 | 4.72e-07 | 183 |
| GO:0032259 | Liver | HCC | methylation | 206/7958 | 364/18723 | 3.35e-08 | 7.53e-07 | 206 |
| GO:00107612 | Liver | HCC | fibroblast migration | 33/7958 | 47/18723 | 1.12e-04 | 9.50e-04 | 33 |
| GO:0098732 | Liver | HCC | macromolecule deacylation | 67/7958 | 116/18723 | 6.46e-04 | 3.99e-03 | 67 |
| GO:000632511 | Liver | HCC | chromatin organization | 206/7958 | 409/18723 | 7.23e-04 | 4.41e-03 | 206 |
| GO:00356011 | Liver | HCC | protein deacylation | 64/7958 | 112/18723 | 1.23e-03 | 6.83e-03 | 64 |
| GO:0010762 | Liver | HCC | regulation of fibroblast migration | 24/7958 | 36/18723 | 2.95e-03 | 1.38e-02 | 24 |
| GO:00064761 | Liver | HCC | protein deacetylation | 55/7958 | 101/18723 | 1.01e-02 | 3.79e-02 | 55 |
| Page: 1 2 |
| Pathway ID | Tissue | Disease Stage | Description | Gene Ratio | Bg Ratio | pvalue | p.adjust | qvalue | Count |
| Page: 1 |
Top |
Cell-cell communication analysis |
| Identification of potential cell-cell interactions between two cell types and their ligand-receptor pairs for different disease states |
| Ligand | Receptor | LRpair | Pathway | Tissue | Disease Stage |
| Page: 1 |
Top |
Single-cell gene regulatory network inference analysis |
| Find out the significant the regulons (TFs) and the target genes of each regulon across cell types for different disease states |
| TF | Cell Type | Tissue | Disease Stage | Target Gene | RSS | Regulon Activity |
| ∗The dot plots of a searched regulon are shown for all cell subpopulations in each disease state of each tissue based on the regulon specific score inferred using pySCENIC and by calculating the average expression. |
| Page: 1 |
Top |
Somatic mutation of malignant transformation related genes |
| Annotation of somatic variants for genes involved in malignant transformation |
| Hugo Symbol | Variant Class | Variant Classification | dbSNP RS | HGVSc | HGVSp | HGVSp Short | SWISSPROT | BIOTYPE | SIFT | PolyPhen | Tumor Sample Barcode | Tissue | Histology | Sex | Age | Stage | Therapy Types | Drugs | Outcome |
| MTA2 | SNV | Missense_Mutation | rs377599047 | c.238N>T | p.Arg80Cys | p.R80C | O94776 | protein_coding | deleterious(0) | possibly_damaging(0.83) | TCGA-AR-A1AO-01 | Breast | breast invasive carcinoma | Female | <65 | I/II | Chemotherapy | doxorubicin | SD |
| MTA2 | SNV | Missense_Mutation | c.1068N>A | p.Met356Ile | p.M356I | O94776 | protein_coding | tolerated(0.14) | benign(0) | TCGA-BH-A0HK-01 | Breast | breast invasive carcinoma | Female | >=65 | I/II | Hormone Therapy | arimidex | SD | |
| MTA2 | insertion | Frame_Shift_Ins | novel | c.214_215insTGTCTGCAGGGCTCTCTGCCATGACCCTGACAGAATGGGCCTGTAG | p.Gln72LeufsTer21 | p.Q72Lfs*21 | O94776 | protein_coding | TCGA-A8-A07J-01 | Breast | breast invasive carcinoma | Female | <65 | I/II | Chemotherapy | 5-fluorouracil | CR | ||
| MTA2 | deletion | Frame_Shift_Del | c.129_130delNN | p.Cys44SerfsTer9 | p.C44Sfs*9 | O94776 | protein_coding | TCGA-C8-A26Y-01 | Breast | breast invasive carcinoma | Female | >=65 | I/II | Unknown | Unknown | SD | |||
| MTA2 | deletion | Frame_Shift_Del | c.385delN | p.Tyr129ThrfsTer33 | p.Y129Tfs*33 | O94776 | protein_coding | TCGA-D8-A1XK-01 | Breast | breast invasive carcinoma | Female | <65 | I/II | Chemotherapy | doxorubicine+cyclophosphamide | SD | |||
| MTA2 | SNV | Missense_Mutation | novel | c.1066N>G | p.Met356Val | p.M356V | O94776 | protein_coding | tolerated(1) | benign(0) | TCGA-2W-A8YY-01 | Cervix | cervical & endocervical cancer | Female | <65 | I/II | Chemotherapy | cisplatin | CR |
| MTA2 | SNV | Missense_Mutation | novel | c.43N>A | p.Glu15Lys | p.E15K | O94776 | protein_coding | deleterious(0) | probably_damaging(0.973) | TCGA-C5-A1BJ-01 | Cervix | cervical & endocervical cancer | Female | <65 | I/II | Unknown | Unknown | SD |
| MTA2 | SNV | Missense_Mutation | c.1197N>C | p.Lys399Asn | p.K399N | O94776 | protein_coding | deleterious(0) | probably_damaging(0.987) | TCGA-JW-A5VL-01 | Cervix | cervical & endocervical cancer | Female | <65 | I/II | Unknown | Unknown | SD | |
| MTA2 | SNV | Missense_Mutation | novel | c.1846N>A | p.Leu616Ile | p.L616I | O94776 | protein_coding | tolerated_low_confidence(0.95) | possibly_damaging(0.899) | TCGA-A6-2672-01 | Colorectum | colon adenocarcinoma | Female | >=65 | III/IV | Unknown | Unknown | SD |
| MTA2 | SNV | Missense_Mutation | c.325N>G | p.Thr109Ala | p.T109A | O94776 | protein_coding | tolerated(0.23) | probably_damaging(0.973) | TCGA-AA-3492-01 | Colorectum | colon adenocarcinoma | Female | >=65 | I/II | Unknown | Unknown | SD |
| Page: 1 2 3 4 5 6 |
Top |
Related drugs of malignant transformation related genes |
| Identification of chemicals and drugs interact with genes involved in malignant transfromation |
| (DGIdb 4.0) |
| Entrez ID | Symbol | Category | Interaction Types | Drug Claim Name | Drug Name | PMIDs |
| Page: 1 |

Copyright 2023-Present -The University of Texas Health Science Center at Houston |