
|
|||||
|
 | |
| |
| |
| |
| |
| |
|
Gene: MTA1 |
Gene summary for MTA1 |
| Gene information | Species | Human | Gene symbol | MTA1 | Gene ID | 9112 |
| Gene name | metastasis associated 1 | |
| Gene Alias | MTA1 | |
| Cytomap | 14q32.33 | |
| Gene Type | protein-coding | GO ID | GO:0000122 | UniProtAcc | Q13330 |
Top |
Malignant transformation analysis |
| Identification of the aberrant gene expression in precancerous and cancerous lesions by comparing the gene expression of stem-like cells in diseased tissues with normal stem cells |
| Entrez ID | Symbol | Replicates | Species | Organ | Tissue | Adj P-value | Log2FC | Malignancy |
| 9112 | MTA1 | LZE2T | Human | Esophagus | ESCC | 9.74e-05 | 5.95e-01 | 0.082 |
| 9112 | MTA1 | LZE4T | Human | Esophagus | ESCC | 1.45e-03 | -3.60e-04 | 0.0811 |
| 9112 | MTA1 | LZE5T | Human | Esophagus | ESCC | 2.95e-02 | 3.24e-01 | 0.0514 |
| 9112 | MTA1 | LZE22T | Human | Esophagus | ESCC | 3.92e-06 | 2.99e-01 | 0.068 |
| 9112 | MTA1 | LZE24T | Human | Esophagus | ESCC | 1.62e-15 | 1.17e-01 | 0.0596 |
| 9112 | MTA1 | P1T-E | Human | Esophagus | ESCC | 7.85e-13 | 3.68e-01 | 0.0875 |
| 9112 | MTA1 | P2T-E | Human | Esophagus | ESCC | 6.01e-17 | 2.62e-01 | 0.1177 |
| 9112 | MTA1 | P4T-E | Human | Esophagus | ESCC | 4.10e-29 | 7.81e-01 | 0.1323 |
| 9112 | MTA1 | P5T-E | Human | Esophagus | ESCC | 2.22e-21 | 3.53e-01 | 0.1327 |
| 9112 | MTA1 | P8T-E | Human | Esophagus | ESCC | 4.30e-43 | 1.15e+00 | 0.0889 |
| 9112 | MTA1 | P9T-E | Human | Esophagus | ESCC | 3.30e-07 | 9.21e-02 | 0.1131 |
| 9112 | MTA1 | P10T-E | Human | Esophagus | ESCC | 4.45e-27 | 5.67e-01 | 0.116 |
| 9112 | MTA1 | P11T-E | Human | Esophagus | ESCC | 2.25e-06 | 1.80e-01 | 0.1426 |
| 9112 | MTA1 | P12T-E | Human | Esophagus | ESCC | 5.71e-37 | 6.95e-01 | 0.1122 |
| 9112 | MTA1 | P15T-E | Human | Esophagus | ESCC | 1.29e-53 | 1.15e+00 | 0.1149 |
| 9112 | MTA1 | P16T-E | Human | Esophagus | ESCC | 5.83e-37 | 6.92e-01 | 0.1153 |
| 9112 | MTA1 | P17T-E | Human | Esophagus | ESCC | 2.61e-06 | 3.00e-01 | 0.1278 |
| 9112 | MTA1 | P19T-E | Human | Esophagus | ESCC | 2.84e-04 | 3.76e-01 | 0.1662 |
| 9112 | MTA1 | P20T-E | Human | Esophagus | ESCC | 5.55e-11 | 2.32e-01 | 0.1124 |
| 9112 | MTA1 | P21T-E | Human | Esophagus | ESCC | 1.10e-17 | 3.65e-01 | 0.1617 |
| Page: 1 2 3 4 5 |
| Tissue | Expression Dynamics | Abbreviation |
| Esophagus | 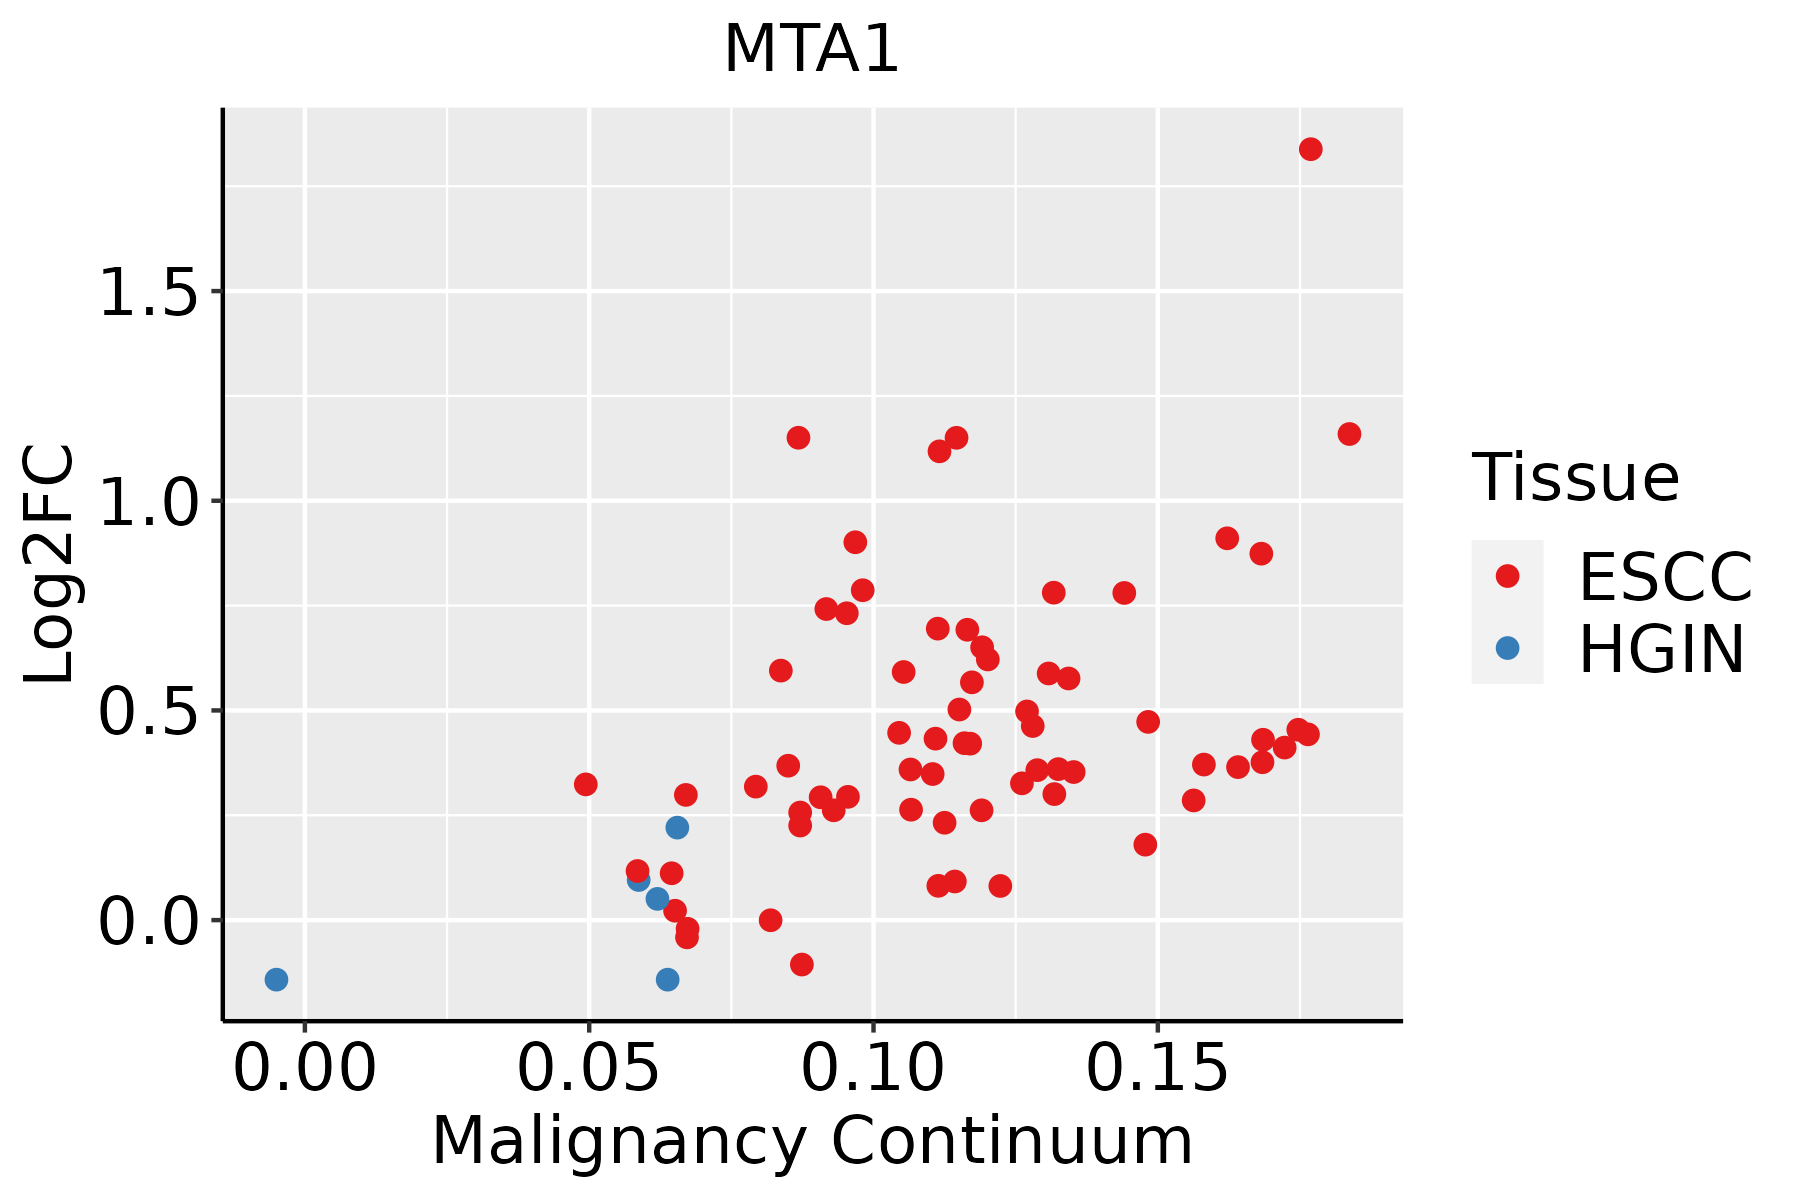 | ESCC: Esophageal squamous cell carcinoma |
| HGIN: High-grade intraepithelial neoplasias | ||
| LGIN: Low-grade intraepithelial neoplasias | ||
| Oral Cavity | 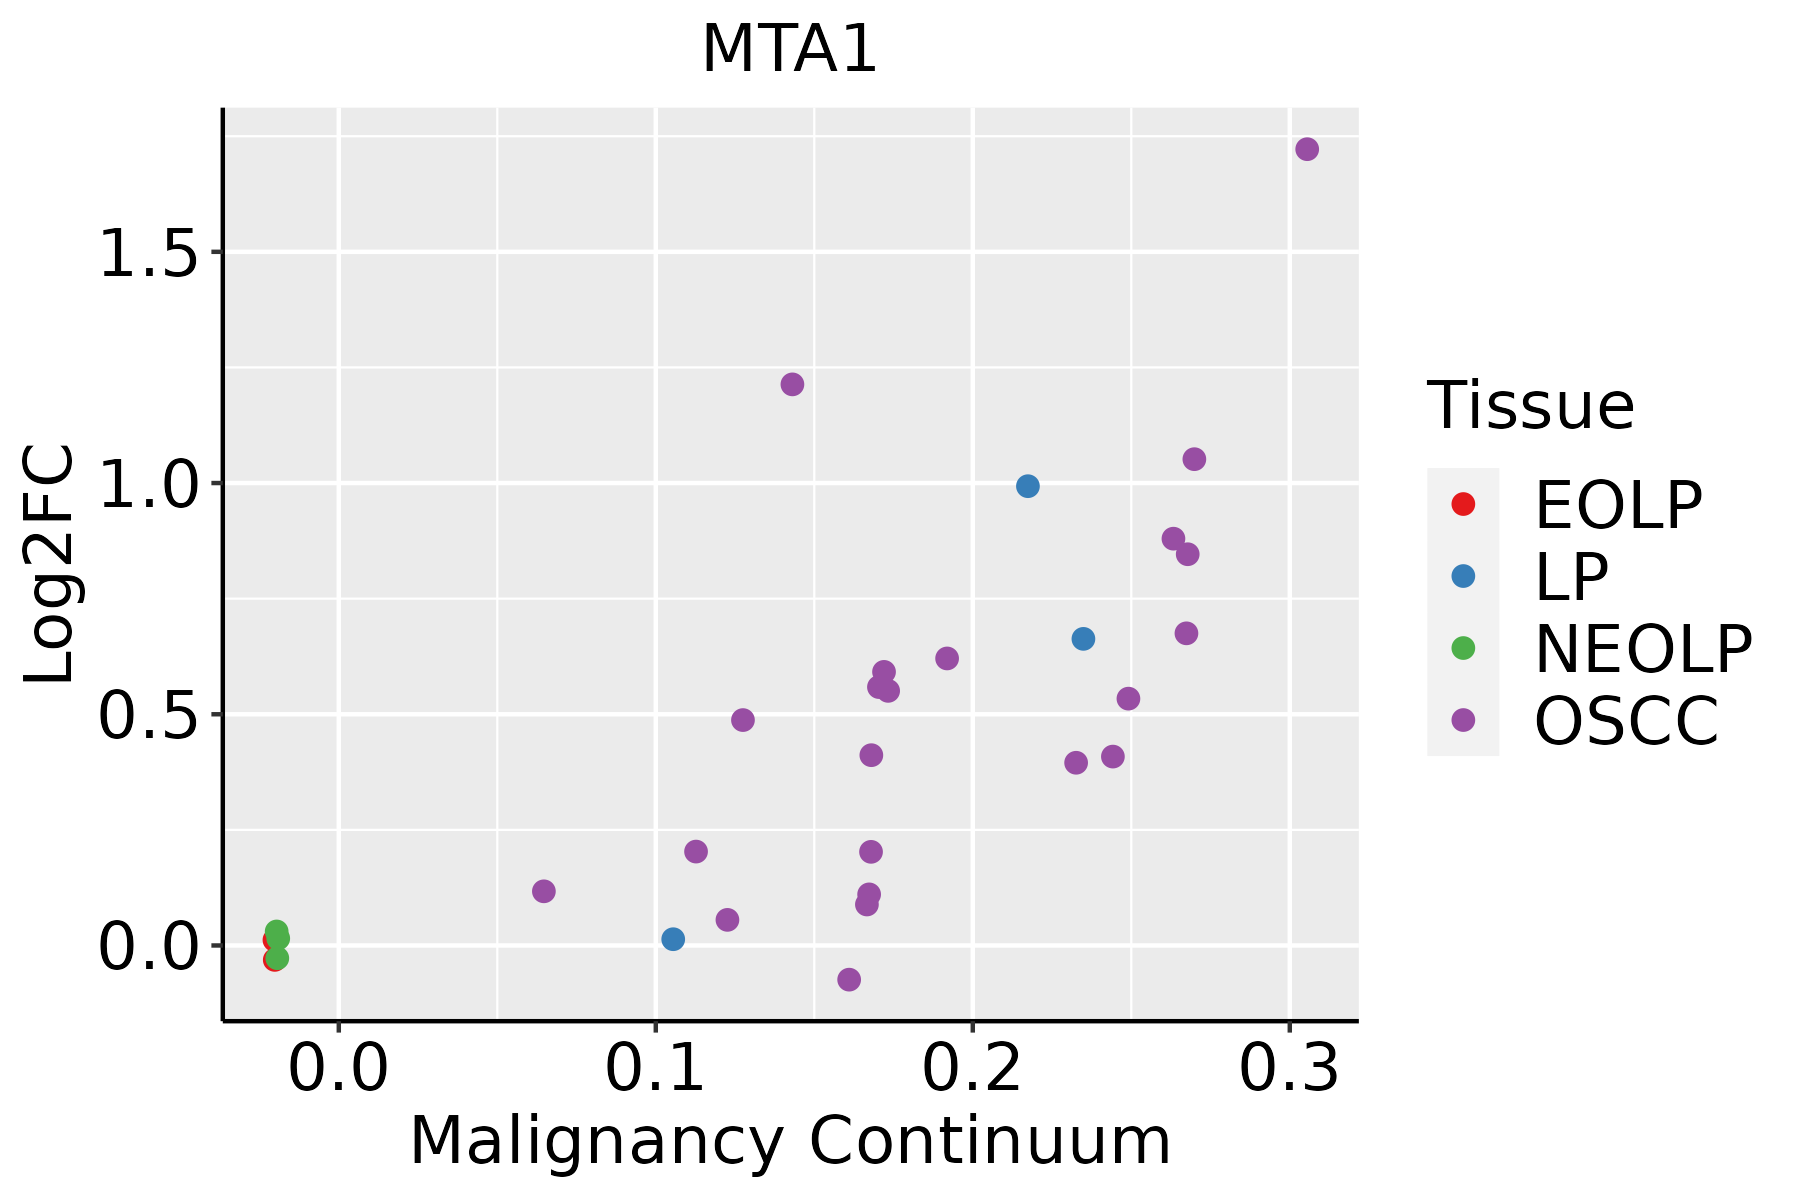 | EOLP: Erosive Oral lichen planus |
| LP: leukoplakia | ||
| NEOLP: Non-erosive oral lichen planus | ||
| OSCC: Oral squamous cell carcinoma | ||
| Thyroid | 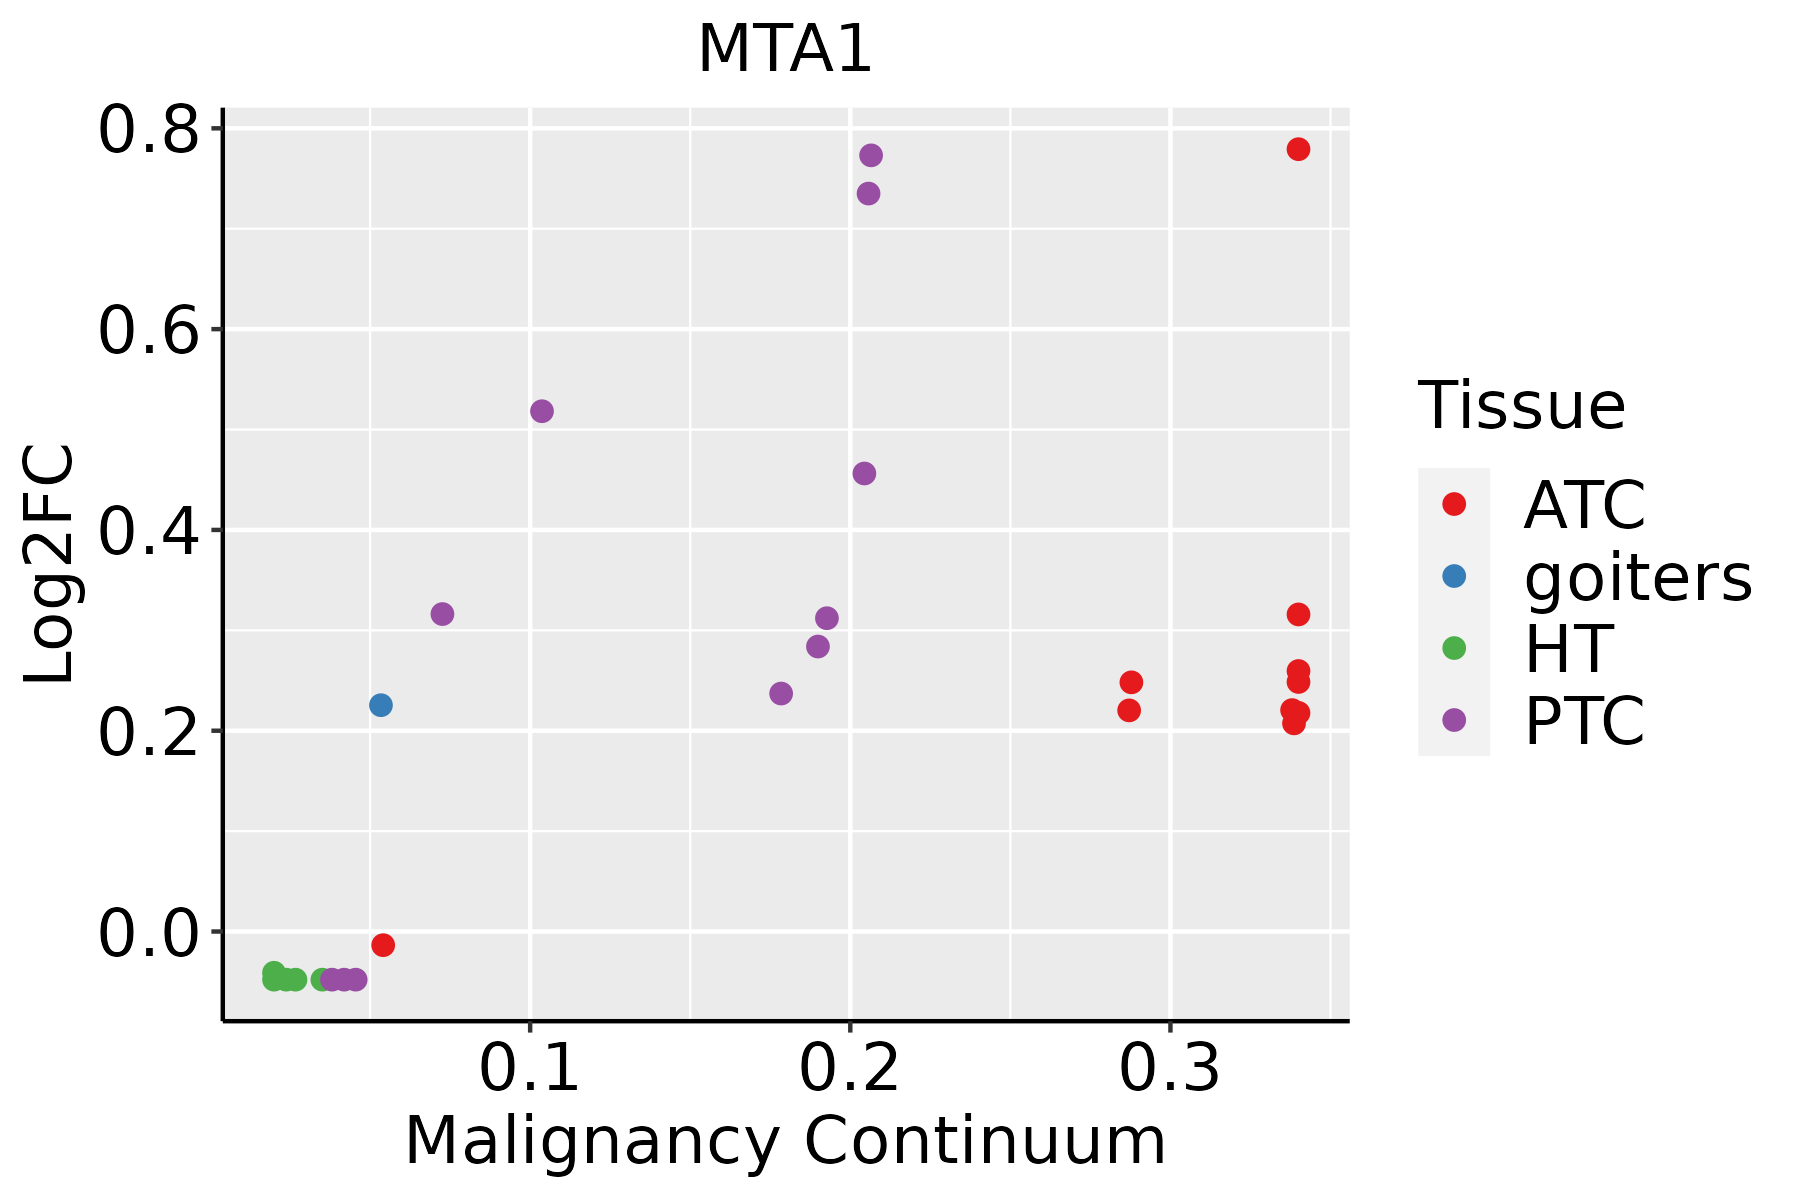 | ATC: Anaplastic thyroid cancer |
| HT: Hashimoto's thyroiditis | ||
| PTC: Papillary thyroid cancer |
| ∗log2FC in expression of this searched gene in stem-like cells from each diseased tissue sample relative to stem-like cells in normal samples in each tissue plotted against the malignancy continuum. Samples are colored based on if they are from different disease stage. |
Top |
Malignant transformation related pathway analysis |
| Find out the enriched GO biological processes and KEGG pathways involved in transition from healthy to precancer to cancer |
| Tissue | Disease Stage | Enriched GO biological Processes |
| Colorectum | AD |  |
| Colorectum | SER |  |
| Colorectum | MSS |  |
| Colorectum | MSI-H |  |
| Colorectum | FAP |  |
| ∗Top 15 enriched GO BP terms are showed in the bar plot of each disease state in each tissue. Each row represents a significant GO biological process which is colored according to the -log10(p.adjust). |
| Page: 1 2 3 4 5 6 7 8 9 |
| GO ID | Tissue | Disease Stage | Description | Gene Ratio | Bg Ratio | pvalue | p.adjust | Count |
| GO:00353049 | Breast | Precancer | regulation of protein dephosphorylation | 14/1080 | 90/18723 | 6.16e-04 | 7.72e-03 | 14 |
| GO:003530414 | Breast | IDC | regulation of protein dephosphorylation | 18/1434 | 90/18723 | 1.39e-04 | 2.48e-03 | 18 |
| GO:003530423 | Breast | DCIS | regulation of protein dephosphorylation | 18/1390 | 90/18723 | 9.33e-05 | 1.71e-03 | 18 |
| GO:00353039 | Breast | DCIS | regulation of dephosphorylation | 18/1390 | 128/18723 | 6.44e-03 | 4.58e-02 | 18 |
| GO:00508481 | Breast | DCIS | regulation of calcium-mediated signaling | 12/1390 | 73/18723 | 7.17e-03 | 4.85e-02 | 12 |
| GO:0016311 | Colorectum | AD | dephosphorylation | 123/3918 | 417/18723 | 1.84e-05 | 3.82e-04 | 123 |
| GO:0006470 | Colorectum | AD | protein dephosphorylation | 88/3918 | 281/18723 | 2.56e-05 | 4.89e-04 | 88 |
| GO:0035303 | Colorectum | AD | regulation of dephosphorylation | 46/3918 | 128/18723 | 6.20e-05 | 1.04e-03 | 46 |
| GO:0035304 | Colorectum | AD | regulation of protein dephosphorylation | 33/3918 | 90/18723 | 4.23e-04 | 4.77e-03 | 33 |
| GO:0035306 | Colorectum | AD | positive regulation of dephosphorylation | 22/3918 | 59/18723 | 2.86e-03 | 2.14e-02 | 22 |
| GO:00353032 | Colorectum | MSS | regulation of dephosphorylation | 41/3467 | 128/18723 | 1.64e-04 | 2.33e-03 | 41 |
| GO:00353042 | Colorectum | MSS | regulation of protein dephosphorylation | 30/3467 | 90/18723 | 5.58e-04 | 6.19e-03 | 30 |
| GO:00064702 | Colorectum | MSS | protein dephosphorylation | 73/3467 | 281/18723 | 1.15e-03 | 1.12e-02 | 73 |
| GO:00163112 | Colorectum | MSS | dephosphorylation | 101/3467 | 417/18723 | 1.98e-03 | 1.70e-02 | 101 |
| GO:00163113 | Colorectum | FAP | dephosphorylation | 95/2622 | 417/18723 | 7.07e-07 | 3.32e-05 | 95 |
| GO:00064704 | Colorectum | FAP | protein dephosphorylation | 69/2622 | 281/18723 | 1.47e-06 | 6.39e-05 | 69 |
| GO:00353034 | Colorectum | FAP | regulation of dephosphorylation | 36/2622 | 128/18723 | 2.22e-05 | 5.28e-04 | 36 |
| GO:00353044 | Colorectum | FAP | regulation of protein dephosphorylation | 24/2622 | 90/18723 | 1.12e-03 | 1.08e-02 | 24 |
| GO:0048016 | Colorectum | FAP | inositol phosphate-mediated signaling | 16/2622 | 55/18723 | 2.78e-03 | 2.15e-02 | 16 |
| GO:00353061 | Colorectum | FAP | positive regulation of dephosphorylation | 16/2622 | 59/18723 | 5.95e-03 | 3.75e-02 | 16 |
| Page: 1 2 3 4 5 6 7 8 9 10 11 |
| Pathway ID | Tissue | Disease Stage | Description | Gene Ratio | Bg Ratio | pvalue | p.adjust | qvalue | Count |
| Page: 1 |
Top |
Cell-cell communication analysis |
| Identification of potential cell-cell interactions between two cell types and their ligand-receptor pairs for different disease states |
| Ligand | Receptor | LRpair | Pathway | Tissue | Disease Stage |
| Page: 1 |
Top |
Single-cell gene regulatory network inference analysis |
| Find out the significant the regulons (TFs) and the target genes of each regulon across cell types for different disease states |
| TF | Cell Type | Tissue | Disease Stage | Target Gene | RSS | Regulon Activity |
| ∗The dot plots of a searched regulon are shown for all cell subpopulations in each disease state of each tissue based on the regulon specific score inferred using pySCENIC and by calculating the average expression. |
| Page: 1 |
Top |
Somatic mutation of malignant transformation related genes |
| Annotation of somatic variants for genes involved in malignant transformation |
| Hugo Symbol | Variant Class | Variant Classification | dbSNP RS | HGVSc | HGVSp | HGVSp Short | SWISSPROT | BIOTYPE | SIFT | PolyPhen | Tumor Sample Barcode | Tissue | Histology | Sex | Age | Stage | Therapy Types | Drugs | Outcome |
| MTA1 | SNV | Missense_Mutation | novel | c.850N>A | p.Glu284Lys | p.E284K | Q13330 | protein_coding | deleterious(0.03) | possibly_damaging(0.701) | TCGA-2W-A8YY-01 | Cervix | cervical & endocervical cancer | Female | <65 | I/II | Chemotherapy | cisplatin | CR |
| MTA1 | SNV | Missense_Mutation | rs782773381 | c.1334G>A | p.Arg445His | p.R445H | Q13330 | protein_coding | deleterious(0.02) | benign(0.015) | TCGA-EA-A3HU-01 | Cervix | cervical & endocervical cancer | Female | <65 | I/II | Unknown | Unknown | SD |
| MTA1 | SNV | Missense_Mutation | c.359N>T | p.Thr120Met | p.T120M | Q13330 | protein_coding | deleterious(0) | probably_damaging(0.982) | TCGA-MU-A51Y-01 | Cervix | cervical & endocervical cancer | Female | <65 | I/II | Unknown | Unknown | SD | |
| MTA1 | SNV | Missense_Mutation | rs782756415 | c.232G>A | p.Gly78Ser | p.G78S | Q13330 | protein_coding | tolerated(0.14) | benign(0.03) | TCGA-A6-6780-01 | Colorectum | colon adenocarcinoma | Male | >=65 | I/II | Unknown | Unknown | SD |
| MTA1 | SNV | Missense_Mutation | novel | c.196T>A | p.Ser66Thr | p.S66T | Q13330 | protein_coding | tolerated(0.58) | benign(0.001) | TCGA-AA-3845-01 | Colorectum | colon adenocarcinoma | Female | >=65 | I/II | Unknown | Unknown | PD |
| MTA1 | SNV | Missense_Mutation | rs368709921 | c.1000N>A | p.Asp334Asn | p.D334N | Q13330 | protein_coding | tolerated(0.07) | possibly_damaging(0.581) | TCGA-AD-6964-01 | Colorectum | colon adenocarcinoma | Male | <65 | III/IV | Chemotherapy | folfox | PD |
| MTA1 | SNV | Missense_Mutation | c.1828N>A | p.Gly610Arg | p.G610R | Q13330 | protein_coding | tolerated(0.06) | benign(0.12) | TCGA-AZ-6598-01 | Colorectum | colon adenocarcinoma | Female | >=65 | I/II | Unknown | Unknown | SD | |
| MTA1 | SNV | Missense_Mutation | c.1243C>T | p.Arg415Cys | p.R415C | Q13330 | protein_coding | deleterious(0) | probably_damaging(0.996) | TCGA-CA-6717-01 | Colorectum | colon adenocarcinoma | Male | <65 | I/II | Chemotherapy | oxaliplatin | CR | |
| MTA1 | SNV | Missense_Mutation | c.1457N>A | p.Cys486Tyr | p.C486Y | Q13330 | protein_coding | deleterious(0) | possibly_damaging(0.814) | TCGA-CK-4951-01 | Colorectum | colon adenocarcinoma | Female | >=65 | I/II | Unknown | Unknown | PD | |
| MTA1 | SNV | Missense_Mutation | c.1972T>C | p.Phe658Leu | p.F658L | Q13330 | protein_coding | tolerated(0.23) | benign(0.026) | TCGA-CK-6746-01 | Colorectum | colon adenocarcinoma | Female | >=65 | I/II | Unknown | Unknown | SD |
| Page: 1 2 3 4 5 6 7 8 |
Top |
Related drugs of malignant transformation related genes |
| Identification of chemicals and drugs interact with genes involved in malignant transfromation |
| (DGIdb 4.0) |
| Entrez ID | Symbol | Category | Interaction Types | Drug Claim Name | Drug Name | PMIDs |
| Page: 1 |

Copyright 2023-Present -The University of Texas Health Science Center at Houston |